





Introduction
Development is iterative and reciprocal. From birth, ongoing interactions between a child and their caregivers, peers, and other social partners, drive incremental changes in the child’s behavior. Simultaneously, the behavior of a child’s caregivers and social partners is shaped by that child’s behavior. These fundamentally dyadic components of development, formalized most clearly in Sameroff’s transactional model (1975), are often illustrated through the metaphor of a ping-pong match, in which early social interactions can be understood as a series of increasingly sustained and sophisticated volleys between the child and their social partners (Shonkoff & Bales, Reference Shonkoff and Bales2011). Considerable empirical evidence in support of the transactional model has emerged in the fifty years since its introduction (Bornstein et al., Reference Bornstein, Putnick and Lansford2011; Pinquart, Reference Pinquart2017; Sameroff, Reference Sameroff2009). Notably, these principles offer insight into developmental domains beyond socialization, including motor and adaptive skill development (Bradshaw et al., Reference Bradshaw, Schwichtenberg and Iverson2022).
What happens when a novice ping-pong player does not progress? As lessons continue, their coach may become fatigued, perhaps more easily frustrated, and may be less inclined to create new learning opportunities. Although such reactions are understandable, reduced frequency and quality of practice opportunities may inadvertently reinforce the novice ping-pong player’s early difficulties and constrain later chances for improvement.
The underlying logic of the transactional model can extend naturally to any developmental domain that relies on repeated opportunities for practice and feedback. Adaptive behaviors, including daily living skills (DLS), develop through ongoing interactions between individuals and their environments, in which expectations, opportunities, and supports are continually adjusted in response to the individual’s prior performance. Broadly speaking, DLS can be defined as independence in completing age-salient tasks necessary for autonomy in everyday life. For example, shoe tying is an emerging DLS for many five-year-olds, who often gain competency in this life skill through explicit instruction from parents, teachers, and other caregivers, as well as repeated opportunities for practice. When early difficulties in DLS limit successful engagement with everyday tasks, caregivers may reduce the frequency or complexity of subsequent opportunities provided, thereby limiting further skill development (Teh et al., Reference Teh, Vo and Bal2023). If a nine-year-old has still not mastered shoe tying, their caregiver may purchase Velcro and slip-on shoes, thereby reducing future opportunities for practice. Despite the clear relevance of transactional processes to adaptive functioning, relatively little research has considered these theoretical mechanisms in this developmental domain.
Developmental cascades of DLS in autism
The concept of developmental cascades extends the transactional model to describe how early successes or challenges may compound over time (Bradshaw et al., Reference Bradshaw, Gillespie, Klaiman, Klin and Saulnier2019; Mundy & Bullen, Reference Mundy and Bullen2022). Rather than reflecting isolated delays, early differences in DLS acquisition may initiate cascades that amplify initial disadvantages through reduced opportunities for DLS practice and altered expectations for DLS performance. As a result, small differences early in life may result in increasingly divergent outcomes in later development, producing the “snowball effects” frequently observed in longitudinal studies (Matsen & Cichetti, Reference Masten and Cicchetti2010).
Autism spectrum disorder (referred to throughout as “autism”) provides a particularly compelling context in which to examine transactional and cascading processes in DLS. Though not a core diagnostic feature of the condition, cross-sectional work indicates that autistic individuals with average or higher cognitive ability frequently exhibit challenges with DLS relative to age expectations (Alvares et al., Reference Alvares, Bebbington, Cleary, Evans, Glasson, Maybery, Pillar, Uljarević, Varcin, Wray and Whitehouse2020; Duncan & Bishop, Reference Duncan and Bishop2015; Kanne et al., Reference Kanne, Gerber, Quirmbach, Sparrow, Cicchetti and Saulnier2011). These DLS challenges emerge early in life (Bradshaw et al., Reference Bradshaw, Gillespie, Klaiman, Klin and Saulnier2019) and appear to persist into adulthood (Clarke et al., Reference Clarke, McCauley and Lord2021b; Kraper et al., Reference Kraper, Kenworthy, Popal, Martin and Wallace2017). Early DLS differences may shape the expectations and supports provided by caregivers, educators, and service systems. Over time, these early DLS differences may initiate negative developmental cascades, in which autistic individuals receive limited access to increasingly complex opportunities for DLS independence. In turn, this may contribute to the more limited adult outcomes that are disproportionately observed among autistic individuals (for reviews, see Magiati et al., Reference Magiati, Tay and Howlin2014 and Mason et al., Reference Mason, Capp, Stewart, Kempton, Glaser, Howlin and Happé2021). Figure 1, Panel A, depicts possible contributing factors to one such negative developmental cascade, along with its possible downstream consequences. Cascades were not explicitly measured or assessed in the current study; thus these descriptions of DLS cascades are speculative.
Developmental cascades of DLS in autism. Note. Panels A and B illustrate possible theoretical pathways, not proposed structural equation models (SEM). Many behavioral and demographic characteristics likely influence such cascades, only a handful of which are depicted here. Cascades were not explicitly measured or assessed in the current study; thus these descriptions of DLS cascades are speculative.

Figure 1. Long description
A diagram illustrating the concept of developmental cascades in DLS, showing negative and positive pathways. Panel A: Negative DLS Cascade. This panel shows a flowchart starting with ‘Childhood Delays in DLS’ influenced by ‘Cognitive Ability’, ‘Autism Features’, and ‘Language’. These delays lead to ‘Limited Adolescent Autonomy’, which further results in ‘Adult Challenges’ affecting ‘Living Status’, ‘Relationships’, ‘Subjective Well-Being’, and ‘Employment’. Panel B: Positive DLS Cascade with Promotive Factors. This panel shows a flowchart starting with ‘Childhood Delays in DLS’ influenced by ‘Cognitive Ability’, ‘Autism Features’, and ‘Language’. These delays are mitigated by ‘Sustained DLS Practice’, ‘DLS Learning Opportunities’, and ‘High Expectations for DLS’, leading to ‘Emerging Adolescent Autonomy’. This autonomy results in ‘Adult Competence’ affecting ‘Living Status’, ‘Relationships’, ‘Subjective Well-Being’, and ‘Employment’.
As illustrated in Figure 1, Panel B, daily living skills may represent a particularly promising target for interrupting negative developmental cascades that may interfere with autistic individuals’ opportunities to excel in adult life. DLS develop incrementally, providing multiple opportunities for intervention across development. They are also malleable and responsive to environmental supports (Duncan et al., Reference Duncan, Ruble, Meinzen-Derr, Thomas and Stark2018, Reference Duncan, Meinzen-Derr, Ruble, Fassler and Stark2026), making them well suited to transactional frameworks that emphasize bidirectional influence between individuals and contexts. Importantly, DLS can be meaningfully assessed and improved in individuals of a range of cognitive and language abilities, making them a relevant area of inquiry for individuals across the heterogeneity of the autism spectrum (Clarke et al., Reference Clarke and Lord2025; Teh et al., Reference Teh, Vo and Bal2023).
DLS (and adaptive function more broadly) are robust predictors of adult outcomes in autism, including post-secondary education (Clarke et al., Reference Clarke, McCauley and Lord2021b), employment (Chan et al., Reference Chan, Smith, Hong, Greenberg and Mailick2017; Roux et al., Reference Roux, Shattuck, Cooper, Anderson, Wagner and Narendorf2013), and social relationships (Clarke & Lord, Reference Clarke and Lord2024; Seltzer et al., Reference Seltzer, Shattuck, Abbeduto and Greenberg2004), often exceeding the predictive value of cognitive ability alone (Mason et al., Reference Mason, Capp, Stewart, Kempton, Glaser, Howlin and Happé2021). Moreover, autistic individuals and their families consistently identify autonomy and independence as personal priorities (Al Ansari et al., Reference Al Ansari, Edwards and Gibbs2024). Supporting and understanding the development of DLS which directly foster independence and autonomy are therefore paramount for autistic individuals and the communities that aim to support them.
Item-level analyses of DLS
Despite the potential utility of item-level analyses for characterizing autism specific challenges with adaptive functioning, only five published studies have analyzed item-level adaptive behavior data in autism. All were cross-sectional and relied upon relatively simple statistical methods, such as Fisher’s exact tests (Ventola et al., Reference Ventola, Saulnier, Steinberg, Chawarska and Klin2014), t-tests (Balboni et al., Reference Balboni, Tasso, Muratori and Cubelli2016; Glover et al., Reference Glover, Liddle, Fassler and Duncan2023; Teh et al., Reference Teh, Vo and Bal2023), and MANOVA (Glover et al., Reference Glover, Liddle, Fassler and Duncan2023; Paul et al., Reference Paul, Miles, Cicchetti, Sparrow, Klin, Volkmar, Coflin and Booker2004). Simpler statistical approaches to item-level analyses necessitate large numbers of tests and increase the likelihood for Type I error. Only two of the studies (Glover et al., Reference Glover, Liddle, Fassler and Duncan2023; Teh et al., Reference Teh, Vo and Bal2023) examined adaptive behavior into adolescence and adulthood. Teh and colleagues (Reference Teh, Vo and Bal2023) applied a novel coding system to identify reasons why participants reportedly “Never or Seldom” completed certain skills independently; the most cited reason was lack of opportunity to learn or implement the skill in question (Teh et al., Reference Teh, Vo and Bal2023). Importantly, this work underscored the idea that autistic individuals might acquire more life skills if given sufficient chances to practice.
Three studies employing item-level analyses attempted to identify individual adaptive behaviors that best distinguished children with autism from children with other developmental conditions (Balboni et al., Reference Balboni, Tasso, Muratori and Cubelli2016; Paul et al., Reference Paul, Miles, Cicchetti, Sparrow, Klin, Volkmar, Coflin and Booker2004; Ventola et al., Reference Ventola, Saulnier, Steinberg, Chawarska and Klin2014). Items related to expressive language, play and leisure, and social skills predicted differences between groups of autistic children and those with non-spectrum developmental conditions. However, there was little consistency in the specific items identified as differing between diagnostic groups. In general, both individuals with autism and those with related developmental conditions show challenges with adaptive behavior and broadly experience many similar challenges in adult life, such as higher unemployment (Lord et al., Reference Lord, McCauley, Pepa, Huerta and Pickles2020; Seltzer et al., Reference Seltzer, Floyd, Song, Greenberg and Hong2011). Perhaps these similarities between diagnostic groups are more meaningful than any differences. This study includes a subset of individuals with non-autism developmental delays, and autism diagnostic status was tested as a covariate in all analyses.
Machine learning approaches to understanding autism
Machine learning (ML) statistical techniques refer to a range of methods that use data to model complex relationships and optimize predictions. ML techniques are flexible, requiring fewer assumptions about data structure than traditional statistical models. This flexibility makes ML techniques suitable for a broad range of research questions and data types (Dwyer et al., Reference Dwyer, Falkai and Koutsouleris2018; Grimmer et al., Reference Grimmer, Roberts and Stewart2021). Such approaches are increasingly popular in studies of autism (see Hyde et al., Reference Hyde, Novack, LaHaye, Parlett-Pelleriti, Anden, Dixon and Linstead2019 for a review). To date, much of this work focuses on screening for autism efficiently, often via medical records or large autism data repositories (Ben-Sasson et al., Reference Ben-Sasson, Guedalia, Ilan, Shaham, Shefer, Cohen, Tamir and Gabis2024; Bone et al., Reference Bone, Bishop, Black, Goodwin, Lord and Narayanan2016; Li et al., Reference Li, Huang, Yang, Shychuk, Shenkman, Bian, Angell and Guo2024). Though improving autism screening is a meaningful pursuit, such investigations are of limited utility to improving the lives of already diagnosed autistic individuals and their families. The current study sought to fill this gap by leveraging supervised ML techniques to identify DLS from childhood predictive of adult success in the Longitudinal Study of Autism (LSA) cohort.
The current study
This study sought to identify specific daily living skills from childhood and adolescence, specifically, ages 5, 9, 14, and 18, predictive of adult outcomes (i.e., employment, residential status, social relationships, and well-being) in autism. Prior work has consistently shown that higher total scores on adaptive behavior measures are associated with increased likelihood of attaining many adult outcomes (Clarke et al., Reference Clarke, McCauley and Lord2021b; Farley et al., Reference Farley, Cottle, Bilder, Viskochil, Coon and McMahon2018; Taylor et al., Reference Taylor, Center and Mailick2014), but few investigations have studied how competency in specific adaptive behaviors at specific points in development may impact later outcomes. Further, existing studies have extensively characterized trajectories of DLS in autism, both in the LSA cohort (see Clarke et al., Reference Clarke, McCauley and Lord2021b, and Bal et al., Reference Bal, Kim, Fok and Lord2019), and other longitudinal samples of autism (e.g., Baghdadli et al., Reference Baghdadli, Rattaz, Michelon, Pernon and Munir2019; Chen et al., Reference Chen, Duku, Szatmari, Salt, Smith, Richard, Zwaigenbaum, Vaillancourt, Zaidman-Zait, Bennett, Elsabbagh, Kerns and Georgiades2024; Smith et al., Reference Smith, Maenner and Seltzer2012). Though this work has been instrumental in improving the understanding of DLS development in autism, it has provided relatively little insight into the predictive utility of individual DLS at distinct developmental periods. Thus, rather than replicate this existing work, we intentionally chose a novel methodological approach that allowed us to examine the age-specific predictive utility of individual DLS. Through supervised ML, this study builds upon existing microanalyses of adaptive behavior by using a more sophisticated statistical approach, avoiding the need for many tests and subsequently increased risk of Type I error.
Thus, the aims of this study were to use DLS item-level data from four time points, ages 5, 9, 14, and 18, to (1) build and test XGBoost supervised classifier machine learning models to predict adult success at approximately age 33 and (2) identify which DLS items were the strongest predictors of adult outcomes at each of the four time points of interest. In line with prior work, it was hypothesized that DLS from childhood would be predictive of adult success. Given limited existing research, there were no a priori hypotheses regarding which DLS items would most strongly predict adult success.
Method
Sample
The current sample is drawn from the LSA cohort. Two-hundred and thirteen children with consecutive referrals under 37 months old at developmental clinics in North Carolina and Chicago were initially enrolled in the LSA cohort; 192 were referred for autism and 21 were referred for non-spectrum developmental delays. Total enrollment reached 253 participants after 40 children of similar characteristics from Michigan joined at age 9 and were subsequently seen at all study waves.
Two-hundred and thirty-two participants from the LSA cohort were included in the current analyses (Table 1). To be included in this study, participants needed to have DLS data from at least one of the four timepoints of interest (i.e., ages 5, 9, 14, and 18). Attrition over the more than 30 years that the LSA cohort (see Table 2) has been followed is comparable to other population-based (Gustavson et al., Reference Gustavson, von Soest, Karevold and Røysamb2012) and autism-specific (Taylor et al., Reference Taylor, Center and Mailick2014) longitudinal samples. Attrition did not differ by diagnosis, gender, or region, but was greater among Black families and families with lower maternal education. Consequently, all analyses included race and maternal education as covariates.
Demographic and behavioral features and adult outcomes by ability level
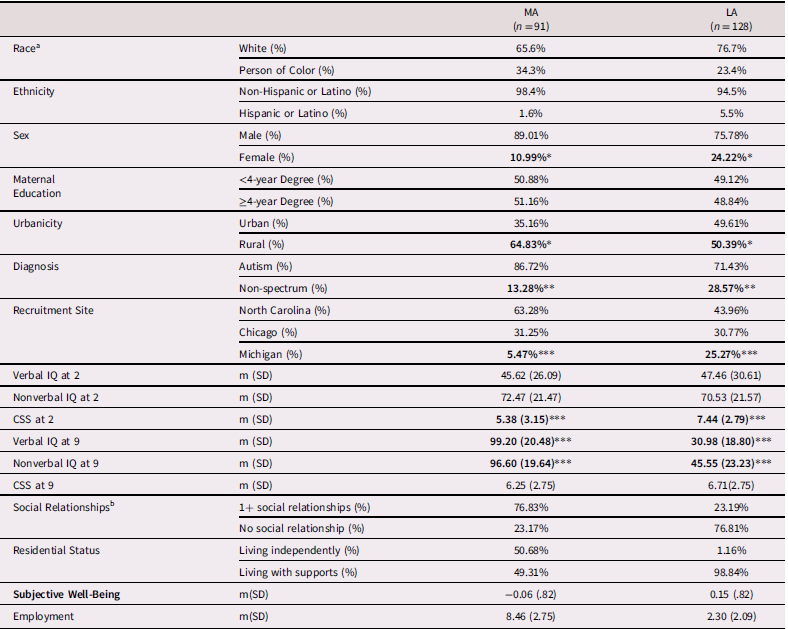
Table 1. Long description
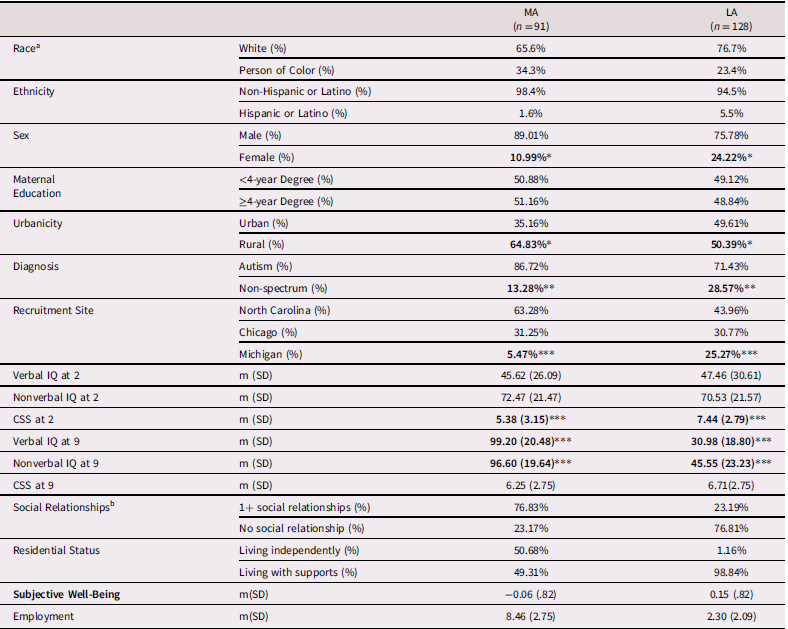
A table comparing demographic and behavioral features and adult outcomes by ability level. The table has 12 rows and 10 columns. Column headers are Race, Ethnicity, Sex, Maternal Education, Urbanicity, Diagnosis, Recruitment Site, Verbal IQ at 2, Nonverbal IQ at 2, CSS at 2, Verbal IQ at 9, Nonverbal IQ at 9, CSS at 9, Social Relationships, Residential Status, Subjective Well-Being, and Employment. Row labels are MA (n = 91) and LA (n = 128). Row 1: Race: White (percent), Person of Color (percent). Row 2: Ethnicity: Non-Hispanic or Latino (percent), Hispanic or Latino (percent). Row 3: Sex: Male (percent), Female (percent). Row 4: Maternal Education: <4-year Degree (percent), ≥4-year Degree (percent). Row 5: Urbanicity: Urban (percent), Rural (percent). Row 6: Diagnosis: Autism (percent), Non-spectrum (percent). Row 7: Recruitment Site: North Carolina (percent), Chicago (percent), Michigan (percent). Row 8: Verbal IQ at 2 m (SD), Nonverbal IQ at 2 m (SD), CSS at 2 m (SD). Row 9: Verbal IQ at 9 m (SD), Nonverbal IQ at 9 m (SD), CSS at 9 m (SD). Row 10: Social Relationships: 1+ social relationships (percent), No social relationship (percent). Row 11: Residential Status: Living independently (percent), Living with supports (percent). Row 12: Subjective Well-Being m (SD), Employment m (SD).
Note. ***p ≤ .001**p ≤ .01 *p ≤ .05.
a The majority (90%) of participants from minority racial/ethnic backgrounds in the current sample were Black or African American. Remaining PoC participants were Asian American or Pacific Islander (4%), American Indian (4%), and Multiracial (2%).
b For MA participants, a social relationship was defined as a mutual peer friendship. For LA participants, a social relationship was defined as a regular social contact who was not an immediate family member or paid staff person.
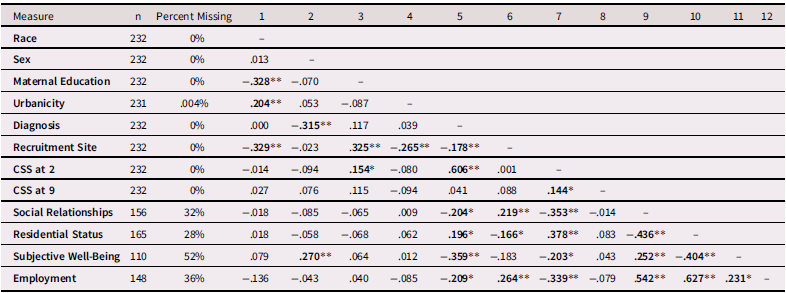
Missingness percentages by and correlations between demographic, phenotypic, and adult outcome measures
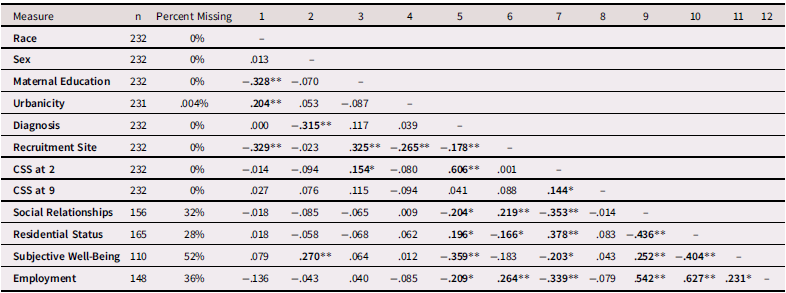
Table 2. Long description
The table presents data on missingness percentages and correlations between different measures for 232 participants. It includes 12 columns labeled with numbers 1 through 12 and rows labeled with different measures such as Race, Sex, Maternal Education, Urbanicity, Diagnosis, Recruitment Site, CSS at 2, CSS at 9, Social Relationships, Residential Status, Subjective Well-Being, and Employment. Each row lists the measure, the number of participants (n), the percent missing, and correlation values across the columns. Notable trends include high correlations in specific measures like Maternal Education, Diagnosis, and Recruitment Site. The table also indicates varying percentages of missing data for different measures, with Social Relationships, Residential Status, Subjective Well-Being, and Employment having significant missing data percentages.
Note. **p ≤ .01 *p≤.05.
Procedure
In-person assessments were completed at ages 5, 9, and 18 during which participants completed an assessment battery including measures of cognitive ability, autism features, and adaptive behavior. Additional data on adaptive behavior was collected via phone interview at age 14. Adult data was collected via mailed survey packets completed by caregivers and participants capable of self-report when participants were approximately age 33. Parents and participants over the age of 18 who were their own legal guardians provided informed consent as required by the applicable institutional review board(s) prior to each visit. All study procedures were approved by the University of North Carolina, Chapel Hill, the University of Chicago, the University of Michigan, Cornell University, and University of California, Los Angeles Institutional Review Boards, as appropriate.
Measures
Daily living skills
The Vineland Adaptive Behavior Scales (VABS; Sparrow et al., Reference Sparrow, Balla and Cicchetti1984, Reference Sparrow, Balla and Cicchetti2005) is a widely-used, clinician-administered, caregiver-report interview, and is considered a gold-standard measure of adaptive functioning in autism and related developmental conditions. The VABS assesses functioning across three domains: Communication, Socialization, and DLS. The present study focused exclusively on the DLS domain. The VABS DLS domain is divided into three subdomains: Personal skills (e.g., items that assess toileting, bathing, and grooming behaviors), Domestic skills (e.g., items that assess cooking, household chores), and Community skills (e.g., items that assess behaviors used in the community, such as obeying traffic signals, using money, ordering in a restaurant).
The VABS was administered to LSA participants at ages 5, 9, 14, and 18. Participants completed the first edition of the VABS (Sparrow et al., Reference Sparrow, Balla and Cicchetti1984) at ages 5 and 9 and the second edition of the VABS (Sparrow et al., Reference Sparrow, Balla and Cicchetti2005) at ages 14 and 18. Because some DLS items differed across editions, analyses were restricted to items that were conceptually equivalent to ensure longitudinal interpretability. The full list of included items and plots of change in average item scores from ages 5-18 can be found in Clarke & Lord, Reference Clarke and Lord2025.
Intelligence quotient (IQ)
The Mullen Scales of Early Learning (Mullen, Reference Mullen1995) were administered at age 2. At age 9, cognitive assessments were chosen from a standard hierarchy including the Weschler Intelligence Scale for Children (WISC; Weschler, Reference Wechsler2003), Differential Abilities Scale (DAS; Elliot, Reference Elliott2007), and Mullen, based on participants’ developmental abilities (Lord et al., Reference Lord, Risi, DiLavore, Shulman, Thurm and Pickles2006). Participants were first administered the test with the greatest difficulty corresponding to their ability level, estimated by past performances, verbal abilities, and adaptive skill levels assessed via parent interviews. If basal or ceiling scores were not achieved, the participant was administered the next more or less difficult measure, as appropriate (see Anderson et al., Reference Anderson, Liang and Lord2014). Ratio IQs were calculated when raw scores fell outside deviation score ranges. Verbal IQ at age 2 was tested as a covariate in age 5 sensitivity analysis models, while Verbal IQ at age 9 was tested as a covariate in age 9, 14, and 18 sensitivity analysis models (also see Covariates, below).
Ability level. Prior analyses of the LSA cohort have distinguished participants who are “more cognitively able,” meaning their verbal IQ ≥ 70, and participants who are “less cognitively able,” (LA) meaning their verbal IQ is <70 (McCauley et al., Reference McCauley, Pickles, Huerta and Lord2020). Of the participants included in the current analyses, 91 are MA, and 128 are LA. For descriptive purposes, sample characteristics are reported by ability level in Table 1.
Autism features
The Autism Diagnostic Observation Schedule (ADOS; Lord et al., Reference Lord, Rutter, DiLavore and Risi1999; Reference Lord, Rutter, DiLavore, Risi, Gotham and Bishop2012) is a semi-structured, clinician-administered observational measure and is widely considered the “gold standard” for autism diagnosis. ADOS calibrated severity scores (CSS) rate an individual’s autism symptoms during the ADOS from 10 (most autism symptoms) to 1 (no evidence of autism). The current analyses used ADOS CSS collected at ages 2 and 9; age 2 ADOS CSS was used in the age 5 models, while age 9 ADOS CSS was used in the age 9, 14, and 18 models. Clinicians made best-estimate diagnoses of autism, other developmental disabilities, or typical development at each in-person visit.
Adult outcomes
Employment. Employment data from demographic forms were coded using the Vocational Index (VDI) developed by Taylor and Seltzer (Reference Taylor and Seltzer2012). Scores on the VDI range from 1-9, with 1 indicating no participation in employment or post-secondary education activities, and 9 indicating participation in post-secondary education or competitive employment for 10 hours/week or more without supports. The VDI also includes scores for individuals in volunteer, sheltered workshop, and supported employment settings, making it an effective measure for understanding vocational outcomes amongst individuals of varying abilities (Taylor & Seltzer, Reference Taylor and Seltzer2012). A modified version of the VDI that includes a score of 10 was used for the current analyses (see Clarke et al., Reference Clarke, Sterrett and Lord2021a). A score of 10 was defined as participation in competitive employment for 20 hours/week or more without supports.
Residential status. Data from demographic forms was collapsed into a binary variable, with 1 indicating the participant currently lived independently (this included living with roommates or romantic partners) and 0 indicating the participant currently lived in the family home or a supported residential setting (e.g., group home, or a facility with designated support staff).
Social relationships. Social relationship information was gathered from demographic forms. Social experiences differ substantially between MA and LA participants in the sample due to marked differences in cognitive and communication abilities. Friendship outcomes were therefore operationalized differently by group. For MA participants, a positive friendship outcome was coded as 1 if the participant reported at least one mutual friendship (0 if not). For LA participants, a positive outcome was coded as 1 if the individual had at least one regular social contact outside of family members and paid caregivers (0 if not).
Subjective well-being. Prior exploratory factor analysis in this sample identified a “happiness factor” separately in both caregiver- and self-report data, consisting of scores from the positive affect scale of the Positive and Negative Affect Scales (PANAS; Watson et al., Reference Watson, Clark and Tellegen1988), the total score from the Scales of Psychological Well-Being (WBQ; Ryff, Reference Ryff1989), and the total score from the Quality of Life Questionnaire (QLQ; Schalock & Keith, Reference Schalock and Keith1993). Scores on all three measures were scaled and averaged to produce a continuous “happiness quotient” composite score (McCauley et al., Reference McCauley, Pickles, Huerta and Lord2020). Composite scores ranged from −1 to 1, with higher scores indicating greater reported happiness levels. Self-report happiness quotient scores were used when available (n = 37). For participants who were unable to provide self-report due to language or cognitive limitations, caregiver-report scores were used (n = 110). Prior work indicates that self- and caregiver-report happiness quotient scores are strongly positively correlated in the LSA cohort (McCauley et al., Reference McCauley, Pickles, Huerta and Lord2020).
Analytic plan
This study aimed to identify individual VABS DLS items from ages 5, 9, 14, and 18 that were associated with the four adult outcomes (employment, residential status, social relationships, and well-being). Separate supervised ML classifier models were fit for each adult outcome at each timepoint using eXtreme gradient boosting (XGBoost).
XGBoost is a high-performing decision-tree-based ensemble method that allows for direct comparison of item-level predictive utility at distinct points in development (Choi et al., Reference Choi, Kim, Kim and Cheon2023; Li et al., Reference Li, Huang, Yang, Shychuk, Shenkman, Bian, Angell and Guo2024; Wang et al., Reference Wang, Wang, Chen, Jin and Che2020). It is robust to noise and correlated predictors, and incorporates built-in regularization, reducing the risk of overfitting in moderate sample sizes. Finally, XGBoost can flexibly capture non-linear and interaction effects that may not be adequately modeled by traditional linear approaches.
Covariates
Verbal IQ was not included in the primary models because the goal of this study was to identify specific DLS associated with adult outcomes, rather than estimate the incremental predictive value of DLS after accounting for cognitive ability. Cognitive ability and adaptive functioning are strongly interrelated but conceptually distinct constructs; thus, controlling for IQ changes the substantive interpretation of the models by identifying which DLS items explain remaining variability after accounting for cognitive ability. To evaluate the robustness of findings, sensitivity analyses were conducted with verbal IQ included as an additional predictor. Results of these models are reported in the Supplement.
Separate models for MA and LA individuals were not explored due to insufficient sample sizes. All other available participant demographic (i.e., race, ethnicity, sex, maternal education, urbanicity, diagnosis, recruitment site) and behavioral characteristics (ADOS CSS at 2, ADOS CSS at 9) were included in XG Boost models.
Data preprocessing
Analyses were conducted separately by developmental timepoint (ages 5, 9, 14, and 18). For each timepoint, individual VABS items and salient demographic and phenotypic features (e.g., race/ethnicity, maternal education, ADOS CSS) served as candidate predictors. Employment and subjective well-being were modeled as continuous outcomes, while residential status and social relationships were modeled as binary outcomes.
Outcome variables not relevant to a given model were excluded during preprocessing to prevent data leakage (Kuhn & Johnson, Reference Kuhn and Johnson2013). All predictors were entered in their original scale without normalization, consistent with tree-based modeling conventions (Chen & Guestrin, Reference Chen and Guestrin2016).
Model performance evaluation
Model performance was evaluated using outcome-appropriate metrics derived from cross-validated out-of-fold predictions. In relatively small samples, partitioning the data into independent training and test sets can reduce statistical power and lead to unstable estimates of model performance, particularly for less frequent outcomes (Varoquax, Reference Varoquaux2018). In contrast, repeated cross-validation allows all observations to contribute to both model training and evaluation while maintaining separation between training and validation folds. It is widely recommended as an alternative to using independent training and test sets for analyses in smaller samples (Kohavi, Reference Kohavi1995).
For binary outcomes, performance metrics included area under the receiving operating curve (ROC AUC), F1 score, sensitivity, specificity, negative predictive value (NPV), positive predictive value (PPV), and accuracy. ROC AUC values of 0.7–0.8 are considered acceptable, 0.8–0.9 excellent, and greater than 0.9 outstanding (Mandrekar, Reference Mandrekar2010). For continuous outcomes, model performance was assessed using RMSE, mean absolute error (MAE), and cross-validated R 2 (Kuhn & Johnson, Reference Kuhn and Johnson2013). R 2 values from 0.01 to 0.19 indicate small effects, values from 0.20 to 0.29 indicate medium effects, and values ≥ 0.30 indicate large effects (Gignac & Szodorai, Reference Gignac and Szodorai2016).
Feature importance was examined only for models demonstrating moderate or better predictive performance (e.g., ROC AUC ≥ 0.70 for binary outcomes; R 2 ≥ 0.02 for continuous outcomes). For these models, feature importance was quantified using XGBoost gain. Feature importance reflects relative model weight rather than effect size or causality.
Missing data
Missing VABS DLS data were addressed via multivariate imputation by chained equations with random forest imputation (m = 5; Buuren & Groothuis-Oudshoorn, Reference van Buuren and Groothuis-Oudshoorn2010). This approach accommodates mixed variable types (e.g., continuous and binary predictors) and performs well in small samples (Baraldi & Enders, Reference Baraldi and Enders2010). Imputation was conducted separately within each of the four timepoint-specific data sets (ages 5, 9, 14, and 18 years) to preserve interpretability and avoid the added complexity of multilevel imputation. As a result, analytic sample sizes vary by timepoint, depending on participant completion of each VABS administration. Specifically, the age 5 models had a sample of n = 123, the age 9 models had a sample of n = 152, the age 14 models had a sample of n = 154, and the age 18 models had a sample of n = 143. Adult outcome variables (employment, social relationships, residential status, and well-being) were not imputed. The percentage of missing data for each adult outcome is presented in Table 2.
Results
Chi-square analyses indicated that, compared to MA participants, LA participants in this sample were significantly more likely to be female (χ 2 (1, 219) = 6.11, p = .013), to be diagnosed with a non-spectrum developmental condition (χ 2 (1, 219) = 7.88, p = .005), and to have been recruited from Michigan (χ 2 (2, 219) = 18.83, p < .001). LA participants were significantly less likely than MA participants to live in rural areas (χ 2 (1, 219) = 4.49, p = .034). Reflecting the definitions of LA and MA detailed above, independent t-tests indicated that LA participants had significantly higher ADOS CSS at age 2 (t(231) = 4.91, p < .001) and significantly lower non-verbal and verbal IQ at age 9 than MA participants (t(217) = 17.06, p < .001 and t (217) = 25.49, p < .001, respectively). Race, ethnicity, maternal education, verbal and non-verbal IQ at age 2, and ADOS CSS at age 9 did not differ by ability level. Prior analyses of the LSA cohort have reported in detail on differences in adult outcomes by ability level (Clarke et al., Reference Clarke and Lord2025; Lord et al., Reference Lord, McCauley, Pepa, Huerta and Pickles2020; McCauley et al., Reference McCauley, Pickles, Huerta and Lord2020). Thus, statistical comparisons were not conducted here, but descriptive information on adult outcomes by ability level is reported in Table 1.
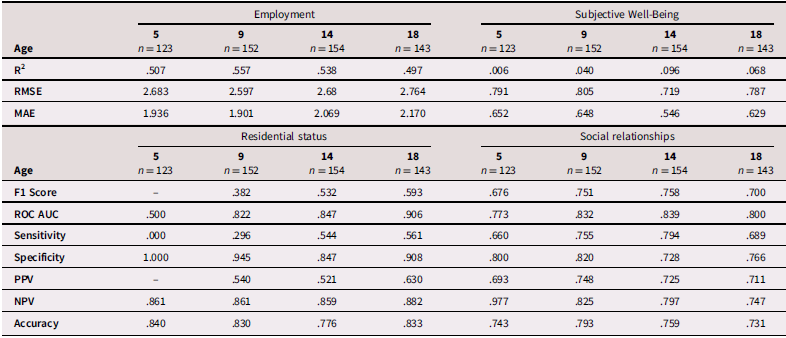
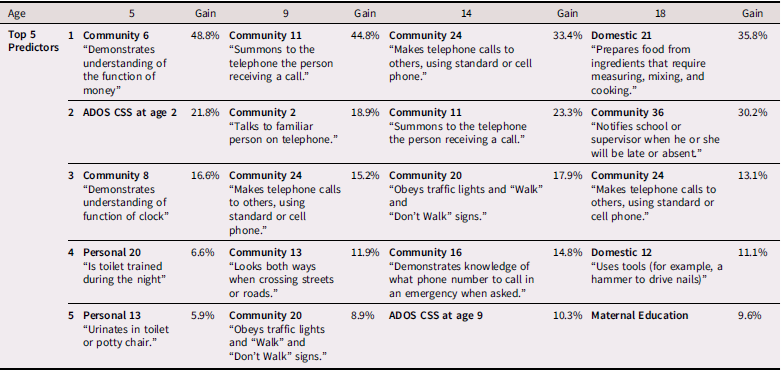
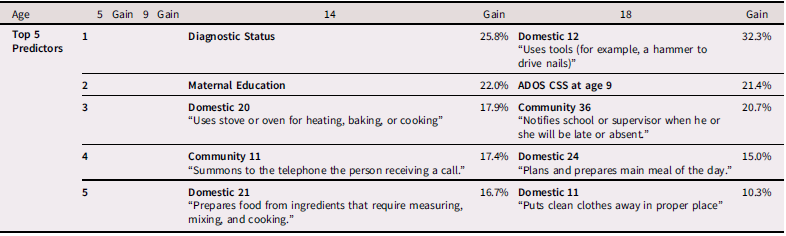
XG Boost model performance metrics are presented in Table 3. The top five predictors and relative gain for employment, residential status, social relationship, and subjective well-being outcomes are presented in Tables 4–7, respectively.
Cross-validated model performance for employment, residential status, social relationships, and subjective well-being outcomes
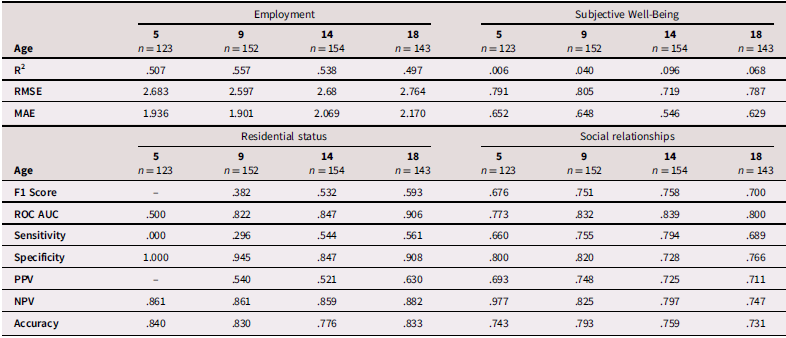
Table 3. Long description
A table comparing model performance metrics for employment, residential status, social relationships, and subjective well-being. The table has 18 columns and 10 rows. Column headers include Age, n, R^2, RMSE, MAE, F1 Score, ROC AUC, Sensitivity, Specificity, PPV, NPV, and Accuracy. Row labels include Age 5, Age 9, Age 14, and Age 18. The table presents values for different age groups and metrics. For example, Row 1: Age 5, n 123, Employment R^2 .507, RMSE 2.683, MAE 1.936, Residential status F1 Score -, ROC AUC .500, Sensitivity .000, Specificity 1.000, PPV -, NPV .861, Accuracy .840.
Note. R 2, RMSE, and MAE are reported for continuous outcomes; classification metrics are reported for binary outcomes.
RMSE, root mean squared error, MSE, mean squared error, ROC AUC, receiver operating characteristic area under the curve; PPV, positive predictive value; NPV, negative predictive value.
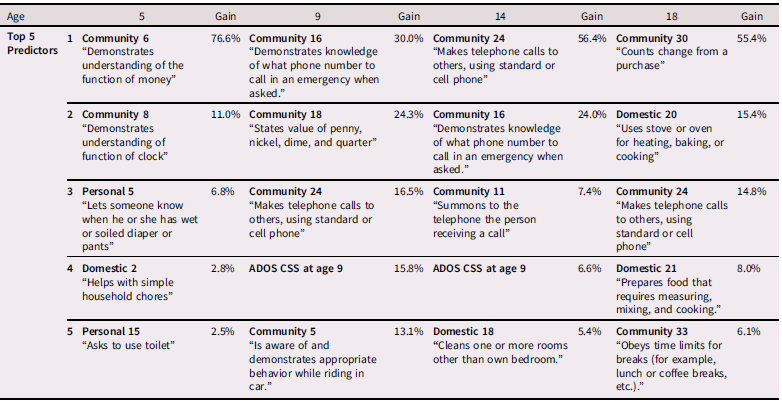
Top five predictors and relative gain for employment outcomes
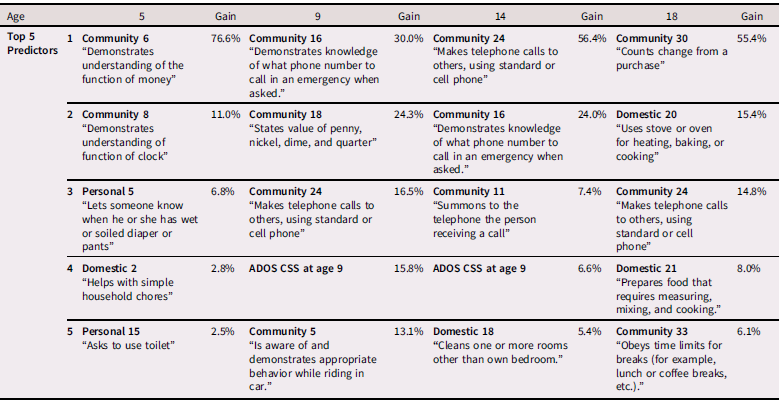
Table 4. Long description
The table presents the top five predictors and their relative gain for different age groups, specifically at ages 5, 9, 14, and 18. It has 5 rows and 6 columns. The columns are labeled Age, Top 5 Predictors, Gain, Gain, and Gain. The rows are labeled with specific predictors and their corresponding gains. For age 5, the top predictors include understanding the function of money, understanding the function of a clock, letting someone know when a diaper or pants is wet or soiled, helping with simple household chores, and asking to use the toilet. For age 9, the top predictors include knowledge of what phone number to call in an emergency, stating the value of coins, making telephone calls, ADOS CSS at age 9, and demonstrating appropriate behavior while riding in a car. For age 14, the top predictors include making telephone calls to others, demonstrating knowledge of emergency phone numbers, summoning the person receiving a call, ADOS CSS at age 9, and cleaning one or more rooms other than their own bedroom. For age 18, the top predictors include making telephone calls to others, using a stove or oven for heating, baking, or cooking, preparing food that requires measuring and cooking, cleaning one or more rooms other than their own bedroom, and obeying time limits for breaks. The table provides a detailed comparison of the relative gains associated with each predictor at different ages.
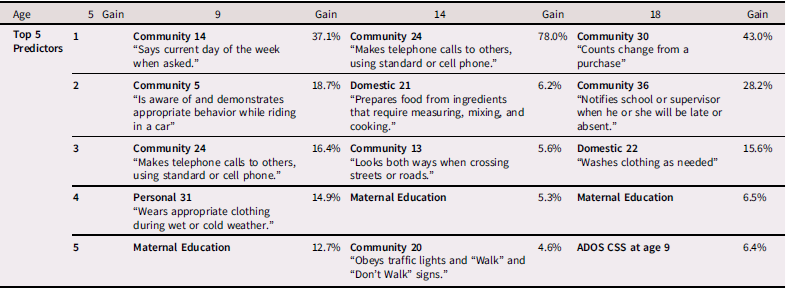
Top five predictors and relative gain for residential status outcomes
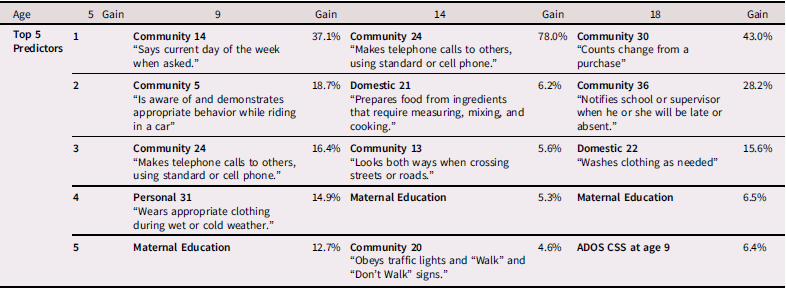
Table 5. Long description
The table compares top five predictors and relative gain for residential status outcomes at ages 5, 9, 14, and 18. It has 5 rows and 6 columns. The columns are labeled Age, Top 5 Predictors, Gain, Gain, and Gain. The rows are labeled with specific ages and corresponding predictors and gains. Row 1: Age 5, Community 14, Says current day of the week when asked, Gain 37.1 percent, Age 14, Community 24, Makes telephone calls to others, using standard or cell phone, Gain 78.0 percent, Age 18, Community 30, Counts change from a purchase, Gain 43.0 percent. Row 2: Age 5, Community 5, Is aware of and demonstrates appropriate behavior while riding in a car, Gain 18.7 percent, Age 9, Domestic 21, Prepares food from ingredients that require measuring, mixing, and cooking, Gain 6.2 percent, Age 18, Community 36, Notifies school or supervisor when he or she will be late or absent, Gain 28.2 percent. Row 3: Age 5, Community 24, Makes telephone calls to others, using standard or cell phone, Gain 16.4 percent, Age 9, Community 13, Looks both ways when crossing streets or roads, Gain 5.6 percent, Age 14, Domestic 22, Washes clothing as needed, Gain 15.6 percent. Row 4: Age 5, Personal 31, Wears appropriate clothing during wet or cold weather, Gain 14.9 percent, Age 9, Maternal Education, Gain 5.3 percent, Age 18, Maternal Education, Gain 6.5 percent. Row 5: Age 5, Maternal Education, Gain 12.7 percent, Age 9, Community 20, Obeys traffic lights and Walk and Don’t Walk signs, Gain 4.6 percent, Age 14, ADOS CSS at age 9, Gain 6.4 percent.
Note. Models without predictors listed performed at chance.
Top five predictors and relative gain for social relationship outcomes
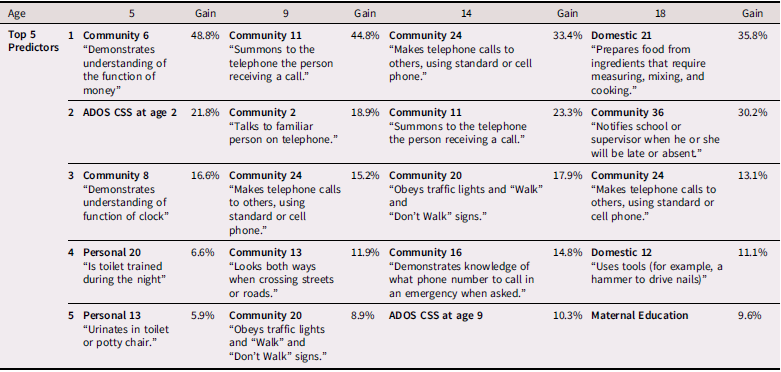
Table 6. Long description
The table has five rows and five columns. The columns are labeled Age, Top 5 Predictors, Gain at Age 5, Gain at Age 9, Gain at Age 14, and Gain at Age 18. The rows list the top five predictors and their relative gains at different ages. Row 1: Age 5, Top 5 Predictors Community 6 Demonstrates understanding of the function of money, Gain 48.8 percent, Age 9, Top 5 Predictors Community 11 Summons to the telephone the person receiving a call, Gain 44.8 percent, Age 14, Top 5 Predictors Community 24 Makes telephone calls to others, using standard or cell phone, Gain 33.4 percent, Age 18, Top 5 Predictors Domestic 21 Prepares food from ingredients that require measuring, mixing, and cooking, Gain 35.8 percent. Row 2: Age 5, Top 5 Predictors ADOS CSS at age 2, Gain 21.8 percent, Age 9, Top 5 Predictors Community 2 Talks to familiar person on telephone, Gain 18.9 percent, Age 14, Top 5 Predictors Community 11 Summons to the telephone the person receiving a call, Gain 23.3 percent, Age 18, Top 5 Predictors Community 36 Notifies school or supervisor when he or she will be late or absent, Gain 30.2 percent. Row 3: Age 5, Top 5 Predictors Community 8 Demonstrates understanding of function of clock, Gain 16.6 percent, Age 9, Top 5 Predictors Community 24 Makes telephone calls to others, using standard or cell phone, Gain 15.2 percent, Age 14, Top 5 Predictors Community 20 Obeys traffic lights and Walk and Dont Walk signs, Gain 17.9 percent, Age 18, Top 5 Predictors Community 24 Makes telephone calls to others, using standard or cell phone, Gain 13.1 percent. Row 4: Age 5, Top 5 Predictors Personal 20 Is toilet trained during the night, Gain 6.6 percent, Age 9, Top 5 Predictors Community 13 Looks both ways when crossing streets or roads, Gain 11.9 percent, Age 14, Top 5 Predictors Community 16 Demonstrates knowledge of what phone number to call in an emergency when asked, Gain 14.8 percent, Age 18, Top 5 Predictors Domestic 12 Uses tools (for example, a hammer to drive nails), Gain 11.1 percent. Row 5: Age 5, Top 5 Predictors Personal 13 Urinates in toilet or potty chair, Gain 5.9 percent, Age 9, Top 5 Predictors Community 20 Obeys traffic lights and Walk and Dont Walk signs, Gain 8.9 percent, Age 14, Top 5 Predictors ADOS CSS at age 9, Gain 10.3 percent, Age 18, Top 5 Predictors Maternal Education, Gain 9.6 percent.
Top five predictors and relative gain for subjective well-being outcomes
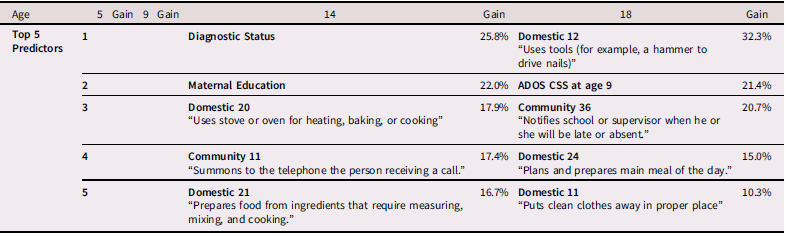
Table 7. Long description
A table comparing top predictors and relative gain for subjective well-being outcomes at ages 5, 9, 14, and 18. The table has 5 rows and 5 columns. Column headers are Age, Top 5 Predictors, Gain, and Gain. Row 1: Age 5, Top 5 Predictors 1, Gain 25.8 percent, Domestic 12 Uses tools (for example, a hammer to drive nails), Gain 32.3 percent. Row 2: Age 5, Top 5 Predictors 2, Gain 22.0 percent, Maternal Education, Gain 21.4 percent, ADOS CSS at age 9. Row 3: Age 5, Top 5 Predictors 3, Gain 17.9 percent, Domestic 20 Uses stove or oven for heating, baking, or cooking, Gain 20.7 percent, Community 36 Notifies school or supervisor when he or she will be late or absent. Row 4: Age 5, Top 5 Predictors 4, Gain 17.4 percent, Community 11 Summons to the telephone the person receiving a call, Gain 15.0 percent, Domestic 24 Plans and prepares main meal of the day. Row 5: Age 5, Top 5 Predictors 5, Gain 16.7 percent, Domestic 21 Prepares food from ingredients that require measuring, mixing, and cooking, Gain 10.3 percent, Domestic 11 Puts clean clothes away in proper place.
Note. Models without predictors listed performed at chance.
Sensitivity analyses including verbal IQ as an additional predictor are reported in the Supplement (Tables S1–S5). The impact of including IQ varied by outcome domain. Model performance improved substantially for residential status and improved modestly for employment. In contrast, inclusion of IQ resulted in minimal changes in predictive performance for the social relationships and subjective well-being models. Although verbal IQ frequently emerged as a top predictor in sensitivity models (Tables S2-S5), several DLS items identified in primary analyses remained among the strongest predictors.
Employment
The age 9 model had the best fit statistics, explaining 56% of the variance in adult employment outcomes, as measured by VDI scores (R 2 = 0.557, RMSE = 2.597, MAE = 1.901). Notably, models for all four timepoints performed well; the age 14 model explained 54% of the variance in adult VDI scores, the age 5 model explained 51%, and the age 18 model explained 50% (Table 3). The top 5 predictors from the age 9 model were item 16 from the community subdomain (“Demonstrates knowledge of what phone number to call in an emergency when asked,”), item 18 from the community subdomain (“States value of penny, nickel, dime and quarter,”), item 24 from the community subdomain (“Makes telephone calls to others, using standard or cell phone.”), ADOS CSS score at age 9, and item 5 from the community subdomain (“Is aware of and demonstrates appropriate behavior while riding in car [for example, keeps seat belt on, refrains from distracting driver, etc.]”; Table 4).
Residential status
Residential status model fit improved with increasing age, with the age 18 model having the best fit statistics (Table 3). The age 5 model performed at chance, indicating DLS from mid-childhood had little predictive utility for adult residential status. The age 18 model had excellent AUC and specificity, but relatively low sensitivity (AUC = 0.906; specificity = 0.908; sensitivity = 0.561; F1 score = 0.593). The top 5 predictors for the age 18 model were item 30 from the community subdomain (“Counts change from a purchase,”) item 36 from the community subdomain (“Notifies school or supervisor when he or she will be late or absent,”), item 22 from the domestic subdomain (“Washes clothing as needed,”) maternal education, and ADOS CSS at age 9;” Table 5).
Social relationships
The age 14 and age 9 models performed similarly, though the age 14 model had slightly better fit statistics, specifically higher sensitivity and overall balance (AUC = 0.839; specificity = 0.728; sensitivity = 0.794; F1 score = .758). These were followed by the age 18 model and finally, the age 5 model (Table 3). The top five predictors from the age 14 model were item 24 from the community subdomain (“Makes telephone calls to others, using standard or cell phone,”), item 11 from the community subdomain (“Summons to the telephone the person receiving a call or indicates that the person is not available,”), item 20 from the community subdomain (“Obeys traffic lights and ‘Walk’ and ‘Don’t Walk’ signs.”), item 16 from the community subdomain (“Demonstrates knowledge of what phone number to call in an emergency when asked.”), and ADOS CSS at age 9 (Table 6). Notably, community items 11, 16, and 24 are all related to telephone usage.
Subjective well-being
The age 14 model had the best fit statistics, although it still explained less than 10% of the variance in adult subjective well-being (R 2 = 0.096, RMSE = 0.719, MAE = 0.546; Table 3). The top 5 predictors from the age 14 model were diagnostic status (i.e., autism v. non-spectrum developmental condition), maternal education, item 20 from the domestic subdomain (“Uses stove or oven for heating, baking, or cooking”), item 11 from the community subdomain (“Summons to the telephone the person receiving a call or indicates that the person is not available,”), and item 21 from the domestic subdomain (“Prepares food from ingredients that require measuring, mixing, and cooking.”). The age 5 and age 9 models performed at chance and slightly better than chance, respectively, indicating DLS from mid and late childhood had little predictive utility for adult subjective well-being.
Discussion
The original impetus for measuring DLS in autism and related conditions was to improve adult outcomes. The earliest DLS assessment, the Vineland Social Maturity Scale, was created to assess the effectiveness of a vocational training program for individuals with intellectual disability (Doll, Reference Doll1953). Although measures of DLS have been repeatedly refined in the decades since, much of the empirical literature that seeks to understand DLS in autism continues to rely on cross-sectional analyses and global summary scores. Such approaches limits insight into item-level and developmental heterogeneity that may predict adult success. As a result, the substantial body of research describing DLS profiles in autism has not yet translated into a fine-grained understanding of how adaptive skill development shapes adult outcomes.
This study used ML techniques to pinpoint specific DLS from mid-childhood through early adulthood that are predictive of positive outcomes for autistic individuals in their early thirties. Item-level analyses of DLS may facilitate the identification of DLS that promote positive developmental cascades amongst autistic individuals. It is notable that each of the four domains of adult life examined here–employment, residential status, social relationships, and subjective well-being – demonstrated distinct patterns in the predictive utility of DLS. This was true both in terms of the individual DLS most associated with each domain of adult life, and the age (5, 9, 14, or 18) at which DLS were most predictive of adult success for each domain. This suggests there is no single daily living skill that is most essential to supporting adult outcomes, nor a single “critical period” in development when acquiring competency in DLS will ensure later success across many aspects of adult life. Rather, sustained opportunities for DLS learning and practice may be more meaningful than the specific types of opportunities and ages at which such opportunities are provided.
Compared to neurotypical peers, autistic individuals may experience greater difficulty generalizing learned skills to novel contexts, a challenge that may be further amplified among those with co-occurring intellectual disability. When foundational DLS (e.g., understanding a hot stove is dangerous) are not acquired early, later instructional efforts (e.g., safely operating an oven) may inadvertently skip intermediate steps, limiting opportunities for successful learning. Over time, this mismatch between instructional demands and underlying skill readiness may result in negative cascades that restrict access to opportunities to learn and apply increasingly complex DLS. From this perspective, opportunities for DLS learning and practice may function as promotive factors, facilitating positive cascades in which early DLS competence fosters greater functional independence and adult success for autistic individuals (Figure 1). Opportunities for improvement (or decline) in life skills do not abruptly stop at a given age. For example, even if an autistic individual does not learn to cross the street independently until age 22, acquiring this skill could still meaningfully enhance their functional independence and, by extension, improve quality of life. This underscores the importance of continuing to provide intervention services to autistic individuals well after their school years, and the need for studies that follow autistic individuals into middle and later adulthood.
In the current study, the employment models provide the clearest illustration of how developmental cascades of DLS may shape adult outcomes in autism. DLS were a strikingly strong predictor of adult employment in this sample; age 5 DLS explained slightly over half of the variance in employment outcomes nearly twenty years later, at age 33. Although predictive performance was higher for the age 9 and 14 models, the strong performance of the age 5 employment model is notable given its temporal distance from adult outcomes. These results suggest that early DLS may serve as an indicator of developmental contexts and competencies associated with later vocational success and highlight childhood as a potentially important period for promoting functional independence. In contrast, the age 5 models for residential status and well-being had very little predictive utility (Tables 3 and 4). DLS may be important for vocational outcomes, but demographic and behavioral features are likely critical to supporting success in other domains of adult functioning.
Predictive utility for the residential status models increased with age and was strongest by age 18. This pattern, at least in part, may be due to the relatively low proportion of participants who were living independently by age 33 (see Table 1). In line with this, the residential status models demonstrated high specificity and strong NPV alongside comparatively low sensitivity and weak PPV (Table 3). Evidence from separate analyses of the LSA cohort (Singer et al., revised & resubmitted) as well as other samples of autistic adults (Anderson et al., Reference Anderson, Liang and Lord2014; Dudley et al., Reference Dudley, Klinger, Meyer, Powell and Klinger2019) suggests that maternal education, socioeconomic status, and related demographic characteristics are strong predictors of adult residential status. In line with this, maternal education emerged as one of the top five predictors in all three residential status models that performed above chance (Table 5). Externalizing behaviors, which were not included in the current analyses, have also been linked to residential status for autistic adults, with higher levels of externalizing symptoms associated with a decreased likelihood of living outside the family home (Woodman et al., Reference Woodman, Mailick and Greenberg2016).
Given the significance of adolescence for social development in the general population, it is perhaps unsurprising that the age 14 social relationships model had the best fit statistics. It is notable that many DLS items assessing phone use emerged as top predictors in the social relationships models (Table 7). These data were collected before the onset of social media. Though age-appropriate norms for adolescent social engagement have shifted in recent years, it seems plausible that participants who were motivated and able to use phones appropriately in childhood and adolescence would be more likely to develop the skills needed to make and sustain social connections in adult life. Alternatively, participants who had better social skills in early life may have been more likely to use the phone than peers who did not (e.g., to call friends, schedule dates, etc.). Lending credence to this second possibility, autism features were also among the top predictors in both the age 5 and the age 14 social relationships models.
Item-level DLS had poor predictive utility for subjective well-being in adulthood. The age 5 and 9 models performed at chance, and the age 14 model, which had the best fit statistics, still explained less than 10% of the variance in adult well-being. Further, the top two predictors in the age 14 model – diagnostic status and maternal education – were not DLS items. These results suggest that childhood functional independence does not guarantee adult well-being, at least not directly. It is possible that childhood DLS are indirectly associated with adult well-being. For example, adult employment or other domains of adult life may mediate the effect of childhood DLS on adult well-being, and cognitive ability might moderate the effect of DLS on adult success. In line with this, prior analyses of the LSA cohort found that engagement in vocational activities were associated with higher scores on the happiness quotient (Clarke et al., Reference Clarke, Sterrett and Lord2021a; McCauley et al., Reference McCauley, Pickles, Huerta and Lord2020). Though not examined in the current study, these possibilities present valuable areas for future inquiry.
In contrast to the other adult outcomes examined here, which can be measured quite concretely (e.g., number of friendships, hours worked per week), well-being is a more difficult construct to quantify. Additionally, only caregiver proxy-report was available to measure well-being in LA participants, given limitations in the ability to self-report. To holistically understand adult outcomes in this population, there is a need for reliable measures of well-being that are valid for use with autistic adults of all abilities, including those that assess the desires of autistic adults with co-occurring ID and/or who are non- or minimally speaking directly, rather than via proxy-report. This absence of inclusive measurement tools highlights the need to better understand how expressed desires for autonomy and independence – identified by speaking autistic adults and by proxy respondents of non-speaking or intellectually disabled autistic adults in prior research (Al Ansari et al., Reference Al Ansari, Edwards and Gibbs2024; Clarke & Lord, Reference Clarke and Lord2024) – relate to the daily living skills and behaviors that enable independence to the highest extent possible for that individual. It remains unclear whether discrepancies between desired autonomy and functional capacity are associated with differences in well-being.
Community skills support adult success
Notably, for all but three of the XG Boost models described here across different ages and aspects of adult success, an item from the community subdomain of DLS emerged as the strongest predictor. The subjective well-being model from age 14 and the subjective well-being and social relationships models from age 18 were the only instances where community items were not the strongest predictors of the adult outcome in question. In 11 of the 16 models, two or more of the top five predictors were community DLS items.
In general, the community skills most predictive of adult outcomes increased in sophistication with increasing age. As one example, community DLS related to money skills emerged repeatedly in the employment models (Table 4). In the age 5 model, the item “Demonstrates understanding of the function of money” was the top predictor, while the top predictor for the age 18 model, “Counts change from a purchase,” conceptually reflects a higher-level accumulation of skills built upon the basic understanding of the function of money. These results give detailed insight into the types of DLS that support adult success for autistic individuals beyond what typical adaptive functioning metrics–like the VABS total or domain-level standard scores–can provide.
Cognitive ability, DLS, & expectation
Sensitivity analyses incorporating verbal IQ provided additional insight into the relationship between cognitive ability, daily living skills, and adult outcomes (Tables S-S5). Notably, because correlated predictors may share importance in tree-based models, reductions in the relative gain of individual DLS items after adding IQ should not be interpreted as evidence that these skills are unrelated to outcomes.
The extent to which model performance improved after the inclusion of IQ varied substantially across outcome domains. Prediction of residential status improved considerably, whereas improvements were more modest for employment and minimal for social relationships and subjective well-being (Supplementary Table S1). These findings suggest that cognitive ability may play a particularly important role in supporting independent living and employment but may have less predictive utility for other important aspects of adult functioning.
At the same time, many of the specific DLS that emerged as important predictors in the primary analyses remained among the strongest predictors in the IQ-adjusted models. This pattern reinforces the view that DLS and cognitive ability are related but distinct constructs. It also underscores the importance of continued efforts to understand how opportunities to learn and practice specific DLS may promote positive adult outcomes for autistic individuals of varying cognitive ability.
Prior research in the LSA cohort demonstrates that with proper support, autistic individuals with co-occurring ID can acquire DLS that exceed what might be predicted from their cognitive abilities alone (Clarke et al., Reference Clarke, Lord and Bal2026). Conversely, it is well-established that average or higher IQ does not guarantee adaptive behavior competency for autistic individuals (Alvares et al., Reference Alvares, Bebbington, Cleary, Evans, Glasson, Maybery, Pillar, Uljarević, Varcin, Wray and Whitehouse2020; Duncan & Bishop, Reference Duncan and Bishop2015). These findings reinforce that cognitive ability and DLS, while related, are not interchangeable constructs.
The predictive utility of certain daily living skills may also reflect differences in expectations and opportunities. Autistic individuals with stronger language abilities or higher measured IQ may be afforded more opportunities to practice community-based skills and may be expected by caregivers, teachers, and peers to demonstrate greater independence. In this sense, the importance of specific skills identified in the present models may not lie solely in the behaviors themselves, but in the opportunities and expectations that accompany them. For example, adolescents who are not permitted to handle money or make small purchases independently are unlikely to develop competency in money management skills, regardless of underlying ability. Many DLS may be attainable across a wide range of cognitive profiles, but only when sufficient opportunities for structured learning and practice are provided.
Limitations
This sample, initially evaluated in the early 1990s and followed longitudinally ever since, comprises a unique and small group of adults with autism. Participants’ families sought help early in childhood during an era in which autism services were much less available than they are today. Thus, this sample meaningfully differs from individuals diagnosed later in development, and from individuals diagnosed at similar ages today. Attrition has reduced the number of African American participants and participants with lower caregiver education in the LSA cohort. Rates of missingness for some adult outcomes were substantial, which may limit the generalizability of the current findings. Additionally, we have relatively few female participants in this sample. The limited number of female participants constrained the ability to test for sex differences in these analyses.
The DLS data presented here were collected from the mid-1990s through the mid-2010s. Measuring daily living skills is inherently a moving target, as cultural and age norms for independence can shift rapidly. As a result, some of the DLS that emerged as top predictors in the XGBoost models, particularly those referencing landline phone usage, are less representative of expectations for daily life now compared to at the time of data collection. This does not render the current findings uninterpretable. Instead, it seems likely that these items capture broader functional competencies that remain relevant despite changing technology and cultural norms. For example, though landline phones are no longer commonplace, knowing how to make a phone call or contact emergency services in a crisis are still important life skills. In other words, the observed associations between childhood DLS and adult milestones may reflect broader patterns of opportunity to learn and practice functional skills, rather than the enduring importance of specific behaviors.
Though prior work indicates that self- and caregiver-report scores on our measure of subjective well-being, the happiness quotient, are strongly positively correlated in the LSA cohort (McCauley et al., Reference McCauley, Pickles, Huerta and Lord2020), it is possible that the caregiver-report happiness quotient scores used for LA participants may be meaningfully different from the self-report scores provided by MA participants. Given that the alternative would have been to exclude LA participants from these analyses, we chose to retain the caregiver-report data. However, our analyses did not account for possible rater differences in happiness quotient scores.
Because analyses were conducted separately at each developmental timepoint, the participants included in each model varied based on assessment completion. Although this approach preserved interpretability and avoided the complexity of multilevel imputation, it limits direct comparison of predictive utility across ages. Differences in subsample composition may partially account for variation in model performance. Accordingly, it is not possible to fully disentangle whether the increasing sophistication of predictive items across development reflects true developmental timing effects or idiosyncratic characteristics of the analytic subsamples.
Overfitting is always a concern when building and interpreting ML models, particularly in small samples. Repeated cross-validation, rather than separate training and test sets, was used to mitigate this risk in the current study. However, given the unique characteristics of the LSA sample and the strong possibility of cohort effects, future work should attempt to replicate the results of the models described here using larger and more diverse samples of autistic individuals. Ideally, such samples would include both children recently identified as autistic and adults who received autism diagnoses later in development.
Conclusion
Distilling an individual’s adaptive functioning into a single number or small set of numbers, though parsimonious, has limited utility if it is difficult to leverage this information towards real-world improvements. This study leveraged a developmental cascades framework to provide important insight into which specific DLS are most predictive of adult success amongst autistic individuals through item-level analyses of longitudinal data from a cohort of autistic individuals first identified in early childhood and carefully followed for three decades. Item-level DLS scores from early childhood through young adulthood were moderate to strong predictors of adult employment and social relationships but were less closely related to residential status and well-being outcomes. Notably, community-related DLS items emerged as the single strongest predictors in the majority of models. Future work should attempt to replicate the findings described here in larger and more recently identified samples of autistic individuals. One goal of the current study is to encourage researchers to consider clinically meaningful applications of ML for this population beyond enhancing screening and diagnostic efforts. Future studies leveraging machine learning approaches to understanding autism should strive to answer other clinically meaningful questions for the many diagnosed autistic individuals who could benefit from more personalized services and supports.
Supplementary material
The supplementary material for this article can be found at https://doi.org/10.1017/S0954579426101874.
Data availability statement
Availability of Data. The data that support the findings of this study are available upon request from qualified researchers in the National Institute of Mental Health Data Archive (NDA) at https://nda.nih.gov/ in accordance with NDA data access procedures. Availability of Code. The analytic code used in the current study is available from the first author upon reasonable request. Availability of Methods/Material. All study methods and analytic procedures are described in sufficient detail within the manuscript to allow replication. No additional materials are required.
Acknowledgments
The authors would like to acknowledge the time participants and families have given to this project and thank them for their efforts.
Funding statement
This study was funded by the National Institute on Aging (R01-AG080599) (PI: CL) and an Autism Science Foundation postdoctoral fellowship (PI: EC)
Competing interests
CL acknowledges the receipt of royalties from the sale of the Autism Diagnostic Observation Schedule (ADOS) and the Autism Diagnostic Interview-Revised (ADI-R). Royalties generated from this study were donated to a not-for-profit agency, Have Dreams. EBC and HS have no potential conflicts to declare.
Pre-registration statement
This study was not preregistered. The analyses reported herein represent secondary analyses of data collected as part of an ongoing longitudinal cohort study and were not associated with an intervention trial or randomized controlled design.
AI statement
AI tools were not used in the research or writing process for this manuscript.



 Open access

