Obstructive sleep apnoea syndrome is defined as a disorder of breathing during sleep characterised by repeated episodes of intermittent partial or complete upper airway obstruction during sleep that results in disruption of normal ventilation and sleep patterns.1 Obstructive sleep apnoea syndrome in the paediatric population is now increasing with an increase in obstructive sleep apnoea syndrome from 0.1% to 13%, but mostly between 1% and 4%.Reference Au and Li2, Reference Lumeng and Chervin3 Accumulating data suggested that obstructive sleep apnoea syndrome is more common among overweight or obese boys with peak ages between 2 and 8 years.Reference Au and Li2 Childhood obstructive sleep apnoea syndrome is associated with multi-organ morbidities, including cardiovascular complications, poor growth, and neurobehavioral problem. Cardiovascular complications may develop in children with obstructive sleep apnoea syndrome and have an immediate significant impact on cardiovascular health during childhood. Moreover, some of the effects on the cardiovascular system may also affect cardiovascular outcomes later during adulthood. The cardiopulmonary complications including cardiac failure, arrhythmia, systemic, and pulmonary hypertension are the most serious complications.Reference Bhattacharjee, Kheirandish-Gozal, Pillar and Gozal4
The QT interval in different leads can vary and the difference between the maximal and minimal QT intervals defined as QT dispersion may reflect inhomogeneity of repolarisation and myocardial electrical instability.Reference Malik and Batchvarov5 Due to the effect of heart rate on ventricular recovery time, the difference between the maximal and minimal corrected QT intervals calculated by Bazett’s formula, corrected QT interval defined as QT interval/square root of RR interval, in order to correct heart rate variability defined as corrected QT dispersion may be more accurate in the reflection of inhomogeneity of repolarisaton.Reference Nakamura, Chin and Hosokawa6 Many studies in adults demonstrated that QT dispersion was significantly higher in obstructive sleep apnoea syndrome patients than in controls.Reference Nakamura, Chin and Hosokawa6–Reference Ozmen, Cebeci and Kardesoglu9 To our knowledge, there has been no study to assess the relationships between childhood obstructive sleep apnoea syndrome and QT dispersion or corrected QT dispersion. Our objective was to evaluate QT dispersion and corrected QT dispersion in children with obstructive sleep apnoea syndrome.
Methods
Between January, 2007 and April, 2008, children aged less than 15 years, who were clinically suspected of obstructive sleep apnoea syndrome along with healthy children without any history or physical examination for suspected obstructive sleep apnoea syndrome who served as controls, were enrolled in this study. The diagnosis of obstructive sleep apnoea syndrome was made by either overnight polysomnography or overnight oximetry. The criterion for diagnosis of obstructive sleep apnoea syndrome by polysomnography was defined as mixed/obstructive apnoea/hypopnoea index greater than or equal to 5 events per hour.1 The diagnosis of obstructive sleep apnoea syndrome by overnight oximetry was defined as a cluster of desaturation, five or more desaturations occurring in a 10- to 30-minute period.Reference Brouillette, Morielli, Leimanis, Waters, Luciano and Ducharme10 We excluded children with conditions or diseases that may interfere with the QT interval including cardiac, pulmonary, renal, hepatic diseases, systemic hypertension, epilepsy, having a history of previous arrhythmia or palpitation, family history of sudden death in a younger age – less than 35 years – taking medications that may prolong the QT interval, and craniofacial malformation or major anomalies. Informed consent was obtained from parents of each patient and the study protocol conforms to the ethics guidelines of the 1975 Declaration of Helsinki with an approval by the Faculty of Medicine Ramathibodi Hospital’s Human Research Committee, Mahidol University, Bangkok, Thailand. All patients and controls had a 12-lead electrocardiography. Each electrocardiography was reviewed by two independent observers (AK and PN) blinded to the clinical information on measuring QT and RR intervals.
Measurement of QT and RR intervals
In a supine position, a 12-lead electrocardiography was recorded at a paper speed of 50 millimetres per second. The QT intervals were manually measured by using a caliper from the onset of the QRS to the end of the T-wave, defined as the return to TP isoelectric baseline, by a tangential method. When the U-wave was present, the QT was measured at the nadir of the curve between the T and U waves, with the aid of a tangent. If there was any lead that the end of T-wave could not be reliably determined or the T-wave was isoelectric or very low amplitude, this lead was not included in the analysis. From these measurements, the maximal and minimal QT intervals were identified. The RR interval from each lead was also measured. The QT dispersion was calculated as the difference between the maximum and minimum QT intervals, and the mean value of three consecutive RR intervals from each lead was averaged to calculate corrected QT interval by Bazett’s formula.
Repeatability of the measurement was tested for inter-observer reliability of QT dispersion, r equal to 0.632, p less than 0.001, and corrected QT dispersion, r equal to 0.472, p less than 0.001. Random electrocardiogram (35%) were obtained for repeatability of the measurements by one observer for intra-observer reliability of QT dispersion, r equal to 0.700, p less than 0.001, and corrected QT dispersion, r equal to 0.578, p less than 0.001.
Statistical analysis
Statistical analyses were done using SPSS 13.0 for Windows software. Data were presented as mean plus or minus standard deviation for continuous variables and as proportions for categorical variables. The independent sample t-test was used to compare numeric variables between groups. Correlations between numeric variables were determined by Pearson correlation analysis. Possible determinants of QT dispersion and corrected QT dispersion were determined by multivariate regression analysis. A p-value less than 0.05 was considered statistically significant.
Results
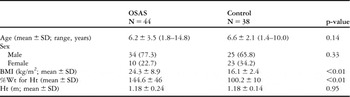
A total of 44 children (34 male) with definite obstructive sleep apnoea syndrome, diagnosed by overnight polysomnography (16 children) and overnight oximetry (28 children), aged 6.2 plus or minus 3.5 years and 38 healthy children (25 male), aged 6.6 plus or minus 2.1 years were included the study. Table 1 demonstrated the demographic data in these two groups. Age and sex were not significantly different in both groups. However, body mass index and ideal weight for height at 50th percentile greater than or equal to 120% were significantly higher in obstructive sleep apnoea syndrome, 24.3 plus or minus 8.9 kilograms per squared metre, 144.6 plus or minus 46%, than in the controls, 16.1 plus or minus 2.4 kilograms per squared metre, 100.2 plus or minus 10%, respectively (p less than 0.01). Obesity was defined as ideal weight for height at 50th percentile greater than or equal to 120%, we found that 27 of 44 children (61.4%) with obstructive sleep apnoea syndrome had obesity while none of the controls were obese.
Age, sex, BMI, percentage of actual Wt to ideal Wt for Ht at 50th percentile (% Wt for Ht), and Ht in children with OSAS and in control

BMI = body mass index; Wt = weight; Ht = height; OSAS = obstructive sleep apnoea syndrome
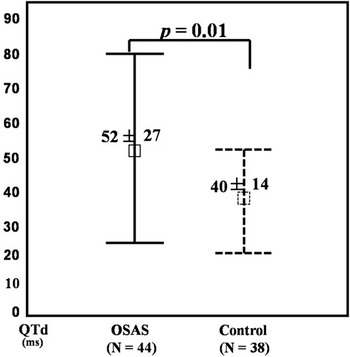
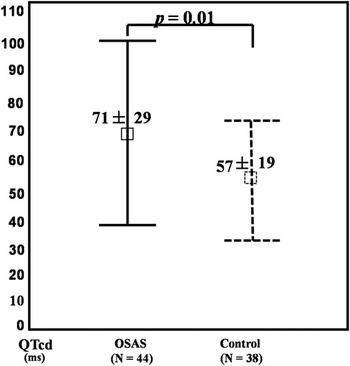
For QT dispersion and corrected QT dispersion, we had two data sets from two independent observers as shown in Table 2. Mean QT dispersion and corrected QT dispersion in these two data sets were almost the same and not significantly different. However, we used the data from observer 1 for further analysis. Overall, mean QT dispersion and corrected QT dispersion were significantly higher in the group with obstructive sleep apnoea syndrome than in controls, 52 plus or minus 27 compared to 40 plus or minus 14 milliseconds, p equal to 0.014 and 71 plus or minus 29 compared to 57 plus or minus 19 milliseconds, p equal to 0.010, respectively (Figs 1 and 2).
Mean ± SD of QTd and QTcd (milliseconds) in children with OSAS and in control from two data sets of two independent observers (O1 and O2)

QTd = QT dispersion; QTcd = corrected QT dispersion; OSAS = obstructive sleep apnoea syndrome
Error bar graphs of QT dispersion (QTd) shown as mean ± SD in obstructive sleep apnoea syndrome (OSAS) and control.

Error bar graphs of corrected QT dispersion (QTcd) shown as mean ± SD in obstructive sleep apnoea syndrome (OSAS) and control.

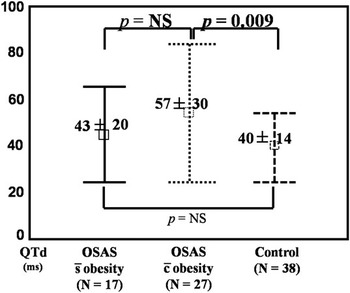
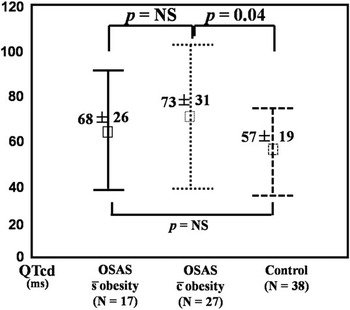
Interestingly, QT dispersion and corrected QT dispersion in obstructive sleep apnoea syndrome with obesity were significantly higher than in the control group, 57 plus or minus 30 compared to 40 plus or minus 14 milliseconds, p equal to 0.009 and 73 plus or minus 31 compared to 57 plus or minus 19 milliseconds, p equal to 0.043, respectively (Figs 3 and 4). However, QT dispersion and corrected QT dispersion in the group with obstructive sleep apnoea syndrome without obesity, 43 plus or minus 20 and 68 plus or minus 26 milliseconds, were not significantly different when compared with the control group. Moreover, there was a fair correlation between QT dispersion and body mass index, r equal to 0.437, p less than 0.001. Multiple regression analysis was performed to evaluate the relationships and found that body mass index was significantly correlated with QT dispersion, p equal to 0.034, r2 equal to 0.22).
Error bar graphs of QT dispersion (QTd) shown as mean ± SD in obstructive sleep apnoea syndrome (OSAS) without obesity, OSAS with obesity, and control.

Error bar graphs of corrected QT dispersion (QTcd) shown as mean ± SD in obstructive sleep apnoea syndrome (OSAS) without obesity, OSAS with obesity, and control.

Discussion
Cardiovascular diseases are the most serious complications of obstructive sleep apnoea syndrome.Reference Lattimore, Celermajer and Wilcox11 These complications include cardiac failure, left/right ventricular dysfunction, acute myocardial infarction, arrhythmias, stroke, systemic hypertension, and pulmonary hypertension.Reference Dursunoglu and Dursunoglu12 All these cardiovascular complications increase the morbidity and mortality of the obstructive sleep apnoea syndrome.
Two studies demonstrated the prevalence of nocturnal arrhythmias in adults with obstructive sleep apnoea syndrome was similar to that observed in healthy adults.Reference Flemons, Remmers and Gillis13, Reference Hoffstein and Mateika14 However, analysis of electrocardiography recordings in 458 adults having sleep studies showed a 58% prevalence of arrhythmias in patients with obstructive sleep apnoea syndrome, compared with 42% in nonapnoeics, most arrhythmias occurring in those with an apnoea--hypopnoea index greater or equal to 40 per hour.13 Both tachyarrhythmias and bradyarrhythmias have been implicated as possible causes of cardiovascular morbidity in adults with obstructive sleep apnoea syndrome. The risk of arrhythmia with obstructive sleep apnoea syndrome appears to be related to the severity of sleep apnoea. In a study of 81 male patients with stable cardiac failure, the incidents of atrial fibrillation and ventricular tachycardia were significantly higher in sleep apnoea patients, apnoea--hypopnoea index greater than or equal to 10 per hour, than in those without apnoea.Reference Javaheri, Parker and Liming15 QT dispersion and corrected QT dispersion have been shown to increase in adults with moderate-to-severe obstructive sleep apnoea syndrome when compared to controls. A significant positive correlation was also found between QT dispersion and severity of obstructive sleep apnoea syndrome.Reference Dursunoglu, Dursunoglu and Evrengul8 QT dispersion has been shown to be a useful non-invasive method for the detection of ventricular repolarisation inhomogeneity, a precursor of life-threatening arrhythmias and a predictor of cardiovascular mortality.Reference Malik and Batchvarov5, Reference Zabel, Klingenheben, Franz and Hohnloser16 In experimental studies, it demonstrated an association of the dispersion of myocardial recovery times and the occurrence of ventricular arrhythmias.Reference Merx, Yoon and Han17 Increased QT dispersion may favour a propensity towards ventricular tachyarrhythmias. Corrected QT dispersion is preferable to QT dispersion when simultaneous 12-lead electrocardiography is not available. To our knowledge, our study was the first study to demonstrate that both QT dispersion and corrected QT dispersion in childhood obstructive sleep apnoea syndrome with obesity were significantly increased when compared to controls. These findings were in the same direction as in adult populations. From our study, it might state a cut-off value of QT dispersion greater than 55 milliseconds and corrected QT dispersion greater than 75 milliseconds to separate the controls from the subjects. Although arrhythmogenic risks were not directly assessed in our children with obstructive sleep apnoea syndrome, increased QT dispersion and corrected QT dispersion may predispose to life-threatening arrhythmias in the future. The reasons to explain the increased QT dispersion and corrected QT dispersion in some children with obstructive sleep apnoea syndrome were not clarified. However, obesity may be the factor explaining these findings, since only QT dispersion and corrected QT dispersion in childhood obstructive sleep apnoea syndrome with obesity were significantly higher when compared to controls while QT dispersion and corrected QT dispersion in childhood obstructive sleep apnoea syndrome without obesity were not significantly different. We concluded from our study that non-obese children with obstructive sleep apnoea syndrome did not have significantly increased QT dispersion. Obesity, itself, may cause the increased QT dispersion and corrected QT dispersionReference Seyfeli, Duru, Kuvandik, Kaya and Yalcin18, Reference Seyfeli, Duru, Kuvandik, Kaya and Yalcin19 and childhood obstructive sleep apnoea syndrome may not be related to the increased QT dispersion and corrected QT dispersion. QT dispersion in non-apnoeic simple snoring adult patients was significantly increased.Reference Ozmen, Cebeci and Kardesoglu9 However, the patients in that study had mean body mass index equal to 28.1 plus or minus 1.2 kilogram per squared metre indicated that they were overweight. Cardiovascular morbidity in childhood obstructive sleep apnoea syndrome including autonomic dysfunction leading to heart rate variability and tachycardia, ventricular remodelling, system hypertension, pulmonary hypertension, endothelial dysfunction, and atherogenesis were described.Reference Bhattacharjee, Kheirandish-Gozal, Pillar and Gozal4 These deleterious cardiovascular effects of obstructive sleep apnoea syndrome may be reversible with early treatment. QT dispersion and corrected QT dispersion could be used not so much as a predictor of any arrhythmogenic risk in childhood obstructive sleep apnoea syndrome with obesity since that risk was not shown in our study. These dispersions may be useful as an adjunctive assessment in longitudinal management of these patients. Perhaps, these dispersions may be normalization after the treatments of obstructive sleep apnoea and/or obesity in these patients. With the increasing prevalence of childhood obesity, it is likely that the prevalence of childhood obstructive sleep apnoea syndrome with obesity may resemble more closely the prevalence seen in adult populations.Reference Capdevila, Kheirandish-Gozal, Dayyat and Gozal20
Conclusions
QT dispersion and corrected QT dispersion were significantly increased in childhood obstructive sleep apnoea syndrome with obesity when compared to age- and sex-matched controls. Obesity along with obstructive sleep apnoea syndrome in children may be the factor affecting the increased QT dispersion and corrected QT dispersion. Obstructive sleep apnoea syndrome by itself did not increase QT dispersion and corrected QT dispersion. Not only the treatment of obstructive sleep apnoea syndrome, but also weight reduction and control should be recommended in childhood obstructive sleep apnoea syndrome to prevent future cardiovascular complications.
Limitations of the study
There were some limitations of this study. First, QT dispersion and corrected QT dispersion might change during episodes of apnoea, but in this study, 12-lead electrocardiography was performed during daytime when the patients were awake. Second, only 36% of the patients were diagnosed as having obstructive sleep apnoea syndrome by polysomnography (gold standard), whereas 64% were diagnosed by overnight pulse oximetry. However, a positive overnight pulse oximetry in a child suspected of having obstructive sleep apnoea syndrome has at least a 97% positive predictive value. Therefore, it could be the definitive diagnostic test for straightforward obstructive sleep apnoea syndrome.Reference Brouillette, Morielli, Leimanis, Waters, Luciano and Ducharme10 Third, in our study the severity of obstructive sleep apnoea syndrome was not established, since some children were diagnosed by overnight pulse oximetry; therefore, we could not correlate the increased QT dispersion or corrected QT dispersion with the severity of obstructive sleep apnoea syndrome.
Acknowledgements
This study was financially supported by Ramathibodi Research Grant, Faculty of Medicine, Ramathibodi Hospital, Mahidol University. We thank all patients and their parents for their participation in this study, Chedsadporn Thanawutiworn and Sunun Sinsawat for performing 12-lead electrocardiography and also thank Porntip Chatchaipun (MSc) in helping with statistical analysis.