In 2015, an article published in the European Association of Cardiovascular Imaging provided recommendations using multi-modality imaging of the heart as it applies to athlete’s heart. The authors defined athlete’s heart as “a clinical picture characterized by two distinct and specific cardiac effects induced by a sustained and regular physical training programme, namely, slow heart rate and enlargement of the heart”.Reference Galderisi, Cardim and D’Andrea 1 In distinction, the diagnosis of hypertrophic cardiomyopathy is generally based on imaging that shows a thickened portion of the left ventricle, usually but not always the interventricular septum, above established upper limits in adults or 2–3 z scores above normal in children.Reference Maron, Casey, Poliac, Gohman, Almquist and Aeppli 2 – Reference Wasfy and Weiner 6 Usually, the diagnosis is reasonably straightforward, but there are also patients in whom the maximum left ventricular wall thickness is borderline. In such cases, it is difficult to know whether the patient has true hypertrophic cardiomyopathy or changes secondary to athletic re-modelling. Descriptions of changes in cardiac structure in persons engaged in regular athletic participation have been published multiple times and defined as athlete’s heart.Reference Sharma, Maron, Whyte, Firoozi, Elliott and McKenna 3 , Reference Pelliccia, Maron, Spataro, Proschan and Spirito 7 – Reference Lauschke and Maisch 10 The distinction between athlete’s heart and cardiomyopathies has major ramifications – for example, the diagnosis of hypertrophic cardiomyopathy will not only impact the patient’s athletic participation but usually indicates the need for further medical testing and therapeutic interventions. This report reviews physiological changes in the athlete’s heart using echocardiography and electrocardiography, discusses discrimination of the athlete’s heart from other cardiomyopathies, and emphasises those discriminatory features in patients with hypertrophic cardiomyopathy.
Physiological changes with athletic training
Fundamental to any discussion of the “athlete’s heart” is the definition of an athlete. The discrimination of individuals who engage in competitive sport versus leisure sport and of exercise training versus physical activity is often arbitrary. In general, the pressure to perform by teammates, coaches, and spectators is usually cited as the best metric to differentiate these terms, and their definitions are well-stated in an article by Takken et al11 on participation recommendations in children having CHD. Considerations of whether an individual may engage in leisure versus competitive sport are based upon which sport, which condition, and, often, upon the individual athlete’s severity/nuanced risk stratification within a given condition – for example, a teenage boy with long QT syndrome type 1, treated with a β-blocking agent, and having a QTc interval of 480 ms would likely be permitted to participate in competitive tennis; however, the same patient who has suffered resuscitated cardiac arrest previously would be restricted from competitive swimming. Even with all this information, recommendations for a given athlete are often not well defined, and published guidelines usually gravitate to very conservative standards.
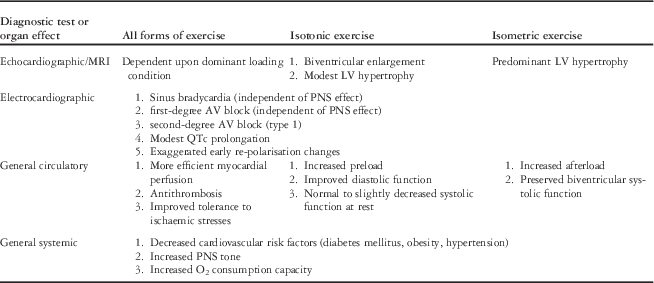
In order to understand abnormal cardiac findings, it is helpful to understand the normal changes that can occur with athletic training.Reference Pelliccia, Maron, Spataro, Proschan and Spirito 7 , Reference Pelliccia, Culasso, DiPaolo and Maron 9 , Reference Stein, Medeiros, Rosito, Zimerman and Ribeiro 12 – Reference Kovacs and Baggish 16 Table 1 summarises changes typically seen in the heart with chronic athletic training. There are subtle but definite differences in the heart exposed to chronic isotonic versus isometric exercise. Most notably, isotonic conditioning results in dilation of the left ventricle with mild wall thickening, whereas isometric exercise promotes left ventricular thickening without chamber dilation.
Circulatory effects of chronic exercise.

AV=atrioventricular; LV=left ventricle; PNS=parasympathetic nervous system
There are limits to the degree of hypertrophy and dilation, however. These limits are helpful when deciding whether a patient has myocardial disease. Pelliccia et alReference Pelliccia, Maron, Spataro, Proschan and Spirito 7 examined 947 Italian Olympic-level athletes, of whom 310 were Olympians representing a wide variety of sports including weight lifting, swimming, soccer, and track. Their ages ranged from 13–49 years (mean 22 years), and men comprised 78% of the athletes. All of them had echocardiograms. They used an arbitrary left ventricular end-diastolic wall thickness cut-off value of 13 mm as the upper limit of normal, as 13 mm represented the 95 percentile for the normal non-athlete population. Of the female athletes, all had left ventricular wall thicknesses of ⩽11 mm. Among males, only 16 (1.7%) had left ventricular wall thickness >13 mm. Of those 16, 15 were rowers or canoeists with the remaining male athlete being a cyclist. Hypertrophy was concentric. Also noteworthy was that the left ventricular end-diastolic dimension in all 16 was >54 mm. None of them was considered to have hypertrophic cardiomyopathy due to lack of symptoms and family history.
In 2002, Sharma et al evaluated 720 elite adolescent athletes from British national leagues who were aged between 14 and 18 years and participated in a wide variety of sports including boxing, cycling, triathlon, karate, rowing, soccer, rugby, swimming, and field hockey.Reference Sharma, Maron, Whyte, Firoozi, Elliott and McKenna 3 They had been competing at the regional level for 4.3+1.5 years. They all had undergone echocardiography during their competitive season. No control patient had a left ventricular wall thickness >11 mm, irrespective of sex. There were 38 patients (5%) whose left ventricular end-diastolic wall thicknesses exceeded the predicted upper limits of normal; all had enlarged left ventricular end-diastolic cavity dimensions with a mean of 54.4+2.1 mm, up to a maximum of 60 mm. No female athlete had left ventricular wall thickness >11 mm. Only three male athletes had a left ventricular wall thickness >12 mm with a maximum of 14 mm.
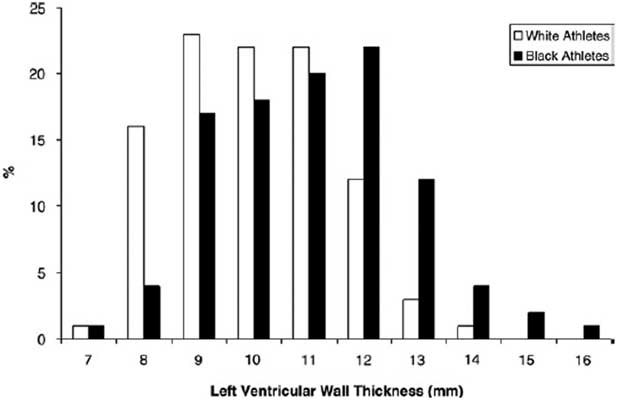
Not only are there differences in left ventricular wall thickness between males and females, but there are differences based on ethnicity. Basavarajaiah et alReference Basavarajaiah, Boraita and Whyte 17 demonstrated that black athletes had a greater left ventricular end-diastolic wall thickness compared with white athletes. They reviewed 300 elite black athletes and 300 white athletes. Among black athletes, 54 (18%) had a left ventricular wall thickness >12 mm, whereas only 12 (4%) white athletes had thicknesses >12 mm. In addition, 3% of black athletes had a left ventricular end-diastolic wall thickness of at least 15 mm (Fig 1), compared with none among white athletes.
Distribution of left ventricular wall thickness among black and white athletes. Note that black athletes can have a left ventricular thickness up to 16 mm compared with the maximum in white athletes of 14 mm; obtained with permission from Basavarajaiah et alReference Basavarajaiah, Boraita and Whyte 17 .

Left ventricular systolic function is usually normal in the athlete’s heart, but mild reduction in ejection fraction is occasionally observed at rest. This is thought to be related to the preload dependence of a chamber accustomed to increased loading conditions. When at rest, the chamber dimension is simply on a lower point on its Starling curve. In any case, measures of diastolic function, including mitral flow patterns and tissue Doppler velocities, should be normal.
In summary, athlete’s heart can be diagnosed in female adolescents and young adults whose left ventricular wall thickness is 11 mm or less, left ventricular end-diastolic dimension is normal or mildly dilated, and left ventricular ejection fraction is preserved or slightly depressed. In males, athlete’s heart should be considered in those with a left ventricular wall thickness of 13 mm or less, with left ventricular end-diastolic dimension of at least 54 mm, and preserved left ventricular function. A wall thickness of 13 to 16 mm may be considered a physiological adaptation in only exceptional circumstances, such as African ancestry or participation in a rowing sport.
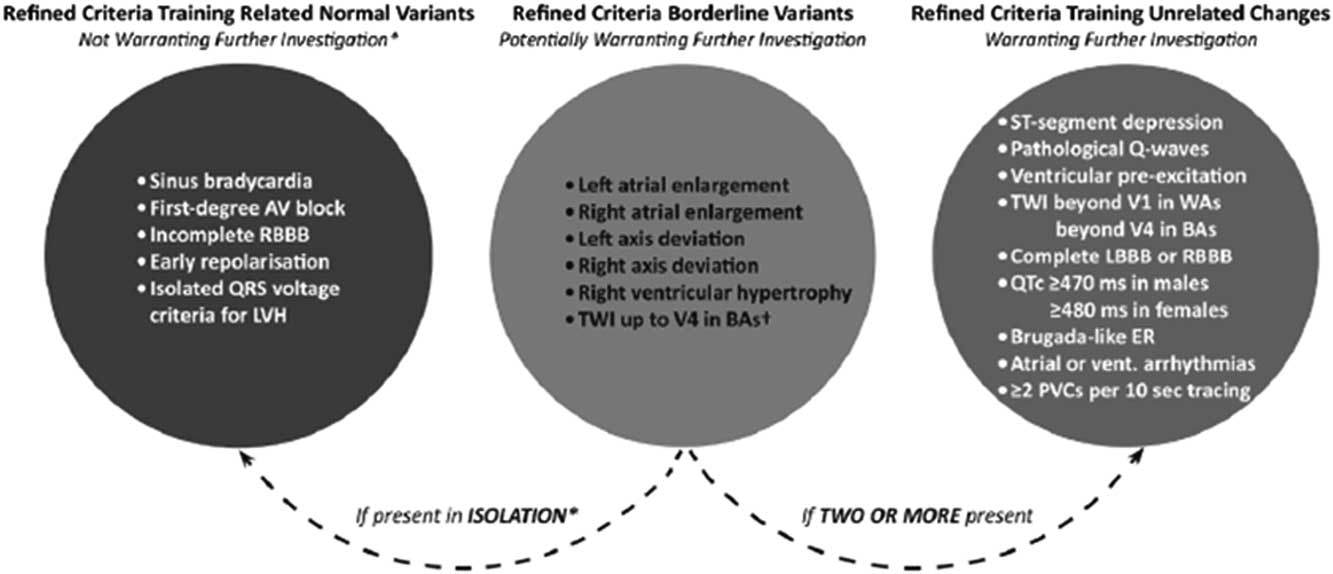
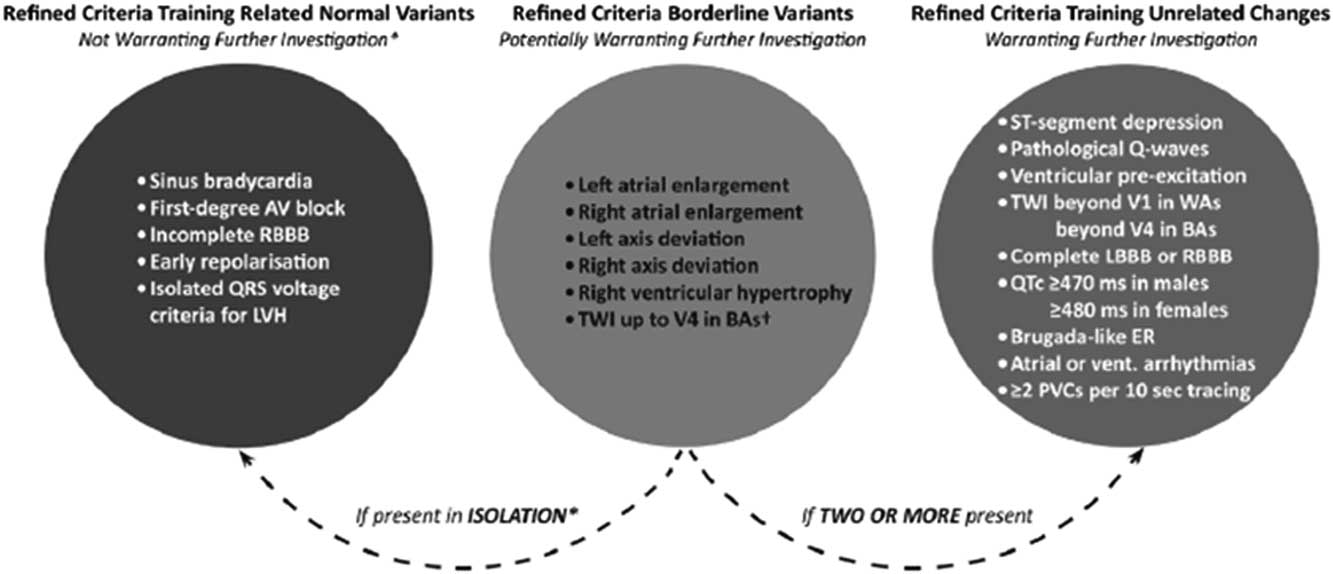
There are numerous electrocardiographic changes attributed to athletic conditioning, which have notoriously resulted in false-positive rates exceeding 20%, based on traditional electrocardiogram interpretation metrics. These include sinus bradycardia, first-degree atrioventricular block, occasional second-degree atrioventricular block (Wenckebach), ventricular premature beats including ventricular couplets, increased QRS voltage, deep and narrow Q waves, inverted T waves, mild QT prolongation, and exaggerated early re-polarisation changes.Reference Maron 18 In 2010, Corrado et al19, representing the European Society of Cardiology, and in 2013, Drezner et alReference Drezner, Ackerman and Anderson 13 , representing Seattle criteria, addressed the high false-positive rates of electrocardiogram interpretation in athletes, concluding that several of these features should not be considered abnormal. In particular, sinus bradycardia, first-degree atrioventricular block, exaggerated early re-polarisation changes, left ventricular hypertrophy (voltage criteria), and an RSR’ pattern in V1 were considered normal physiological adaptations. Most recently, in 2014, Sheikh et alReference Sheikh, Papadakis and Ghani 20 compared the European Society criteria and the Seattle criteria and developed the “Refined” criteria. This schema considered normal variants, not meriting further investigation (see above), borderline variants, and abnormal variants, always requiring further investigation. They determined that any single borderline variant in isolation would be considered a normal variant; however, two or more borderline variants would be considered abnormal and warrant further investigation (Fig 2). When applied to black and white athletes, the sensitivity for major cardiac abnormalities was 100% with specificity values of 84.2 and 93.9%, respectively.
Diagram of the refined electrocardiogram interpretation guidelines; obtained with permission from Sheikh et alReference Sheikh, Papadakis and Ghani 20 . AV=atrioventricular; LV=left ventricle.
Diagnosing hypertrophic cardiomyopathy – echocardiography
As hypertrophic cardiomyopathy has been the most common cardiac condition in many international series of sudden death in athletes, this disease requires additional comment. The gold standard for diagnosing hypertrophic cardiomyopathy for years has been echocardiography. The development of M mode and two-dimensional echocardiography has facilitated the establishment of normal standards of cardiac dimensions. Echocardiography could then be used to diagnose hypertrophic cardiomyopathy as well as other cardiomyopathies. In 2011, Gersh et al published guidelines for the diagnosis and treatment of hypertrophic cardiomyopathy. The diagnosis can be made in adult patients with a left ventricular end-diastolic wall thickness of at least 15 mm, and in a child with an equivalent thickness relative to body surface area in the absence of another cardiac or systemic disease, such as hypertension.Reference Gersh, Maron and Bonow 5 Maron et alReference Maron, Casey, Poliac, Gohman, Almquist and Aeppli 2 confirmed the 15-mm cut-off in adults. Sharma et alReference Sharma, Maron, Whyte, Firoozi, Elliott and McKenna 3 compared the athlete’s heart with those of patients having hypertrophic cardiomyopathy. They determined that hypertrophic cardiomyopathy should be considered in any male or female – athlete or not – with a left ventricular wall thickness of at least 12 mm, recognising that there were a small number of male athletes whose wall thicknesses exceeded 12 mm.
Other echocardiographic features can add evidence to either support or refute a diagnosis of hypertrophic cardiomyopathy. A key feature is the left ventricular end-diastolic dimension. Hypertrophic cardiomyopathy, except towards end stage, will have a normal or reduced left ventricular end-diastolic dimension. Caselli et alReference Caselli, Maron, Urbano-Moral, Pandian, Maron and Pelliccia 21 reviewed 28 adult-sized athletes with left ventricular wall thicknesses of 13–15 mm – those that fell into the “grey zone” of overlap dimensions between normal and hypertrophy – and compared them with 25 athletes with hypertrophic cardiomyopathy. There was a substantial difference in left ventricular end-diastolic dimension with athletes having a mean dimension of 60+3 mm compared with hypertrophic cardiomyopathy patients with a dimension of 45+4 mm. Compared with other findings, the left ventricular cavity size was the most reliable differentiating factor with high sensitivity and specificity at a dimension of at least 55 mm. Additional important differences detected by echocardiography in this study included left atrial diameter (larger in athletes), aortic root (larger in athletes), and transmitral E/A ratios (1.9+0.5 in athletes and 1.6+0.6 in hypertrophic cardiomyopathy).
Left ventricular tissue velocities may be abnormal in this disease. Using speckle tracking, Okada et alReference Okada, Yamada and Iwano 22 studied 41 hypertrophic cardiomyopathy patients and compared them with 27 control patients. The main finding was that longitudinal and circumferential strain was reduced in hypertrophic cardiomyopathy patients compared with controls.
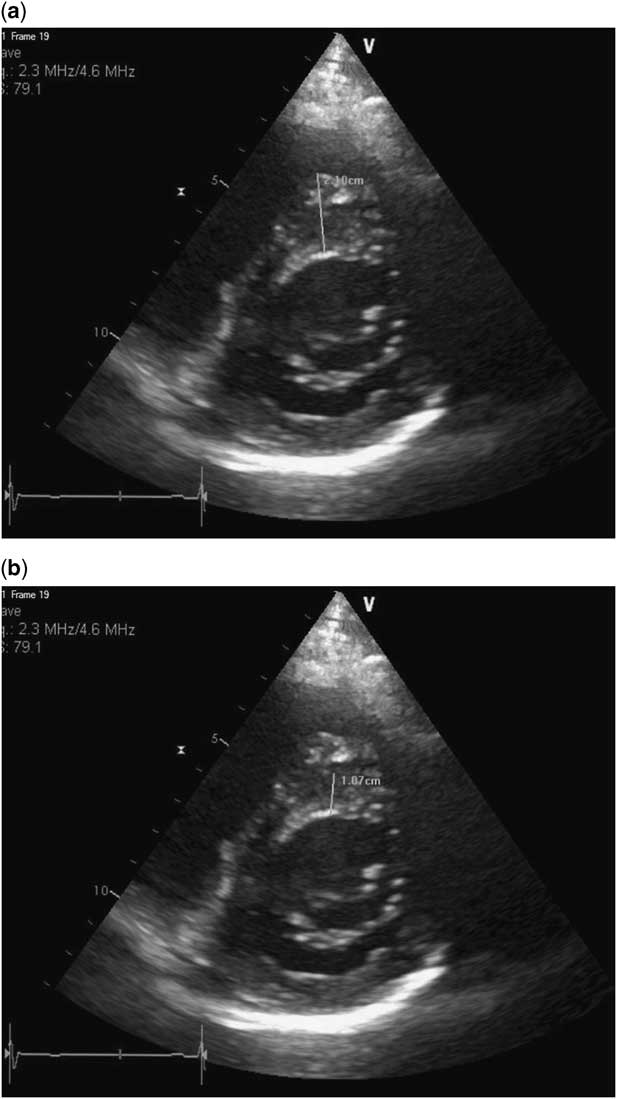
Accuracy in measuring the left ventricular walls is important; errors can be made that will falsely overestimate or underestimate wall thickness. Figure 3a shows a short-axis view that demonstrates the potential of both overestimation and underestimation. The septal measurement errantly includes a right ventricular muscle bundle that is very close to the septum. On closer examination, there is a very small separation between the septum and the right ventricular muscle bundle. The correct measurement can be observed in Figure 3b.
Short-axis echocardiographic images showing measurement of the interventricular septum. In ( a ), the septal thickness is measured at 21 mm. On closer inspection, there is a right ventricular muscle bundle that was included in the measurement. In ( b ), the correct measurement is demonstrated to be 10.7 mm. Also note that the lateral wall is not completely seen. It is possible that the left ventricular wall is much thicker than indicated by echocardiogram.

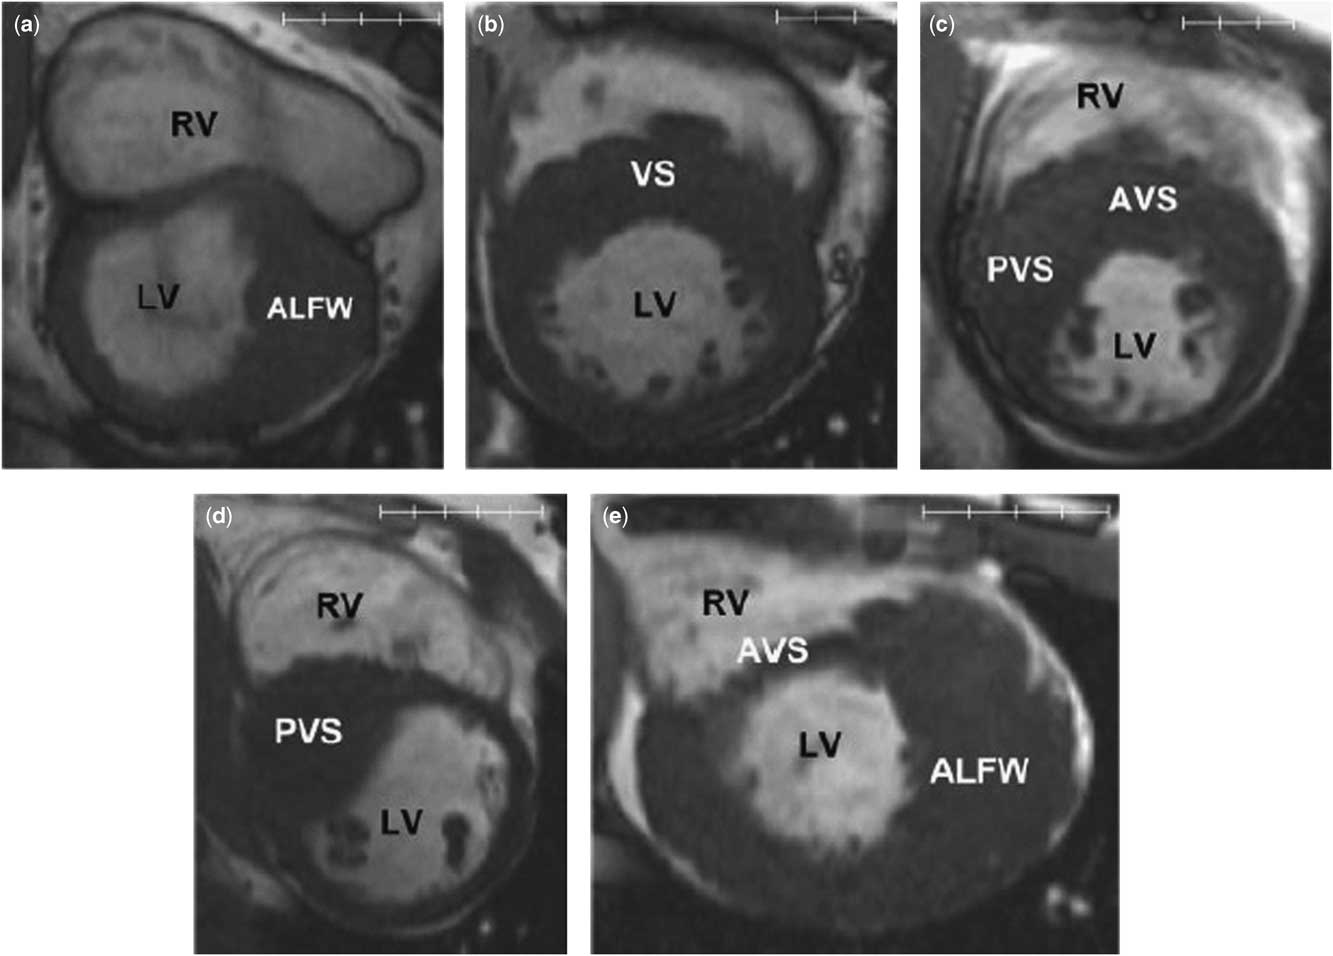
It is also an incorrect assumption that hypertrophy in hypertrophic cardiomyopathy only occurs in the septum. Atypical forms can demonstrate hypertrophy solely in the apex or lateral free wall of the left ventricle. In Figure 3a, the lateral wall cannot be seen because of air artefact. Some hypertrophic cardiomyopathy patients can have thickening of the lateral wall alone with a relatively normal septal thickness. In this figure, lateral hypertrophy would be missed. The addition of cardiac MRI can overcome this artefact and allow complete visualisation of the left ventricle (Fig 4).Reference Rickers, Wilke and Jerosch-Herold 23 This modality should be considered when the electrocardiogram, family history, or personal history are concerning, but the echocardiogram is inconclusive.
MRI of the left ventricle in the short-axis view from patients with hypertrophic cardiomyopathy. This demonstrates the different morphologies that can be present. Also note the abnormal papillary muscle morphologies in hypertrophic cardiomyopathy patients. None of these findings are expected in athlete’s heart. ALFW=anterolateral free wall; AVS=anterior ventricular septum; LV=left ventricle; PVS=posterior ventricular septum; RV=right ventricle; VS=ventricular septum. Obtained with permission from Rickers et alReference Rickers, Wilke and Jerosch-Herold 23 .

Echocardiography and/or MRI should also be used to view the mitral valve and papillary muscle structures, as they are often abnormal in the sarcomeric forms of hypertrophic cardiomyopathy.Reference Maron 24 The mitral valve leaflets are often elongated, and the suspensory apparatus may be abnormal, including single papillary muscle, several accessory papillary muscles, and abnormal chordal attachments to the mitral valve leaflets.
Stress echocardiography, usually using an upright bicycle, is an emerging tool in risk assessing persons known to have hypertrophic cardiomyopathy. Indices of ischaemia, provokable outflow tract gradients, and tissue Doppler measures of diastolic dysfunction appear to correlate with outcomes;Reference Chun and Woo 25 however, this modality may not be as useful to flush out latent disease, because provokable left ventricular outflow tract gradients higher than 35 mmHg may be seen in up to one-third of completely normal young athletes.Reference Wittlieb-Weber, Cohen and McBride 26
Diagnosing hypertrophic cardiomyopathy – electrocardiography
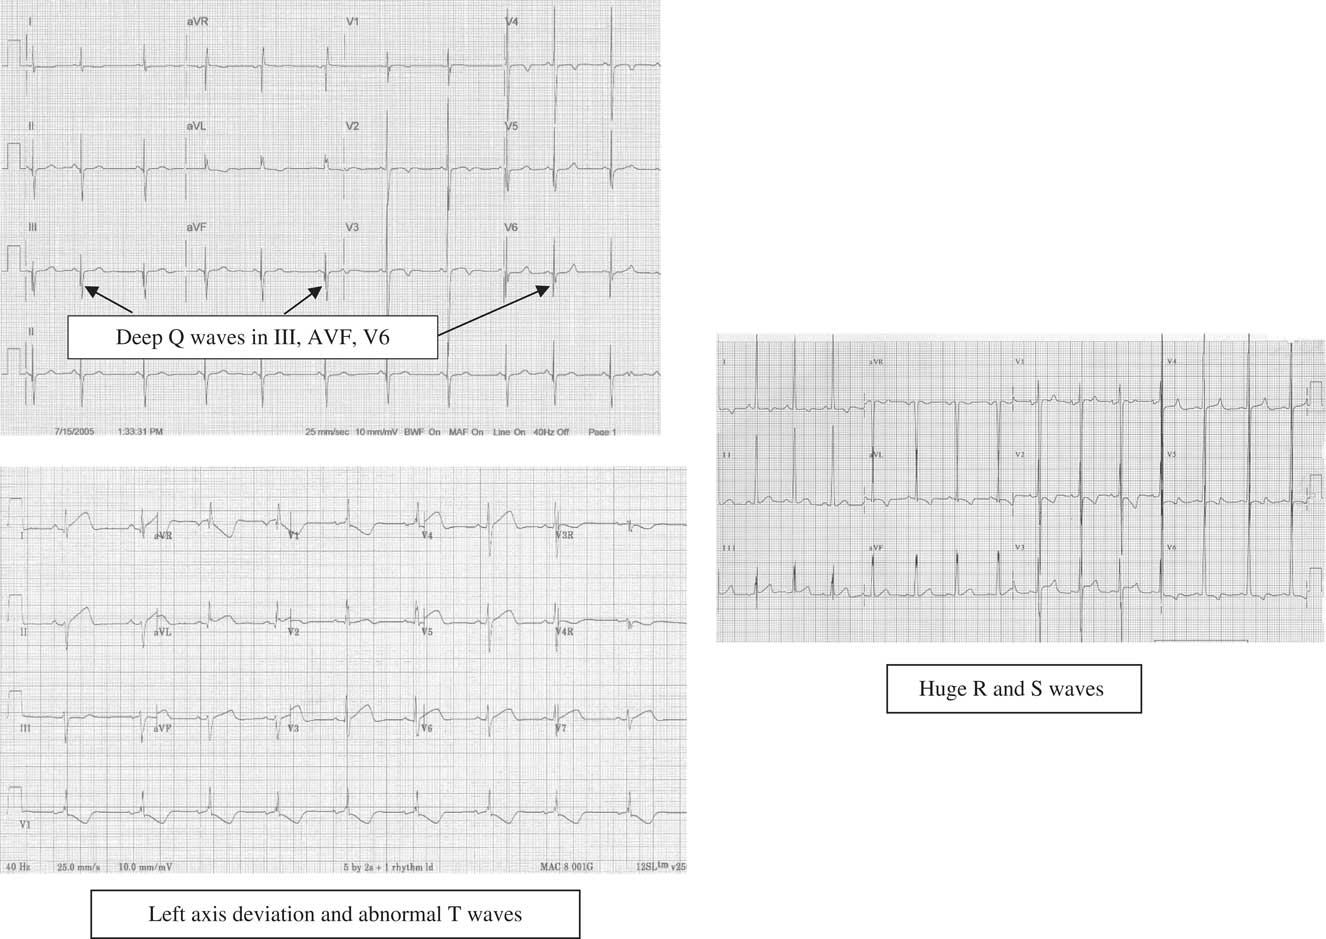
Electrocardiography still has a place in the diagnosis of athlete’s heart versus true heart disease. Gersh et alReference Gersh, Maron and Bonow 5 recommends electrocardiography as a class I recommendation and as a component of the screening algorithm for hypertrophic cardiomyopathy. Instead of the electrocardiographic changes noted in trained athletes mentioned above, patients with hypertrophic cardiomyopathy will have abnormal variants in about 90% of cases.Reference Rowin, Maron and Appelbaum 27 These changes may include left-axis deviation, excessive left ventricular voltage, deep Q waves, and deeply inverted T waves. Less commonly, arrhythmias may be observed, including premature atrial or ventricular contractions, atrial fibrillation, or even ventricular tachycardia (see Fig 5).
Examples of the electrocardiographic abnormalities that can be seen with hypertrophic cardiomyopathy.

The diagnosis of arrhythmogenic right ventricular cardiomyopathy is made using diagnostic criteria described by the International Task Force on Arrhythmogenic Right Ventricular Cardiomyopathy.Reference Marcus, McKenna and Sherrill 28 This disease is not usually confused with athlete’s heart, although both entities may share right ventricular enlargement by both echocardiography and electrocardiography, ventricular premature beats, and T wave inversions in the praecordial leads. The diagnosis of arrhythmogenic right ventricular cardiomyopathy is made on the basis of findings from a combination of echocardiography or cardiac MRI, electrocardiography, 24-hour ambulatory rhythm monitoring, signal averaged electrocardiography, and family history. Typically, no single test can make the diagnosis of arrhythmogenic right ventricular cardiomyopathy alone, as a combination of major and/or minor criteria is needed.
Deconditioning as a diagnostic test
When considering patients who have mild left ventricular hypertrophy and a normal left ventricular end-diastolic dimension, discrimination of athlete’s heart versus hypertrophic cardiomyopathy may still be difficult. A characteristic of athlete’s heart that is not seen in hypertrophic cardiomyopathy is that of re-modelling of the left ventricle back towards normal when an athlete stops or reduces his or her training. Maron et alReference Maron, Pelliccia, Spataro and Granata 8 in 1993 and Pelliccia et alReference Pelliccia, Maron, De Luca, Di Paolo, Spataro and Culasso 29 in 2002 demonstrated the effects of deconditioning on left ventricular wall thickness and end-diastolic dimension., The athletes in Maron’s study deconditioned for 6 to 34 weeks, and the athletes in Pellicia’s study deconditioned for at least 1 year. Both studies demonstrated reversal of echocardiographic findings. Pellicia et al demonstrated reversal of both echocardiographic and electrocardiographic changes; however, reversal of the left ventricular end-diastolic dimension did not always occur.
The apparently healthy young athlete and how to deal with the “grey zone”
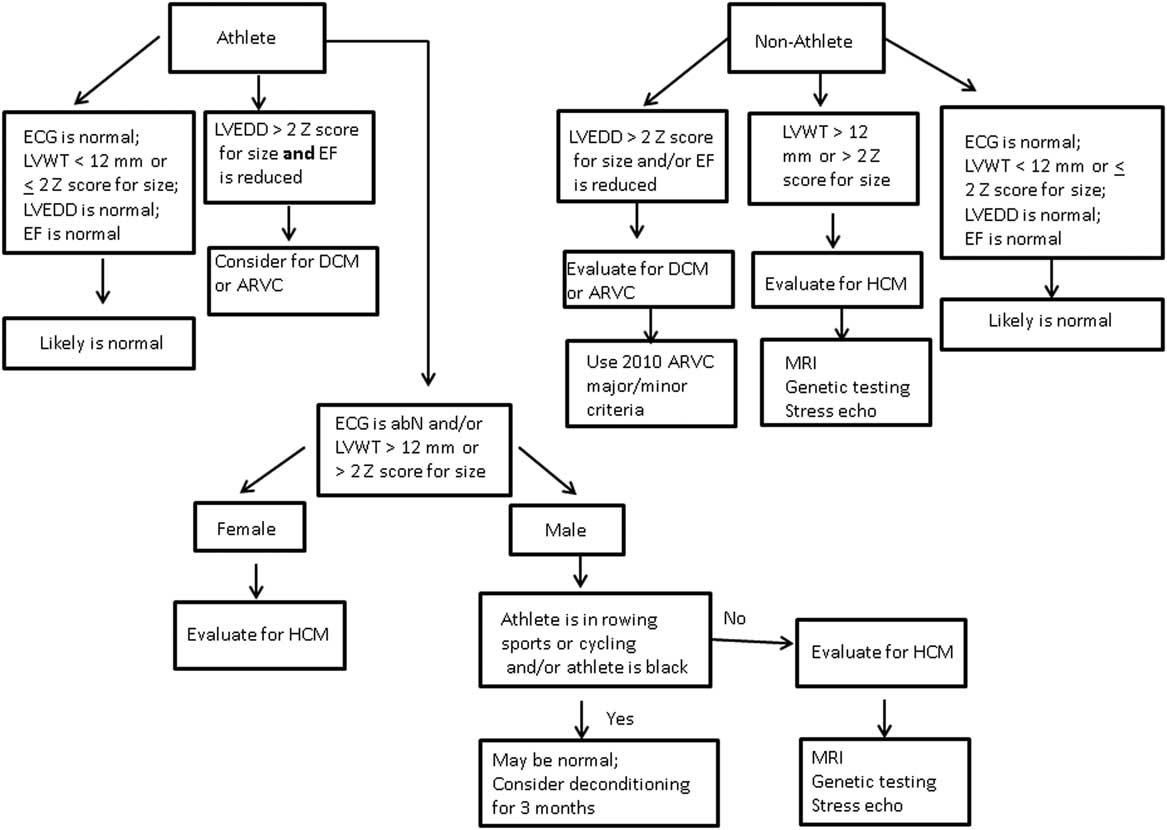
Multiple studies in teenagers and adults have shown that the normal left ventricular wall thickness is 12 mm or less, and that the diagnosis of hypertrophic cardiomyopathy may be made when the left ventricular wall thickness is at least 15 mm. A firm diagnosis may be difficult in patients whose left ventricular wall thickness falls between those values. Electrocardiographic, historical, and other echocardiographic features may be used to help differentiate athlete’s heart from a myopathic heart, including hypertrophic cardiomyopathy. Figure 6 provides a stepwise method of differentiating athlete’s heart from other cardiomyopathies. Application of cardiac dimensions as specific values is problematic in younger children, especially those who are <30–40 kg in weight or <1.0–1.2 m2 in body surface area. The study by Lipshultz et al30, which provides risk stratification in younger children having hypertrophic cardiomyopathy, uses the z scores of these dimensions and may be a useful guide for this disorder and for Figure 6.
Algorithm that can help distinguish hypertrophic cardiomyopathy from athlete’s heart. Note the differences between the path for athletes and non-athletes. ECG=electrocardiogram; RBBB=right bundle branch block; LVH=left ventricular hypertrophy; TWI=T wave inversions; LBBB=left bundle branch block; ER=early repolarization; PVC=premature ventricular contraction; BA=Black athletes; LVEDD=left ventricular end diastolic dimension; EF=ejection fraction; DCM=dilated cardiomyopathy; ARVC=arrhythmogenic right ventricular cardiomyopathy; LVWT=left ventricular wall thickness; HCM=hypertrophic cardiomyopathy; SCD=sudden cardiac death.

How and when do we apply this algorithm to the apparently healthy young athlete? A personal database should always be constructed – for example, in every pre-sports participation assessment, it is important to establish a history of regular athletic training. Generally, an adolescent who participates in year-round athletics – school varsity sports plus club/select teams in the summer – particularly if they have a prescribed training regimen from their schools in the off seasons – should be considered highly conditioned. Pre-adolescent children are less likely to be involved in physical training programmes, such as prescribed running and weight lifting, despite participating in various team sports most of the year. It is important to note the types of sports in which the athlete is engaged, the athlete’s ethnicity, personal history of symptoms possibly related to heart disease, and the appropriate family history.
Although the algorithm in Figure 6 implies that an echocardiogram is performed alongside the electrocardiogram, the electrocardiogram is usually the initial test, either as part of an organised screening programme or for the individual athlete as part of normal healthcare maintenance, although the latter is controversial. If abnormalities are found according to the refined criteria of Sheikh or if there are frankly obvious abnormalities, cardiac disease should be suspected.
Echocardiography is then used to establish phenotype and provide initial measurements – for example, when considering hypertrophic cardiomyopathy, a morphological assessment of the mitral valve, papillary muscles, and left ventricle is essential. In a patient with left ventricular end-diastolic dimension above the mean for age and particularly if the wall thickness is at or just above the upper limit of normal with normal ejection fractions/shortening fraction, the diagnosis of hypertrophic cardiomyopathy is very unlikely.
Deconditioning should be used sparingly, as it is usually met with resistance by the patient and parents. That said, the diagnosis of hypertrophic cardiomyopathy is serious and results in restriction from most competitive sports. Accuracy in diagnosis is paramount, meaning that there will be occasional athletes in whom deconditioning may be the shortest route for the patient to get back to participation if regression of left ventricular hypertrophy can be demonstrated. No athletic clearance forms should be signed until a firm diagnosis is made or rejected.
Summary
Regular athletic training causes cardiac re-modelling, which is reflected by electrocardiographic and echocardiographic changes. Some of these changes can create a challenge in discriminating the athlete’s heart versus a form of cardiomyopathy. Diagnostic measurements have been described and proven to be particularly useful for discerning athlete’s heart from hypertrophic cardiomyopathy. As with many other conditions, no single test can clinch or refute either diagnosis. An algorithm as seen in Figure 6 can be used to help differentiate athlete’s heart from hypertrophic and other cardiomyopathies.
Acknowledgements
None.
Financial Support
The author is a paid consultant for Medtronic, Inc.
Conflicts of Interest
None.
Ethical Standards
The authors assert that all referenced work contributing to this review complies with the ethical standards of biomedical or medicolegal investigation.