I. INTRODUCTION
III-Nitride semiconductors have paved the way for exciting innovations in solid-state lighting, power electronics, and other diverse applications across various technologies and clean energy sectors. The immense technological importance of the III-Nitrides is mostly motivated by their direct band gaps covering the energy region from 0.7 eV (InN) to 6.2 eV (AlN), i.e., from infrared to ultraviolet parts of the electromagnetic spectrum. Additionally, their exceptional hardness, breakdown field, chemical inertness, and high thermal conductivity allow for device operation at high voltage, high frequencies, and high temperature, surpassing the capabilities of the previously established semiconductors.
The growth development of nitrides has been marked by challenges and tremendous efforts to achieve further improvements. As a result of the intensive research, several breakthroughs, including the development of low-temperature buffers, doping control, lateral epitaxial overgrowth and recent advances in bulk nitride growth technology have been demonstrated. Currently, a variety of optoelectronic and power electronic devices with impressive performance have been developed and implemented in modules showing energy-related benefits. Furthermore, initial results show a significant potential of nitrides for applications in other important technologies, such as photovoltaic, piezoelectric, chemical, and biochemical sensors, as well as in integration with other organic and inorganic materials. However, more research is needed for their technology developments to fully explore and optimize these applications.
GaN crystals as well as various binary compounds have wurtzite crystal structure, named after the mineral wurtzite. Often, wurtzite is not the favored form of the bulk crystal, but the structure can be favored in some nanocrystal forms of the material. The wurtzite crystals belong to the P63
mc crystallographic group (n. 186) and are noncentrosymmetric (i.e., lacking inversion symmetry). Each of the two individual atom types of wurtzite lattice forms a sublattice, which is hexagonal close-packed type. Each atom is tetrahedrally coordinated. In contrast to the fcc close-packed structure with the ABC plane stacking in the [111] direction, the wurtzite close-packed structure exhibits AB plane stacking in the [0001] direction. The planes with A atoms are separated from the planes with B atoms in the direction of the hexagonal c-axis. The bonds, forming alternatively single bond parallel to the c-axis and triple bonds symmetrically surrounding the c-axis, separate the individual sublattices and are thus responsible for the first bigger and for the second smaller interplane distance. In this direction, the crystal polarity is closely correlated with the chemical nature of the topmost <c> plane. The (0001), c, and
 $\left( {000\bar 1} \right)$
, −c, surface planes are defined as crystal terminated either by cation or anion planes, respectively.
The polarity is an inherent property of the wurtzite nitride materials and is well known to have a detrimental effect on optoelectronic devices due to piezoelectric and spontaneous polarization field along the typical [0001] growth direction, and a beneficial effect on doping flexibility of two-dimensional electron gas in field-effect transistors although it predetermines their normally-on regime. The growth along the [0001] polarity was preferred and better controlled for long time, but recently different approaches have been proposed to accomplish growth in either polarity. Reference Huang, Visconti, Jones, Reshchikov, Yun, Baski, King and Morkoc1,Reference Cao, Xu, Seo, Arita, Nishida, Ishitani and Yoshikawa2 The two polarities of the polar GaN material have different chemical stabilities due to their different bond arrangements on the Ga- and N-face surfaces which requires different material etching process. Reference Hite, Garces, Goswami, Mastro, Kub and Eddy3 Additionally, the different surface energies allow for different growth rates and impurity incorporation efficiencies. The latter is also valid for the polarity of the various semipolar GaN orientations, Reference Cruz, Keller, Mates, Mishra and DenBaars4 and some recent reports indicate preferred semipolar polarity for accomplishing longer wave length light emitting device structures. Reference Huang, Hardy, Fujito, Feezell, Speck, DenBaars and Nakamura5 The polarity was also found to have a pronounced effect on surface sensitivity to oxide formation and subsequently on adsorption efficiency of various chemical molecules. Reference Wilkins, Greenough, Arellano, Paskova and Ivanisevic6 This is critically important for nitride surface functionalization and needs to be accounted for to select the best crystallographic orientation and polarity for any specific optoelectronic, chemical, and biochemical sensor application.
Apart from the high-symmetry polar c-plane, the wurtzite crystals exhibit two high-symmetry nonpolar types of planes parallel to the c-axis (perpendicular to the c-plane): the m-planes and the a-planes [Figs. 1(a), 1(b), and 1(e)]. During the last decade, nitride device structures with active regions aligned along the nonpolar planes have emerged as a subject of considerable scientific and technological interest with the hope that the absence of spontaneous polarization field in the device structures with these orientations will help to increase the device efficiency. However, the growth in these directions has faced significant challenges related to stacking fault structural defects generation in the case of using foreign substrates
Reference Speck and Chichibu7,Reference Paskova8
and difficulties in indium doping elements incorporation efficiency.
Reference Durnev, Omelchenko, Yakovlev, Evstratov and Karpov9,Reference Akiyama, Yamashita, Nakamura and Ito10
An alternative approach of using semipolar orientations emerged during the last few years with the hope to achieve the desired high-indium composition in the In
x
Ga1−x
N alloy and still taking a benefit of reduced polarization field. Semipolar planes can be obtained by gradually inclining one of the nonpolar planes to the polar c-plane. In this way, semipolar planes can be divided into two groups: m-group (e.g.,
 $\left\{ {10\bar 11} \right\}$
or
 $\left\{ {20\bar 21} \right\}$
surface planes) and a-group (e.g.,
 $\left\{ {11\bar 22} \right\}$
plane).
Important crystallographic planes of the wurtzite structure: (a) polar c-plane {0001}, nonpolar (b) a-plane (
 $11\bar 20$
) and (e) m-plane (
 $1\bar 100$
), semipolar planes of m-group (c) (
 $10\bar 11$
) and (d) (
 $20\bar 21$
) and a-group (f) (
 $11\bar 22$
) are shown. The a-plane and m-plane are perpendicular to the m-group and a-group semipolar surfaces, respectively. (g) Atomic ordering in the m-plane and a-plane. The XPD experimental geometry is shown in (h).

The first explored approach to grow nitrides along semipolar directions used foreign substrates with specific surface crystallographic planes. This heteroepitaxial approach, however, resulted in similar complications as the heteroepitaxial growth in the nonpolar directions, i.e., high density of dislocations and stacking faults, which hinder the device performance. Reference Speck and Chichibu7 A promising alternative of forming semipolar facets during vertical selective growth along the polar direction through mask patterning and stopping the growth before a coalescence takes place was suggested and studied by several research groups. Reference Nishizuka, Funato, Kawakami, Fujita, Narukawa and Mukai11–Reference Scholz, Wunderer, Neubert, Feneberg and Thonke16 However, this growth concept also resulted in basal plane stacking faults found in the active regions. Reference Wunderer, Lipski, Schwaiger, Hertkorn, Wiedenmann, Feneberg, Thonke and Scholz17,Reference Tischer, Feneberg, Schirra, Yacoub, Sauer, Thonke, Wunderer, Scholz, Dieterle, Müller and Gerthsen18 Later on, a similar facet growth was proposed, using patterned or prestructured sapphire substrates, Reference Scholz, Meisch, Caliebe, Schrner, Thonke, Kirste, Bauer, Lazarev and Baumbach19,Reference Meisch, Alimoradi-Jazi, Klein and Scholz20 forcing the growth along inclined semipolar directions, but the coalescence regions possess complicated microstructure. Most recently, an approach based on lateral growth on the walls of preliminary etched trenches within regularly grown c-plane epitaxial layer was found promising. Reference Nepal, Frajtag, Zavada, El-Masry and Bedair21–Reference Tendille, De Mierry, Vennéguès, Chenot and Teisseire24 Depending on the orientation of the grooves and the depth of the etching, different sets of semipolar or semi/nonpolar facets were achieved. Reference Frajtag, Nepal, Paskova, Bedair and El-Masry22 This approach resulted in lower dislocation density but requires a precisely tuned etching to achieve reproducible set of facets and a complicated analysis of the multifacets formed. The most controllable approach for the growth of device structures with semipolar orientations remains the homoepitaxial growth on bulk nitride substrates with orientations of interest and with low-dislocation density. These semipolar substrates, sliced from boules grown along the c-direction, Reference Zhong, Tyagi, Pfaff, Saito, Fujito, Speck, DenBaars and Nakamura25–Reference Raring, Schmidt, Poblenz, Li, Chang, Mondry, Lin, Krames, Craig, Speck, DenBaars and Nakamura27 however, are still limited in size and remain very expensive.
As the conventional x-ray diffraction (XRD) does not provide the information about wurtzite polarity, different methods had to be developed for assessment of the polarity of the grown wurtzite structures. In the case of polar GaN, the easiest but destructive method for polarity determination is etching in KOH solution. Reference Seelmann-Eggebert, Weyher, Obloh, Zimmermann, Rar and Porowski28,Reference Hestroffer, Bougerol, Leclere, Renevier and Daudin29 Several other experimental techniques for polarity determination can be used such as convergent beam electron diffraction, Reference Hestroffer, Bougerol, Leclere, Renevier and Daudin29,Reference Fernández-Garrido, Kong, Gotschke, Calarco, Geelhaar, Trampert and Brandt30 electron energy loss spectroscopy, Reference Fernández-Garrido, Kong, Gotschke, Calarco, Geelhaar, Trampert and Brandt30,Reference Kong, Ristic, Sanchez-Garcıa, Calleja and Trampert31 aberration-corrected scanning transmission electron microscopy, Reference den Hertog, González-Posada, Songmuang, Rouviere, Fournier, Fernandez and Monroy32 piezoresponse force microscopy, Reference Brubaker, Levin, Davydov, Rourke, Sanford, Bright and Bertness33 photo-assisted Kelvin probe force microscopy, Reference Wei, Neumann, Wang, Li, Fündling, Merzsch, Al-Suleiman, Sökmen, Wehmann and Waag34 and resonant XRD with tunable monochromatic synchrotron radiation. Reference Hestroffer, Bougerol, Leclere, Renevier and Daudin29 All of these techniques, however, are either destructive or require advanced specialized equipment.
Photoelectron emission from core atomic levels provides localized source of electrons for their further diffraction within the crystal. Because of this and due to the fact that the inelastic mean free paths (IMFP) Reference Seah and Dench35 of emitted electrons and photoelectron attenuation length Reference Romanyuk and Bartos36 are relatively short, it is possible to examine the atomic arrangement within a vicinity of the emitting atom. One can expect that angular distributions of the photoelectrons emitted from core atomic levels will be different for two polarities of the crystal. This has been experimentally observed in hemispherical plots of photoemitted electron intensities long time ago in standard x-ray emission Reference Denecke, Morais, Wetzel, Liesegang, Haller and Fadley37,Reference Hofstetter, Despont, Garnier, Baumann, Giorgetta and Aebi38 and recently in the high-energy region initiated by synchrotron radiation.
Polar GaN(0001) thin films grown by metal-organic chemical-vapor deposition on c-plane (0001) sapphire substrates were investigated by standard XPD (Al Kα excitation from Ga 3p and N 1s levels). Reference Denecke, Morais, Wetzel, Liesegang, Haller and Fadley37 The electron analyzer was equipped with a two-axis goniometer enabling rotation of the sample around two perpendicular axes to cover the full 2π solid angle of electron emission directions above the surface. Comparison of experimental data with theory for the +c and –c oriented surfaces yielded a better agreement for the −c polarity of the surface. Similar study of InN films deposited by plasma-assisted molecular beam epitaxy and reliability factor (R-factor) analysis of the hemispherical 2π XPD patterns (Mg Kα excitation hν = 1253 eV from In 3d level) enabled justification of the +c polarity of the surfaces. Reference Hofstetter, Despont, Garnier, Baumann, Giorgetta and Aebi38 A computer controlled two-axis goniometer has been utilized. Reference Hofstetter, Despont, Garnier, Baumann, Giorgetta and Aebi38 In both cases, special goniometers were needed to measure full hemispherical patterns of photoelectron intensities. Furthermore, polar InN films prepared by radio-frequency assisted molecular beam epitaxy have been similarly investigated by hard XPD (HXPD, Cr Kα excitation hν = 5415 eV) in Ref. Reference Yang, Yamashita, Kobata, Matsushiya, Yoshikawa, Píš, Imura, Yamaguchi, Sakata, Nanishi and Kobayashi39, and the difference of polar plots in a high-symmetry azimuth (m-plane) for two terminations was demonstrated and discussed. Another approach of studying surface polarity of wurtzite materials using highly advanced equipment was shown for ZnO crystals. Reference Williams, Kobata, Píš, Ikenaga, Sugiyama, Kobayashi and Ohashi40 Polar ZnO(0001) single crystal samples with both terminations have been investigated by HXPD (synchrotron radiation excitation with hν = 7940 eV). Polar angle dependence in the range of 0°–45° has been obtained with an array detector and azimuthal dependence has been measured by rotating the sample. From two-dimensional intensity distributions for crystals with both terminations, a sensitive region in azimuthal plots has been selected, which enabled the determination of the crystal polarity and thus, reducing the amount of experimental data needed.
In the present study, free-standing GaN crystals were analyzed by XPD with typical x-ray source for x-ray photoelectron spectroscopy (XPS). The paper is organized as follows. First, experimental and computational details are described. Second, the polar GaN{0001} polarity analysis by XPD is given. To demonstrate XPD data sensitivity to the GaN surface polarity, the anion N 1s and cation Ga 3d core level XPD patterns are shown. Finally, XPD N 1s patterns from the m-group semipolar GaN surfaces namely,
 $\left\{ {10\bar 11} \right\}$
and
 $\left\{ {20\bar 21} \right\}$
and from the a-group semipolar GaN
 $\left\{ {11\bar 22} \right\}$
surfaces are analyzed.
II. EXPERIMENTAL DETAILS
For this study, we used both polar and semipolar GaN samples with high crystalline quality. All the studied samples have been free-standing bulk GaN wafers grown by hydride-vapor phase epitaxy (HVPE) on a sapphire substrate along the [0001] direction. Reference Paskova and Evans41 The polar GaN samples have been grown by single-wafer growth approach, and the as-grown GaN substrates had a size of 10 × 10 mm and thickness of about 1.2 mm with a dislocation density in the range of 105–106 cm−3. These GaN bulk wafers were self-separated from the sapphire substrate during the cooling down from the growth temperature, and both sides of the GaN samples were polished. Smooth surfaces with typical RMS of about 1 nm over areas 1 μm × 1 μm on either the Ga-face or N-face were prepared.
The semipolar bulk GaN wafers have been sliced from HVPE GaN boules also grown on sapphire substrates along the c-axis. High-resolution XRD was used to identify the crystallographic orientation with respect to the growth direction and to align the boule accordingly for slicing semipolar wafers of interest. The crystal boules were tilted: (i) to either −15° clockwise from the [0001] normal for
 $\left( {20\bar 21} \right)$
or +15° counter clockwise for
 $\left( {20\overline {21} } \right)$
cuts; (ii) to either −28° or +28° in the case of
 $\left( {10\bar 11} \right)$
and
 $\left( {10\overline {11} } \right)$
cuts; and (iii) to either −31.6° or +31.6° in the case of
 $\left( {11\bar 22} \right)$
and
 $\left( {11\overline {22} } \right)$
, respectively. Rectangles of semipolar substrates of 5 × 10 mm2 in size were diced from the boules and polished to epi-ready status.
Reference Paskova and Evans41
Prior to loading into a ADES-400 angular-resolved photoelectron spectrometer, all the GaN surfaces were cleaned ex situ in a HCl:DIH2O (1:1) solution at 75 °C for 10 min. Contamination-free surfaces have been achieved by applying a few cycles of sputtering by N ions and annealing in an NH3 atmosphere. More details on clean surface preparation can be found elsewhere. Reference Romanyuk, Jiříček, Paskova, Bieloshapka and Bartoš42,Reference Romanyuk, Jiříček, Paskova and Bartoš43
XPD measurements were performed in ADES-400 occupied by a standard laboratory x-ray source (Mg Kα excitation, 1253 eV). The sample surface is homogenously irradiated by x-rays, and the photoelectrons are collected from the entire sample surface. The N 1s core level (binding energy 397 eV) and Ga 3d (binding energy 19 eV) photoelectrons were excited within a-planes or m-planes of the GaN crystal. In Fig. 1(h), the XPD experimental setup is shown schematically. An incident x-ray beam is impinged on the surface at 70° with respect to the surface normal. Electron emission angle (θp for polar orientations and θs for semipolar orientations) was varied by movement of the electron energy hemispherical analyzer from the sample surface normal over a range of 0–50° in 2° step increment. Shirley background was subtracted from the experimental N 1s peaks. Area under the peak, i.e., peak integral intensity, was derived by peak fitting. A Gaussian function was used for fitting. To compare experimental data and theoretical calculations, XPD intensities were normalized to the maximal intensity of the particular polar plot.
III. COMPUTATIONAL DETAILS
XPD patterns were computed for the ideal-terminated (1 × 1) GaN surface unit cells by the EDAC code taking multiple electron scatterings into account. Reference de Abajo, Van Hove and Fadley44 Possible atomic surface reconstruction contributions to the XPD intensities were previously found negligible for the high kinetic energy Reference Bartoš and Romanyuk45,Reference Bartoš and Romanyuk46 and, therefore, were not taken into account. In this study, the calculations were carried out for large parabolically shaped atomic cluster consisting of 1000 atoms. Details about input parameters for XPD pattern calculations can be found elsewhere. Reference Romanyuk, Jiříček, Paskova and Bartoš43
The (1 × 1) surface unit cells were described by the (|
a
|, |
b
|, γ) translations, where |
a
| and |
b
| are the cell translation vectors and γ is the angle between the vectors. The polar GaN{0001} (1 × 1) cell has (3.18 Å, 3.18 Å, 120°) translation, while the semipolar GaN
 $\left\{ {10\bar 11} \right\}$
,
 $\left\{ {20\bar 21} \right\}$
, and
 $\left\{ {11\bar 22} \right\}$
cells are described by the (3.18 Å, 6.07 Å, 105.19°), (3.18 Å, 10.81 Å, 98.46°), and (5.51 Å, 6.07 Å, 90°) translations of the (1 × 1) unit cell, respectively.
A. Polarity of GaN{0001} surfaces
In photoelectron diffraction, two energy regimes are to be considered: the standard regime with electron energies 500–1500 eV (with IMFP of the order of 10–20 Å) and the HXPD regime with electron energies of 5–10 keV (with the IMFP reaching 100 Å). Each of them offers specific advantages and disadvantages: the HXPD displays numerous peaks in polar plots Reference Yang, Yamashita, Kobata, Matsushiya, Yoshikawa, Píš, Imura, Yamaguchi, Sakata, Nanishi and Kobayashi39,Reference Williams, Kobata, Píš, Ikenaga, Sugiyama, Kobayashi and Ohashi40 due to the long IMFP, which complicates the interpretation but can be applied to contaminated surfaces. The XPD with lower excitation energy, on the other hand, displays smaller number of peaks, which facilitates the interpretation but requires well-prepared clean surfaces for the measurement. In our study, we use a standard Mg Kα x-ray source and, therefore, special care was taken to prepare clean surfaces due to low IMFP.
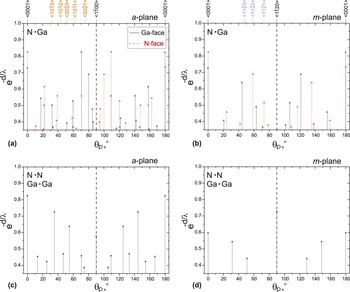
The electron, photoemitted from the emitter atom on its way to the surface, undergoes multiple electron-atom scatterings. The scatterings within one atomic sublattice are independent from the polar orientation of the crystal. But the scatterings from one sublattice to the other one differ: the orientation from the emitter A to the scatterer B differs for the two wurtzite orientations, as can be easily seen from Figs. 2(a) and 2(b), where the nearest neighbor atomic pair arrangements are displayed. The scattering geometry of Ga-polar crystals (black arrows) is different from the N-polar scattering geometry (red arrows). On the other hand, there is no difference in scattering geometry for the two polarities within one sublattice [A–A or B–B scatterings, blue arrows in Figs. 2(c) and 2(d)]. Therefore, just from these purely geometrical considerations, we can conclude that the angular distributions of photoemitted electrons will be different for two crystal polarities and can be used as a tool to determine the crystal polarity. This geometrical conclusion is, in fact, rather realistic for electrons with energies higher than about 500 eV since for these electrons the forward scattering dominates Reference Kono, Fadley, Hall and Hussain47 and the photoelectron intensity maxima are to be expected in emitter–scatterer directions. More precise description of the angular distribution of photoemitted electrons can certainly be provided by theoretical evaluation taking multiple electron scatterings into account.
Polar orientation of atomic pairs for GaN crystal in the a-plane and in the m-plane. Emitter to scatterer pairs are indicated in the upper left corners. Polar angles for +c Ga-face (full black arrows) and –c N-face (dashed red arrows) crystals are shown. Emitter–scatterer configurations are identical within the two atomic sublattices (blue arrows). Vertical arrow lengths decrease exponentially with the atomic pair separation d (fixed IMFP λ = 10 Å).

The GaN lattice contains cation and anion atoms, and photoelectron diffraction patterns can be excited either from Ga 3d or N 1s core level, respectively. As we show below, a proper choice of the core level increases the sensitivity of XPD to the crystal polarity.
Polarity of the crystal can be determined by comparing experimental and theoretical XPD patterns, e.g., by the reliability factor calculation. Reference Hofstetter, Despont, Garnier, Baumann, Giorgetta and Aebi38 However, acquisition of full hemispherical pattern is not easy and it could be time consuming. To mitigate this, we show that the XPD polar plots in the high-symmetry crystallographic azimuth only (within the m-plane and a-plane) are sufficient for polarity determination.
A schematic visualization of the polar c-plane (0001), the nonpolar m-plane
 $\left( {1\bar 100} \right)$
, and the nonpolar a-plane
 $\left( {11\bar 20} \right)$
are shown in Figs. 1(a), 1(b), and 1(e), respectively. The respective atomic arrangements of the m- and a-planes are shown in Fig. 1(g). The +c and −c directions are terminated by cation (blue, large) and anion (red, small) atoms, respectively.
The polar angles for anion–cation scattering pairs are shown for a-plane and m-plane in Figs. 2(a) and 2(b), respectively. The polar angle directions for the +c and −c crystal orientations are marked by black (solid) and red (dashed) arrows, respectively. The polar emission angle, θp, is referred to the {0001} surface normal (zero degree). The length of the arrows reflects the exponential decay of the photoelectrons with IMFP λ and anion–cation separation d in a crystal. The forward scattering angles differ for the two polarities in the case of anion–cation scattering pairs. In Figs. 2(c) and 2(d), the forward scattering angles are shown for anion–anion or cation–cation scattering pairs, respectively. In this case, there is no difference between +c or –c crystal orientation.
In addition to the scattering pair geometry, the emitter type is also crucially important. In Figs. 3(a)–3(d), simulated 2π XPD patterns are shown for GaN crystals with +c polarity [(a) N 1s, (b) Ga 3d patterns] and −c polarity [(c) N 1s, (d) Ga 3d patterns]. One can see that while there is a clear difference in the XPD patterns for the N 1s emitter for +c and –c crystal polarity, the Ga 3d patterns are similar. Therefore, from the two possibilities: A atom as emitter, B atom as scatterer and vice versa for A III B V wurtzite semiconductors, the anion as emitter and cation as scatterer appear more suitable as the scattering cross section for electrons is bigger for cations. This fact has additionally been supported by computing the Ga 3d XPD patterns for the cluster without anion atoms (not shown here), whose patterns were found almost identical to those in Figs. 3(b) and 3(d). Therefore, the dominant role of Ga scatterers was confirmed. Angular distributions of photoelectrons emitted from anion core levels are thus better suited for the wurtzite crystal polarity determination.
Calculated hemispherical plots of photoelectron intensities for the (0001) and (
 $000\bar 1$
) orientations of GaN crystals. Mg Kα excitation from N 1s core-level, (a) and (c), and from Ga 3d core level, (b) and (d), is presented; the intensities are normalized to the unity. The N 1s patterns differ for the two crystal polarities whereas Ga 3d patterns are similar. Experimental (full lines) and calculated (dashed lines) N 1s polar plots of the photoelectron intensities in the m-plane are shown in (e). Polar angle range with photoelectron intensity contrast suitable for polarity determination is marked in yellow.

For the polar distribution of the photoelectron intensities emitted from the N 1s level by Mg Kα radiation in the two higher symmetry planes [m-plane and a-plane, Fig. 1(g)], the m-plane with a simpler atomic arrangement has been chosen. From geometrical consideration in the vicinity of normal emission (usual limitation of the experimental setup), we can expect enhanced photoemission at polar angles of 21° for +c polarity and of 23° for –c polarity of GaN m-plane surface [Fig. 2(b)]. This was confirmed experimentally [Fig. 3(e)]. The slopes of the polar plots in the range of 20°–25° are different for the two polarities, and, therefore, are suitable for determining the surface polarity.
Reference Romanyuk, Jiříček, Paskova, Bieloshapka and Bartoš42
This angular range is highlighted in yellow in Fig. 3(e). Based on these polar plot measurements, a nondestructive approach for polarity determination was suggested as follows: the N 1s photoelectron intensity ratio I
20/I
25 is larger [blue dots in Fig. 3(e)] or smaller [red dots in Fig. 3(e)] than unity for the GaN (0001) or
 $\left( {000\bar 1} \right)$
surface,
Reference Romanyuk, Jiříček, Paskova, Bieloshapka and Bartoš42
respectively.
Furthermore, the experimental polar plots from free-standing GaN crystals can be used as a reference for comparative analysis of the XPD polar plots from nano-objects.
Reference Romanyuk, Fernández-Garrido, Jiříček, Bartoš, Geelhaar, Brandt and Paskova48
In contrast to the low-energy electron diffraction (LEED) intensity analysis, where the surface structure has to be ordered within the coherence length region, the polar plots of photoelectron diffraction, as a local structural probe, require only a shorter range ordering governed by the IMFP. The study of well-aligned or slightly misaligned GaN nanowire ensembles demonstrated this capability of our approach. We applied our method to dense arrays of NWs with wurtzite structure elongated along the <0001> axis on several substrates including SiC
 $\left( {000\bar 1} \right)$
and Si(111). We were able to identify the –c orientation of these GaN nanowires using the XPD polar plot profiles.
Reference Romanyuk, Fernández-Garrido, Jiříček, Bartoš, Geelhaar, Brandt and Paskova48
B. Polarity of semipolar GaN
 ${\bf{\left\{ {10\overline 11} \right\}}}$
and
${\bf{\left\{ {20\overline 21} \right\}}}$
surfaces


Semipolar wurtzite crystals possess polarity values between the extremes of the c-plane polarity and the m- or a-plane polarity. In semipolar crystals, the polarization effects are reduced. The wurtzite polarization decreases when raising the surface plane tilt from the c-plane toward the m-plane or a-plane. Between 0° and 90° plane tilt, the polarity has to go through zero before reaching zero polarity again at 90°. Reference Scholz49 Semipolar plane terminated GaN crystals with such reduced polarization will be discussed next, separately for planes tilted toward the a-plane (a-group planes) and toward the m-plane (m-group planes).
The semipolar plane normal vectors, n s, are shown by the ticks at the top axis of Figs. 2(a) and 2(b). The polar angles of ns give the inclination angle of the semipolar basal planes with respect to the c-plane. A similar principle of polarity determination as used for the polar c-plane orientation can be applied to the semipolar surfaces as the underlying crystal remains unchanged. Two differences have to be respected, however. First, the fact that the high-polar emission angles are to be avoided for experimental reasons, means that the emitter–scatterer pairs close to the normal of the polar c-plane may not be close to the normal of the semipolar terminated crystals and have to be replaced. Second, though for the polar c-plane, two higher symmetry planes (a-plane and m-plane) were eligible as azimuthal planes for polar plots, for the m-group semipolar planes only the a-plane and for the a-group semipolar planes only the m-plane can be used as azimuthal plane for polar plots.
The GaN
 $\left\{ {10\bar 11} \right\}$
and
 $\left\{ {20\bar 21} \right\}$
belong to the m-group semipolar surfaces. These semipolar surfaces are obtained by tilting the c-plane by 62° and 75° [inclination angles α, Fig. 2(a)], respectively, or by tilting the m-plane by 28° and 15° toward the c-plane, respectively [Figs. 1(c) and 1(d)]. As the a-planes are perpendicular to the surface, the a-plane was chosen as the azimuthal plane for polar plots of the photoelectron intensities. In Fig. 1(h), an experimental setup geometry is shown. The polar angle from the semipolar normal, θs (or analyzer angle), was varied within the a-plane.
From the geometrical plot of the polar orientations of N–Ga pairs for the two opposite polarities [Fig. 2(a)], it is clear that the polar angle range of 80° ≤ θp ≤ 100° from the [0001] direction provides the most pronounced differences in N–Ga forward scattering directions. The polar plots in this range appear, thus, suitable for determining the semipolar crystal polarity: in the lower part of this range, anion–cation arrows for cation-terminated crystals gradually decrease while those for anion-terminated crystal start increasing. This difference can serve as distinguishing criterion for semipolar GaN
 $\left\{ {10\bar 11} \right\}$
and
 $\left\{ {20\bar 21} \right\}$
crystal polarity determination.
Reference Romanyuk, Jiříček, Paskova and Bartoš43
In Figs. 4(a) and 4(b), the calculated 2π XPD patterns of N 1s photoelectron intensities from the GaN
 $\left( {10\bar 11} \right)$
and
 $\left( {10\overline {11} } \right)$
surfaces are shown, respectively. The polar angle, θs, on the patterns is referred to the semipolar surface normal. The a-plane corresponds to the azimuthal angles ϕ = 90° and ϕ = 270° and contains the
 $\left[ {\bar 1012} \right]$
direction. The m-plane normal
 $\left[ {10\bar 10} \right]$
is indicated in Fig. 4(a). The theoretical 2π XPD patterns are qualitatively different and, therefore, the GaN
 $\left\{ {10\bar 11} \right\}$
surface polarity can be distinguished easily from the N 1s patterns. Polar angle profiles along the high-symmetrical azimuths in specific polar angle ranges can be selected to simplify the polarity determination procedure.
Calculated hemispherical plots of photoelectron intensities for the GaN (
 $10\bar 11$
) and (
 $10\overline {11}$
) crystals. Results for the Mg Kα excitation from the N 1s, (a) and (b) are presented. The N 1s patterns differ for the two crystal polarities. Experimental (full lines) and calculated (dashed lines) N 1s polar plots of the photoelectron intensities in the a-plane are shown in (c). The range of polar angles suitable for polarity determination is highlighted in yellow.

The geometrical expectation of enhanced photoemission intensities due to forward focusing directions has been confirmed experimentally as well as theoretically.
Reference Romanyuk, Jiříček, Paskova and Bartoš43
In Fig. 4(c), experimental polar (solid lines) are compared with the theoretical polar plots for the N 1s core level. Photoelectron intensities decrease or increase within a range of polar angle 20° ≤ θs ≤ 27° along the ϕ = 90° azimuth for the
 $\left( {10\bar 11} \right)$
and
 $\left( {10\overline {11} } \right)$
surfaces, respectively.
The theoretical 2π XPD patterns of the N 1s photoelectron intensities from the GaN(
 $20\bar 21$
) and
 $\left( {20\overline {21} } \right)$
surfaces are shown in Figs. 5(a) and 5(b), respectively. The polar angle on the patterns is referred to the
 $\left\{ {20\bar 21} \right\}$
semipolar normal [θp = 75° in Fig. 2(a)]. The a-plane lies along the
 $\left[ {\bar 1014} \right]$
direction. The m-plane normal
 $\left[ {10\bar 10} \right]$
is also indicated on the pattern in Fig. 5(a). Similarly to the GaN
 $\left\{ {10\bar 11} \right\}$
patterns, the
 $\left\{ {20\bar 21} \right\}$
hemispherical patterns are qualitatively different for the two polarities. In particular, the normal emission is only enhanced for the
 $\left( {20\bar 21} \right)$
surface, whereas it is not for the
 $\left( {20\overline {21} } \right)$
surface.
Calculated hemispherical plots of photoelectron intensities for the GaN (
 $20\bar 21$
) and (
 $20\overline {21}$
) crystals. Results for the Mg Kα excitation from the N 1s, (a) and (b) are presented. The N 1s patterns differ for the two crystal polarities. Experimental (full lines) and calculated (dashed lines) N 1s polar plots of the photoelectron intensities in the a-plane are shown in (c). The range of polar angles suitable for polarity determination is highlighted in yellow.

Polar plot profiles within the a-plane (at ϕ = 90° azimuth) are shown in Fig. 5(c). According to the expected forward focusing directions, one should expect photoelectron intensity contrast within the polar angle range 5° ≤ θs ≤ 25°. As it can be seen from the experimental and theoretical intensity profiles in Fig. 5(c), a polar angle range 10° ≤ θs ≤ 22° enabled the determination of the polarity of
 $\left\{ {20\bar 21} \right\}$
crystal surfaces based on the following criterion: the experimental and theoretical photoelectron intensities decrease in the particular angle range for the GaN
 $\left( {20\bar 21} \right)$
substrate and start increasing for the GaN
 $\left( {20\overline {21} } \right)$
substrate. The important region is highlighted in yellow in Fig. 5(c).
C. Polarity of semipolar GaN
${\bf{\left\{ {11\overline 22} \right\}}}$
surfaces

The polarity determination of the a-group semipolar crystals by XPD is demonstrated here on an example of the GaN
 $\left\{ {11\bar 22} \right\}$
substrate. This semipolar plane is obtained when tilting the c-plane by inclination angle α = 58.4° or by tilting the a-plane by 31.6° toward the c-plane. As the m-planes are perpendicular to the a-planes, the m-plane is also perpendicular to all the
 $\left\{ {11\bar 22} \right\}$
planes [Fig. 1(f)] and to all the a-group semipolar surfaces.
The emitter–scatterer orientations for the m-plane of GaN are shown in Fig. 2(b). For the polar GaN{0001} substrates, the polar angle range between 20° ≤ θp ≤ 25° was found suitable for polarity determination [Fig. 3(e)]. This range corresponds to the 33.4° ≤ θs ≤ 38.4° with respect to the
 $\left\{ {11\bar 22} \right\}$
surface normal (azimuth ϕ = 270° in Fig. 6, along to the c-axis azimuthal direction).
Calculated hemispherical plots of photoelectron intensities for the semipolar GaN (
 $11\bar 22$
) and (
 $11\overline {22}$
) crystals. Results for the Mg Kα excitation from the N 1s, (a) and (b) are presented. The N 1s patterns differ for the two crystal polarities. Experimental (full lines) and calculated (dashed lines) N 1s polar plots of the photoelectron intensities along the ϕ = 270° and ϕ = 0° azimuths are shown in (c). Polar angle range with photoelectron intensity contrast suitable for polarity determination is highlighted in yellow.

The theoretical calculations of the angular distribution of XPD intensities over the whole hemisphere above the two surfaces with opposite polarity are shown in Figs. 6(a) and 6(b) for the N 1s core level emission. The higher symmetrical directions of the nonpolar
 $\left[ {11\bar 20} \right]$
and semipolar
 $\left[ {10\bar 11} \right]$
,
 $\left[ {20\bar 21} \right]$
planes are indicated: there are high photoelectron peak intensities along these directions in the case of the GaN
 $\left( {11\bar 22} \right)$
surfaces, whereas the intensities are depleted for the GaN
 $\left( {11\overline {22} } \right)$
surface. Again, theoretical full hemispherical patterns from the (
 $11\bar 22$
) and (
 $11\overline {22}$
) surfaces were found qualitatively different and, therefore, we predict that the polarity of these semipolar surfaces can be determined from the XPD patterns.
In Fig. 6(c), experimental (solid lines) and theoretical (dashed lines) N 1s polar plot profiles are shown for the GaN(
 $11\bar 22$
) and (
 $11\overline {22}$
) surfaces. The m-plane appeared along the ϕ = 270° azimuth [upper part of Fig. 6(c)]. The expected contrast due to forward focusing condition within polar angle range of 33.4° ≤ θs ≤ 38.4° is pronounced on the theoretical curves, but it is not obvious on the experimental curves. The reason is related to the high-polar emission angle with respect to the semipolar normal: the intensities drastically drop and the respective peak resolution decreases in this region. Therefore, despite the fact that this polar angle range within the m-plane is useful for polarity determination of polar GaN{0001} surfaces,
Reference Romanyuk, Jiříček, Paskova, Bieloshapka and Bartoš42
it does not appear useful for semipolar GaN{
 $11\bar 22$
} surfaces.
However, from the data shown in Fig. 2(b), one can propose another suitable angular range 0° ≤ θs ≤ 15° for polarity measurement based on the fact that the intensity increases for (
 $11\bar 22$
) and decreases for (
 $11\overline {22}$
) surfaces within this range at ϕ = 270° azimuth. This angle range involves enhanced intensities due to the forward focusing peaks [at θp = 43° for Ga-face and at θp = 58° for N-face in Fig. 2(b)].
In addition to the m-plane azimuth, the polar plots along the [
 $1\bar 100$
] directions (ϕ = 0° azimuth) can be used for polarity determination. The corresponding polar profile is shown in the lower part of Fig. 6(c). It is seen that the experimental intensity rises in the range 19° ≤ θs ≤ 26° for the (
 $11\bar 22$
) surface, whereas intensity gradually decreased for the (
 $11\overline {22}$
) surface. The theoretical curves agree well with the experimental ones. Therefore, these two azimuths of the semipolar GaN{
 $11\bar 22$
} surfaces can be used for polarity determination by XPD method. The ratio of the two N 1s peak intensities measured along the specific azimuth and polar angles (blue and red dots within the yellow area) provide a fast and simple method for assessment of the polarity of the semipolar GaN{
 $11\bar 22$
} surfaces.
IV. CONCLUSIONS
A relatively fast nondestructive technique based on photoelectron diffraction has been developed for polarity determination of polar and semipolar wurtzite crystals. The approach, developed for various terminations of GaN crystal, can be applied more generally to binary wurtzite semiconductor crystals if scattering properties of the two constituent atoms differ substantially. The method builds on characteristic differences in local atomic arrangements in the wurtzite structure and utilizes dominant forward electron scatterings of electrons with energies above 500 eV. These ideas have been applied to polar and several semipolar surfaces of GaN utilizing Mg Kα excitation source of photoemission from the N 1s core levels. The polar plots of the photoelectron intensities from anion core levels and even just the ratio of the intensities at two proper polar angles appear to be a sufficient criterion to determine the crystal orientation. Universally valid polar angle ranges in the higher symmetry azimuths, suitable for polarity determinations, have been determined.
ACKNOWLEDGMENTS
The support by the Academy of Sciences of the Czech Republic (Project No. M100101201) is highly appreciated. T. Paskova acknowledges the support by NSF (No. DMR-1207075).