

Introduction
Which level of government should decide on environmental problems: local governments such as city and prefectural governments, the central (national) government, regional governments such as ASEAN and EU, or the world government (the United Nations)? This paper addresses this question by analyzing cross-national opinion survey data. The purpose of this study is to find which level of government the ASEAN people prefer environmental issues to be decided by.
There are three areas of literature to which the present study is related. One of them is fiscal federalism in which the problems are analyzed more or less theoretically from the viewpoint of economics. After the publication of three seminal works by Oates (Reference Oates1972), Samuelson (Reference Samuelson1954), and Tiebout (1956), the field of fiscal federalism has addressed questions on which level of government implements which policy more efficiently, that is whether the loss of resources is smaller under the fiscal federal system.
The second related area of literature is that of public opinion polls. Since the literature addressing public opinion polls is huge, here I discuss some opinion research projects related to this study. Public opinion polls about certain social matters can be traced back to the 1930s in the United States (Ohtani et al., Reference Ohtani2005). Recently, there have been several social barometers and social reporting systems to monitor national and regional attitudes and perceptions of the citizens. The Eurobarometer, on behalf of European Commission, conducted its first survey in 1974. Social weather stations initiated an innovative concept, which is shared by other survey projects, that ‘surveys can serve like observation posts to monitor social conditions, much as meteorological stations monitor weather conditions’ (Michalos, Reference Michalos, Møller, Huschka and Michalos2008; Mangahas and Guerrero, Reference Mangahas, Guerrero, Møller, Huschka and Michalos2008). Among others are the European Values Study, which conducted its first survey in 1981, the World Values Survey led by Ronald Inglehart, which conducted its second survey in 40 countries from 1981 to 1984, and the AsiaBarometer Survey led by Takashi Inoguchi, which conducted surveys in 29 countries and societies in Asia and three non-Asian countries from 2003 to 2008.
The third related area of literature is the one which analyzes fiscal federalism using public opinion polls. DeBardeleben (Reference DeBardeleben2003) studies understandings of fiscal federal relations in Russia. Inglehart (Reference Inglehart1970) examines the extent to which public preferences influence national decision-making and promote regional integration. However, this area of literature would not be large enough – one possible reason is given in Graham's (2008) remark: ‘economists have traditionally shied away from survey data’. Our aim is to fill this void by studying the attitudes and preferences the ASEAN people hold about the level of government.
I will attempt to find which level of government the ASEAN people would like to handle environmental issues by analyzing opinion survey data. Stiglitz (Reference Stiglitz2000) in the related literature about fiscal federalism argues that local public goods are provided more efficiently by local governments, while pure public goods are provided more efficiently by the national government. It would follow that local environmental problems should be handled more efficiently by local governments, while national environmental problems should be solved more efficiently by the national government. But it is not obvious whether citizens consider in the same way as economics theory predicts. To unveil this point we decided to ask respondents directly to choose one level of government to take responsibility to protect the environment. By relating the responses to this question to the concerns about environmental issues the respondents have, we ask whether the ASEAN people consider the same way as the theory of fiscal federalism predicts. We intend to test the hypotheses that the ASEAN people prefer that local environmental issues are handled by local governments, while national environmental issues are decided by the national government, and that, in more general terms, the ASEAN people consider that environmental issues pertaining more to local and neighborhood features should be decided by the lower level of government, while environmental issues pertaining more to global features should be decided by the higher level of government. This study also examines whether the opinions and preferences vary across countries and across different groups of the population defined by gender, age, education, family income, and marital status within each country.
Analyses
This study utilizes the data of the ASEAN-Barometer Project which conducted surveys in ten countries of the Association of Southeast Asian Nations (ASEAN) from October 2009 to February 2010. The sample size is 1,000 for each of the ten countries except Brunei (1,022), Malaysia (1,024), and Myanmar (1,056). Nationwide surveys were conducted in Brunei, Cambodia, Philippines, and Singapore. Surveys were almost nationwide in Indonesia, Loas, Malaysia, Thailand, and Vietnam. Urban areas in Myanmar were surveyed. A multi-level stratified sampling method and/or quota sampling method were used with face-to-face interviews.
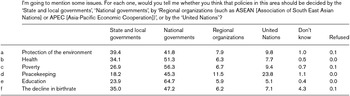
In the ASEAN-Barometer questionnaire, I look at the question which asked the respondents to choose a level of government to set certain policies. The exact wording of the question is ‘I’m going to mention some issues. For each one, would you tell me whether you think that policies in this area should be decided by the “State and local governments”, “National governments”, by “Regional organizations (such as ASEAN [Association of South East Asian Nations] or APEC [Asia-Pacific Economic Cooperation])”, or by the “United Nations”?’ The six response categories are ‘State and local governments’, ‘National governments’, ‘Regional organizations (such as ASEAN [Association of South East Asian Nations] or APEC [Asia-Pacific Economic Cooperation])’, ‘United Nations’, and ‘Don't know’ and ‘Refused’. The question referred to six issues: ‘Protection of the environment’, ‘Health’, ‘Poverty’, ‘Peacekeeping’, ‘Education’, and ‘The decline in birthrate’. Table 1 reports the distribution of survey responses across the six response categories for the six issues. Since this question was not asked in the Myanmar survey, the Myanmar sample is excluded from the analysis. In addition, although Singapore is a small country with no local or regional government this question was asked anyway, but the results from the Singapore survey should not be compared with other country surveys. Thus, Table 1 (and the following analyses) is based on the survey responses of 8,046 respondents from eight countries, excluding Myanmar and Singapore.
Policies and governments to set the policies

Notes: Percentages are based on 8,046 respondents in eight countries excluding Myanmar and Singapore.
Among these six issues, ‘Protection of the environment’ is our focus. In ASEAN countries as a whole, people tended to choose their national government as the government which should decide on environmental protection policy. Of the four levels of governments, ‘National governments’ was the most popular choice, selected by more than two-fifths (42%) of respondents. The second most frequent choice was ‘State and local governments’ (39%). Less than one-tenth (8%) of respondents considered that the policy to protect the environment should be decided by regional organizations such as ASEAN, while about one out of ten (10%) chose the United Nations. One per cent replied with ‘Don't know’ and 0.1% refused to answer to this question.
When we compare the percentages of those who chose ‘State and local governments’ across the six issues, according to Table 1, we notice that the percentage was the highest at 39% for ‘Protection of the environment’ among the six areas. The second highest percentage (35%) of those who chose ‘State and local governments’ goes to ‘The decline in birthrate’. The percentage was the lowest for ‘Peacekeeping’ (18%).
When we compare the percentages of those who chose ‘National governments’ across the six issues, the percentage was the highest at 65% for ‘Education’, which is followed by ‘Poverty’ (56%). The percentage was the lowest at 42% for ‘Protection of the environment’ among the six issues.
That is, in ASEAN countries as a whole, among the four levels of government the national government is the level of government which the largest proportion (42%) consider environmental protection policy should be decided by, while among the six issues ‘Protection of the environment’ is the issue which has the highest percentage (39%) of those who chose their state and local governments. On the other hand, when we compare the six percentages of those who chose their national government, ‘Protection of the environment’ is the lowest at 42%.
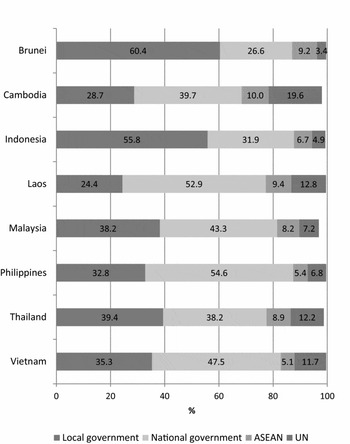
Figure 1 shows that the distributions of survey responses to this question by country. The figure shows the answers to these questions vary across nations. The proportion of respondents who prefer ‘State and local governments’ was the highest in Brunei, where about three-fifths (60%) of respondents think that ‘Protection of the environment’ should be decided by state and local governments. It was followed by Indonesia – more than half (56%) of the Indonesian respondents chose ‘State and local governments’ as the government which decides the policy to protect the environment. The percentage of those who chose ‘State and local governments’ was the lowest in Laos (24%), followed by Cambodia (29%).
Level of government to decide the environmental policy (by country) Note: Percentages are based on 8,046 respondents in eight countries, excluding Myanmar and Singapore.

The proportion of respondents who chose ‘National governments’ was the highest in the Philippines. More than half (55%) of the Philippine respondents consider that the policy to protect the environment should be decided by their national government. It was followed by Laos. Also in Laos, more than half (53%) of respondents chose their national government to set environmental policy. On the other hand, the percentage of those who chose ‘National governments’ was the lowest in Brunei (27%), which was followed by Indonesia (32%).
The proportions of respondents who chose ‘Regional organizations (such as ASEAN or APEC)’ as the level of government to set environmental policy are generally lower than 10% in all the surveyed countries. The proportions of those who want the ‘United Nations’ to set environmental policy vary from 3% in Brunei to about two-fifths (20%) in Cambodia.
Hypothesis testing
The following five hypotheses are tested by applying regression analyses in which the dependent variables are the survey responses to the aforementioned question about the level of government to decide on the environmental issue.
Hypothesis 1: The people of ASEAN countries think that the environmental issues at local level should be decided by local governments.
Hypothesis 2: The people of ASEAN countries think that the environmental issues at national level should be decided by the central government.
Hypothesis 3: The people of ASEAN countries think that the environmental issues at regional level should be decided by regional organizations such as ASEAN or APEC.
Hypothesis 4: The people of ASEAN countries think that the environmental issues at global level should be decided by the United Nations.
Hypothesis 5: The people of ASEAN countries think that the environmental issues pertaining more to local and neighborhood features should be decided by the lower level of government, while the environmental issues pertaining more to global features should be decided by the higher level of government.
Three models are examined. Four regression equations are applied to the first model; one regression equation is applied the second model; and eight regression equations are applied to the third model. In the first model, in which four multi-level probit regressions are applied to the pooled data of nine countries, four dichotomous variables as dependent variables are constructed depending on survey responses to the question asking respondents which level of government the environmental issue should be decided by. If the answer is ‘State and local governments’, then the first dichotomous variable called Local government is coded as 1; otherwise 0. If the answer is ‘National governments’, then the second dichotomous variable called National government is coded as 1; otherwise 0. The third and fourth dichotomous variables called ASEAN and UN are constructed in the same way.
In the second model, in which one multi-level ordered probit regression is applied to the pooled data of eight countries, the dependent variable is converted to an ordinal-scale variable depending on the survey responses to the question about the level of government to decide on the environmental issue. The ordinal-scale dependent variable takes on the value of 1 if the respondent chose ‘State and local governments’, 2 if ‘National governments’ was chosen, 3 if ‘Regional organizations (such as ASEAN or APEC)’ was chosen, and 4 if ‘United Nations’ was chosen.
In the third model, ordered probit regression is fitted to the individual country data. The dependent variable is the same as the second model.
To test the aforementioned hypotheses, we construct three independent variables, which are intended to measure the extent to which respondents have concerns about environmental problems at three different levels: neighbor/local, national, and global. To construct these independent variables, I look at three questions in the environment module, one of the four modules of the ASEAN-Barometer questionnaire: health, environment, value, and demographic profile. The environment module is further divided into three levels: neighborhood and local, national, and global. The three levels of questions are clustered under the following headings ‘I would like to ask your view about the environmental condition of your neighborhood and local areas’; ‘I would like to ask you about the environmental issues as our national issues’; and ‘I would like to ask you a few questions about environmental issues on a global basis’. We chose one main question represented in each of the three levels. This is the key feature of our analysis in which we analyze the relationship between the respondents’ perceptions toward the three levels of environmental issues and their attitudes toward the four levels of government which decide on the environmental issues.
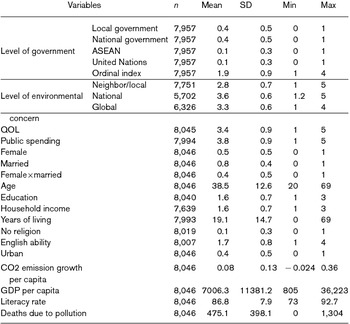
The question chosen from a batch of questions at neighborhood and local level in the environment module is as follows: ‘How often have you done any of the following actions during the last 12 months?’ The response categories and coded scores are ‘Never ( = 1)’, ‘Seldom ( = 2)’, ‘Sometimes ( = 3)’, ‘Often ( = 4)’, and ‘Always ( = 5)’ along with ‘Don't know’ and ‘Refused’ which are treated as missing values. This question was asked for the five items: ‘To reuse or recycle something rather than throw it away’, ‘To try to reduce water consumption’, ‘To try to reduce the amount of energy for cooking, cooling and heating’, ‘To use public transportation instead of using personal car’, and ‘To buy organic or chemical-free vegetables’. The five-point index labeled Neighbor/Local was constructed by averaging the answers to these five question items with scores ranging from 1 (low) to 5 (high). The average of this variable is 2.9 with the standard deviation of 0.8 as reported in Appendix B.
The question chosen from the national-level category in the environment module is ‘Compared to five years ago, do you think that the following issues have become more serious now?’ The response categories and coded scores are ‘Much more serious ( = 5)’, ‘More serious ( = 4)’, ‘Unchanged ( = 3)’, ‘Less serious ( = 2)’, and ‘Much less serious ( = 1)’ along with ‘Don't know’ and ‘Refused’ which are treated as missing values. This question was asked for the following 16 items: ‘Air pollution’, ‘Water pollution’, ‘Soil pollution’, ‘Noise pollution’, ‘Climate change’, ‘Urban heat island (metropolitan area which is warmer than its surrounding rural areas)’, ‘Pollution of beaches, river-side, lake-side, etc’., ‘Deforestation’, ‘Genetically modified foods issues’, ‘Water shortage’, ‘Using up our natural resources’, ‘Usage of chemicals and pesticides’, ‘Disposal of household waste and garbage’, ‘Disposal of industrial waste’, ‘Disposal of toxic or nuclear waste’, and ‘Loss of biodiversity (extinction of species, loss of wildlife and habitats)’. The five-point index labeled National was constructed by averaging the answers to these 16 question items with scores ranging from 1 (low) to 5 (high). The mean score of this variable is 3.7 with the standard deviation of 0.6 as reported in Appendix B.
Finally, the question chosen from the national-level category in the environment module is as follows: ‘To what extent do you worry about the following global environmental issues?’ The response categories and coded scores are ‘Very much ( = 4)’, ‘To a certain extent ( = 3)’, ‘Not so much ( = 2)’, and ‘Not at all ( = 1)’ along with ‘Don't know’ and ‘Refused’ which are treated as missing values. This question was asked for the following eight items: ‘Depletion of the Ozone layer (Ozone layer is in the Earth's atmosphere and it absorbs biologically harmful ultraviolet (UV) radiation from the Sun)’, ‘Acid rain’, ‘Climate change’, ‘Deforestation’, ‘Loss of biodiversity (extinction of species, loss of wildlife and habitats)’, ‘Marine pollution’, ‘Nuclear waste disposal’, and ‘Usage of chemicals and pesticides’. Similarly, the four-point index labeled Global was constructed by averaging the answers to these eight question items with scores ranging from 1 (low) to 4 (high). The average of this variable is 3.2 with the standard deviation of 0.6 as reported in Appendix B.
Whether the hypotheses are supported or not is judged by the signs of estimated coefficients of the three independent variables, Neighbor/Local, National, and Global in the regression equations. For example, as to the first model of which the dependent variable is Local government, Hypothesis 1 is thought of as supported when the coefficient of Neighbor/Local is estimated to be positive. As to the second model, Hypothesis 5 is considered to be supported when the sign of the coefficient of Neighbor/Local is estimated to be negative and the sign on the coefficient of Global is estimated to be positive. Hypothesis 3 and 4 are tested by the estimation results concerning the variable Global.
Control variables added to the regression equations include QOL, Public spending, Female, Married, Female ×Married, Age, Education, Household income, Years of living, No religion, English ability, and Urban. These variables are constructed from the survey responses to the questions asked in the ASEAN-Barometer Survey. In addition to these individual-level variables, the four society-level variables are used in the first and second models in which multi-level regressions are fitted. They are CO2 emissions growth per capita, GDP per capita, Literacy rate, and Deaths due to pollution. These data are taken from sources other than the ASEAN-Barometer Survey.
The ways these variables are coded are explained in the following paragraphs. Variable QOL is the survey responses to the following question: ‘How would you rate your quality of life in the last four weeks?’ The five response categories and coded scores are ‘Very poor ( = 1)’, ‘Poor ( = 2)’, ‘Neither poor nor good ( = 3)’, ‘Good ( = 4)’, and ‘Very good ( = 5)’ along with ‘Don't know’ and ‘Refused’ which are treated as missing values.
Variable Public spending is the survey responses to the following question. The exact wording and coded scores are as follows: ‘Listed below are various areas of government spending. Please indicate whether you would like to see more or less government spending in each area, by choosing one answer from “Spend much less ( = 1)”, “Spend less ( = 2)”, “Spend the same as now ( = 3)”, “Spend more ( = 4)”, and “Spend much more ( = 5)”. Please bear in mind that more spending may require a tax increase.’ ‘Don't know’ and ‘Refused’ for this question are treated as missing values.
Variable Female is coded as 1 if the respondent is female and 0 if male. Variable Married takes on the value of 1 if the respondent is married, including de facto marriage, and 0 otherwise. Female ×Married is the interaction term of the two variables which corresponds to being a wife. Variable Age is the numerical answer to the question: ‘What is your age?’ Education is the educational attainment of the respondents and grouped as low ( = 1), middle ( = 2), and high ( = 3). If the respondent replied with ‘No formal education’ or ‘Elementary school/junior high school/middle school’, the variable is coded as 1 (low). If the answer is ‘High school’, it is coded as 2 (middle). If the answer is either ‘Professional school/technical school’ or ‘University/graduate school’, the variable is code as 3 (high). ‘Don't know’ and ‘Refused’ for this question are treated as missing values.
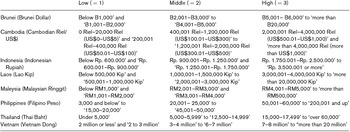
Variable Household income is the answer to the question: ‘What was the total gross monthly income of your household last month?’ This variable is also grouped as low ( = 1), middle ( = 2), and high ( = 3). Since the response categories are different from country to country, the details of coding are shown in Appendix A.
Years of living is the numeric answer to the question: ‘For how long have you lived in your current residence?’ The question asked ‘year(s)’, ‘month(s)’, and ‘week(s)’, but I focus only on the answer of ‘year(s)’.
No religion takes on the value of 1 if the respondent does not belong to any religion and 0 if the respondent belongs to any particular religion. The wording is ‘Do you regard yourself as belonging to any particular religion?’ The response categories include ‘Christianity (Catholic)’, Christianity (non-Catholic)’, ‘Islam (Sunni)’, ‘Islam (Shiah)’, ‘Hinduism’, ‘Buddhism (Mahayana)’, ‘Buddhism (Theravada)’, ‘Confucian’, ‘Judaism’, ‘Sikhism’, ‘Taoism’, ‘Shintoism’, ‘Other’, and ‘None’ along with ‘Don't know’ and ‘Refused’. This variable is coded as 1 if the respondent chose ‘None’ and 0 otherwise. ‘Don't know’ and ‘Refused’ for this question are treated as missing values.
Variable English ability is the answer to the question: ‘How well do you speak English?’ The four response categories and coded scores are ‘Not at all ( = 1)’, ‘Very little ( = 2)’, ‘I can speak it well enough to get by in daily life ( = 3)’, and ‘I can speak English fluently ( = 4)’ along with ‘Don't know’ and ‘Refused’. ‘Don't know’ and ‘Refused’ for this question are treated as missing values.
Urban is a dichotomous variable which takes the value of 1 if the respondent lives in an urban area and 0 if rural. In the third model, we also added the variables District or Region to individual country regressions. Refer to the regression results.
Besides these individual-level variables, the society-level variables are added to multi-level regression analyses. Variable CO2 emissions growth per capita is retrieved from the website of the World Bank. Its growth is calculated from the 2006 to 2007 data. For GDP per capita, I refer to the 2006 data in World Economic Outlook Database issued by the IMF. Literacy rate is retrieved from World Factbook prepared by the CIA (2014). For Deaths due to pollution, I refer to Human Development Report issued by the UNDP. Descriptive statistics of the variables of multi-level regression analyses in the first and second models are reported in Appendix B.
Since these aforementioned individual-level and society-level variables are not standardized, the differences in cultural and demographic characteristics between countries could affect the results explained in the next section. To minimize these confounding effects, however, the ASEAN-Barometer Survey attempts to standardize questionnaire as follows: The questionnaire is designed in English first. Then, it is translated into local languages of the societies where the surveys are conducted. The local language questionnaires are then back translated into English by local experts.
Results
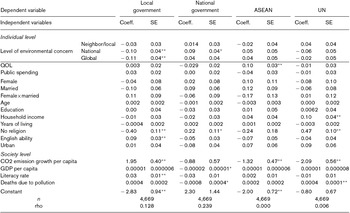
Table 2 shows the results of the first model. Firstly, we look at the estimated coefficients of the three variables measuring perceptions about the level of environmental issues, Neighbor/Local, National, and Global in the regression of Local government. The estimated coefficients of National and Global are both negative and statistically significant at the 1% significance level, although the variable Neighbor/Local is not statistically significant. These results would suggest that, holding everything else constant, the probability that the respondent thinks that the policies on protection of the environment should be decided by the state and local governments is lower when he or she has higher consciousness toward the national or global level of environmental issues. These results do not contradict the hypotheses.
Multi-level probit regression

Notes: **1% significance level; *5% significance level.
: The sample does not include Myanmar and Singapore observations.
Among the control variables of which coefficients are statistically significant, the coefficient of No religion is estimated to be negative and that of English ability is estimated to be positive. Those who do not belong to any particular religion are less likely to think that the policy of environmental protection should be decided by the state and local governments, while those who think they have a higher English speaking ability are more likely to think that environment policy should be decided by the state and local governments, controlling for other factors. Among the society-level variables, the coefficients of CO2 emissions growth per capita and Literacy rate are positive and statistically significant. The people of the countries with higher CO2 emissions growth per capita or higher literacy rate are more likely to think that environmental policies should be decided by the local governments.
Secondly, we look at the results of the regression of National government. Among the three variables of interest, Neighbor/Local, National, and Global, the estimated coefficient of National is positive and statistically significant at the 5% level. It would follow that the higher the consciousness people have about the national environment issues, the higher the probability that they think that the policy to protect the environment should be decided by the national government, holding other variables constant. This result does support the second hypothesis.
Among the individual-level control variables, the estimated coefficient of No religion is positive and statistically significant. Those who do not belong to any particular religion are more likely to think that the policy of environmental protection should be decided by the national governments, controlling for other variables. Among the society-level variables, the coefficients of GDP per capita and Deaths due to pollution are negative and statistically significant. The people of the countries with higher (lower) GDP per capita are less (more) likely to think that environmental policies should be decided by the national government, holding everything else constant. This result may contradict our intuition since it would seem more plausible that people living in a nation with higher GDP would think that environmental policies should be decided by their national government. The results also suggest that the people of the countries with larger amount of deaths due to pollution are less likely to think that environmental policies should be decided by the national government.
Thirdly, let's look at the estimated coefficients of the three variables measuring perceptions about the level of the environmental issues, Neighbor/Local, National, and Global in the regression of ASEAN. None of the estimated coefficients of these three independent variables is statistically significant. This might be because the estimation model lacks an independent variable which measures consciousness and perceptions about the environmental issues at the regional level which is higher than the national level but lower than the global level. We can also notice that the value of rho, the measure of goodness of fit of the regression equation, is very low and nearly zero. (A value does not appear until 13 decimal places.) Among the control variables of this regression equation, the estimated coefficient of QOL is positive and statistically significant, which would indicate that those who feel their quality of life is higher are more likely to think that the policies to protect the environment should be decided by regional organizations such as ASEAN or APEC. Among the society-level variables, the coefficient of CO2 emissions growth per capita is negative and statistically significant. The people of the countries with a higher growth rate of CO2 emissions per capita are less likely to think that environmental policies should be decided by the national government, controlling for other factors.
Fourthly, as to the estimated coefficients of the three variables measuring perceptions about the level of the environmental issues, Neighbor/Local, National, and Global in the regression of UN, none of them is statistically significant. It is unknown whether our hypotheses are supported or not from this result. We also notice that the value of rho, the measure of goodness of fit of the regression equation, is very low at 0.006. Among the individual-level control variables of this regression equation, the estimated coefficients of Household income and No religion are positive and statistically significant. When household income is higher, the probability that people think that the policies to protect the environment should be decided by the United Nations is higher. Those who do not belong to any particular religion are also more likely to think that environmental policies should be decided by the United Nations. Among the society-level variables, the coefficient of CO2 emissions growth per capita is negative and statistically significant. The people of the countries with a higher growth rate of CO2 emissions per capita are less likely to think that environmental policies should be decided by the national government. On the other hand, the coefficient of Deaths due to pollution is estimated to be positive and statistically significant. The people of the countries with a larger number of deaths due to air or water pollution are more likely to think that environmental policies should be decided by the United Nations, holding everything else constant.
Finally, as to CO2 emissions growth per capita among the society-level variables, it would be noteworthy that the estimated coefficient is positive in the regression of Local government, while the estimated coefficient is negative in the regressions of ASEAN and UN. These results may indicate that the people living in the ASEAN countries prefer that the issue concerning CO2 emissions be decided by closer and lower level of governments.
In short, the estimated coefficients of the three variables of interest, Neighbor/Local, National, and Global, are statistically significant only in the regressions of Local government and National government. That is, our hypotheses are evaluated only in the relationship between local and national governments. But the aforementioned results do support our hypotheses. As the ASEAN people have higher consciousness towards national environmental issues, they are more likely to think that policies on the protection of the environment should be decided by their national governments. In addition, when the ASEAN people have higher consciousness towards the national or global level of environmental issues, then they are less likely to consider that the policies on the protection of the environment should be decided by their state and local governments, holding everything else constant.
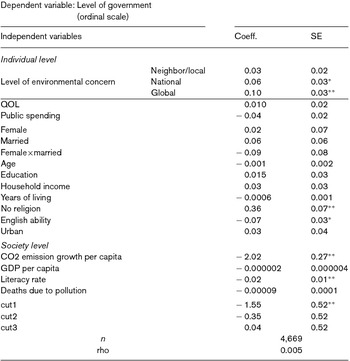
Table 3 reports the results of the second model in which the dependent variable is converted to an ordinal-scale variable which equals to 1 if the respondent chose ‘State and local governments’, 2 if ‘National governments’ was chosen, 3 if ‘Regional organizations (such as ASEAN or APEC)’ was chosen, and 4 if ‘United Nations’ was chosen. Among the three independent variables of interest about environmental consciousness at neighborhood, national, and global levels, the estimated coefficient of National is positive and statistically significant at the 5% level of significance and the estimated coefficient of Global is positive and statistically significant at the 1% level. It would follow that those who have higher consciousness about the national or global level of environmental problems are more likely to think that environmental protection policies should be decided by higher levels of government, accounting for the influences of other factors. Since the values of the regression coefficient and the z value, which equals the value of the regression coefficient divided by its standard error, of Global are larger than those of National, the effect of Global is larger. These results would support Hypothesis 5.
Multi-level ordered probit regression

Notes: **1% significance level; *5% significance level.
: The sample does not include Myanmar and Singapore observations.
Among the control variables at the individual level, the coefficient of No religion is positive and statistically significant, and the coefficient of English ability is negative and statistically significant. The probability that those who do not belong to any particular religion think that environmental policies should be decided by a higher level of government is higher, while the probability that those who think they have better English speaking ability consider the policies should be decided by a higher level of government is lower. Among the society-level variables, the estimated coefficient of CO2 emissions growth per capita is negative and statistically significant at the 1% significance level, which is consistent with the results of the first model. The probability that the people of the ASEAN countries think that environmental protection policies should be decided by a higher level of government is lower as the growth rate of CO2 emissions in their countries is higher, holding everything else constant. That is, as the growth rate of CO2 emissions in their countries is higher, the people of the ASEAN countries are more likely to think that environmental policies should be decided by closer and lower level of governments, controlling for other factors. The coefficient of Literacy rate is estimated to be negative and statistically significant. The probability that the people think that the policies to protect the environment should be decided by a higher level of governments is lower, as the literacy rate in their countries is higher, holding other variables constant.
Tables 4 to 12 report the results of each country analysis in the third model.
Ordered probit regression (Brunei)

Notes: **1% significance level; *5% significance level.
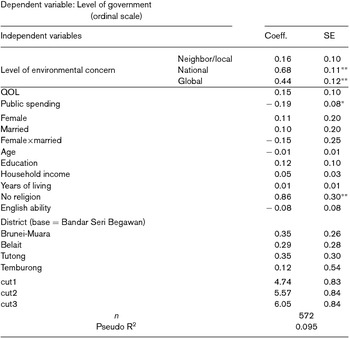
The results of analysis of the Brunei survey in Table 4 show that, among the three environmental consciousness levels, the coefficients of the variables National and Global are estimated to be positive and statistically significant. Controlling for the influences of other factors, the Bruneian people with higher consciousness about the national and global environment are more likely to think that environmental policies should be decided by the higher level of governments. These results support the fifth hypothesis. The result reflects the features that the Brunei people are economically affluent and may have a sense of internationalism. Its GDP per capita on a purchasing power parity basis is ranked 11th in 229 countries/societies (CIA's The World Factbook). Brunei is the former British protectorate and officially placed among a family of Asian nations, and Bruneians have high English proficiency in ten ASEAN countries, only second to Singapore whose official language is English (Sulaiman and Hotta, Reference Sulaiman, Hotta, Inoguchi, Tanaka, Sonoda and Dadavaev2006). The results do not contradict the findings of the AsiaBarometer 2004 Brunei Survey, which shows that the trust level in regional organizations such as ASEAN is the highest among the surveyed countries. As to the control variables of which the coefficient is statistically significant, Public spending affects the dependent variable negatively, while No religion affects positively.
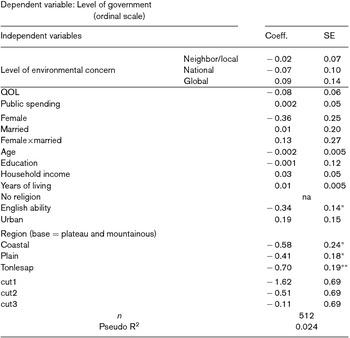
Table 5 shows the results of Cambodia. None of the three variables measuring consciousness toward environmental issues at the three levels has coefficients that are statistically significant. This result may reflect Cambodian past experiences of foreign rule, tyrannical governments, and one of the greatest human tragedies of the 1970s, although Cambodia is now governed stably and peacefully and emerges into a globalized world as symbolized by accession into the World Trade Organization in 2004 (Un, Reference Un, Inoguchi, Tanaka, Sonoda and Dadavaev2006). Among the control variables, the estimated coefficient of English ability is positive and statistically significant. All of the dummy variables of the region have a coefficient which is estimated to be negative and statistically significant. Furthermore, the value of the coefficient for Tonlesap is the largest in absolute value among the three (–0.7), which is followed by Plain and Coastal in this order. The Cambodian people living in the plateau and mountainous region are the most likely to think that environmental policies should be decided by the higher level of governments, who are followed by those who live in a coastal region of Cambodia, in a plain region, and around the Tonle Sap lake in this order.
Ordered probit regression (Cambodia)

Notes: **1% significance level; *5% significance level.
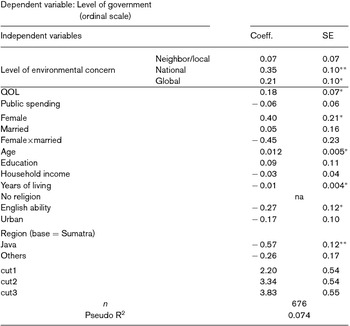
Table 6 shows the results of the Indonesia survey. Among environmental consciousness level variables, the coefficients of National and Global are estimated to be positive and statistically significant. Controlling for other factors, the Indonesian people with higher consciousness about the environmental issues at national and global levels are more likely to think that environmental policies should be decided by the higher level of governments.
Ordered probit regression (Indonesia)

Notes: **1% significance level; *5% significance level.
The results support Hypothesis 5. Indonesia experienced ‘a change in the pattern of governance from a centralized to decentralized government’ and is influenced by international agencies and multinational corporations more than before the Asian economic crisis in 1997 (Pratikno and Erawan, 2006). Indonesians may have a sense of division in roles between different levels of government.
As to the control variables of which the associated coefficient is statistically significant, the variables QOL, Female, and Age affect the dependent variable positively, while Years of living and English ability affect negatively. The estimated coefficient of the regional dummy variable Java is negative and statistically significant. Controlling for the influences of other factors, the Javanese people are less likely to think that environmental policies should be decided by higher levels of government than the Sumatran residents.
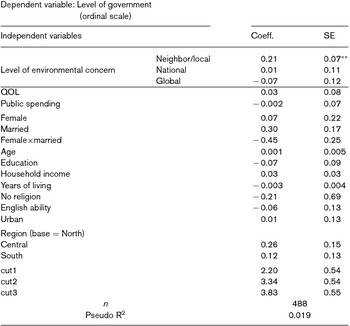
Table 7 reports the results of Laos. Among the three variables measuring consciousness toward environmental issues at the three levels, the coefficient of Neighbor/Local is statistically significant and estimated to be positive. The people of Laos who have more consciousness toward neighbor or local environmental issues are more likely to consider that environmental policies should be decided by higher levels of government. This result would not support the fifth hypothesis and seems a puzzle. The AsiaBarometer Survey, which precedes the ASEAN-Barometer Survey, reveals as one of its findings that feelings of happiness and satisfaction with public safety are negatively associated among the people of Laos (Inoguchi and Fujii, 2013). The people of Laos who have less consciousness toward neighborhood matters may have higher expectations about the roles of local governments. None of the control variables has the statistically significant coefficient.
Ordered probit regression (Laos)

Notes: **1% significance level; *5% significance level.
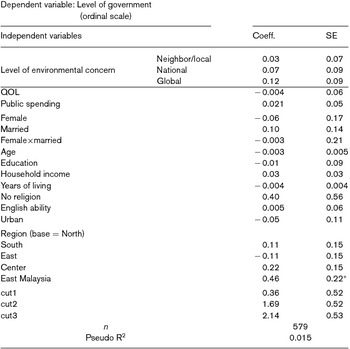
Table 8 reports the results of the Malaysia survey. None of the three variables measuring consciousness toward environmental issues at the three levels has the statistically significant coefficient. The results may reflect that the Malayan people do not put high trust in regional organizations such as ASEAN and the United Nations. The ASEAN-Barometer Survey also reveals that about 49% and 46% of the Malayan respondents trust in regional organizations such as ASEAN and the United Nations, while the average scores of the ten ASEAN countries are 56% and 58%.Footnote 1 However, the coefficient of the regional dummy variable East Malaysia is estimated to be positive and statistically significant. It would follow that, controlling for other factors, the people in East Malaysia are more likely to think that environmental policies should be decided by higher levels of government than the people living in the northern part of Peninsular Malaysia.
Ordered probit regression (Malaysia)

Notes: **1% significance level; *5% significance level.
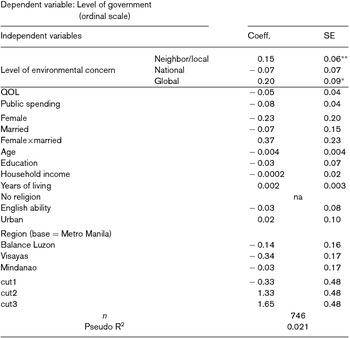
Table 9 shows the results of the Philippines. Among the three environmental consciousness levels, the estimated coefficients of Neighbor/Local and Global are estimated to be positive and statistically significant. The Philippine people who have higher consciousness about environmental problems at neighbor/local level or global level are more likely to think that the policies to protect the environment should be decided by higher levels of government, holding other variables constant. As far as the variable Global is concerned, the results would support the fifth hypothesis. The results go along with the findings of the ASEAN-Barometer Survey. The Philippine respondents trust more their local government (59%), regional organizations such as ASEAN (61%), and the United Nations (67%), while they trust less the national government (45%).Footnote 2 None of the control variables affects statistically significantly the dependent variable.
Ordered probit regression (Philippines)

Notes: **1% significance level; *5% significance level.
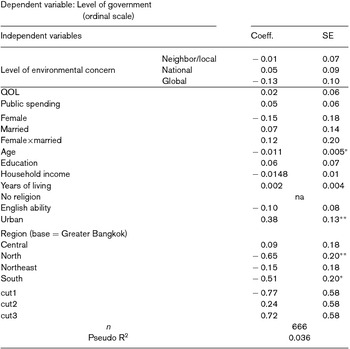
Table 10 shows the results of the Thailand survey. None of the three variables of environmental consciousness has a coefficient that is statistically significant. The results may reflect that the Thai people generally have a low trust level in institutions. The ASEAN-Barometer Survey shows that the percentages of those who trust local governments, the national government, regional organizations such as ASEAN, and the United Nations are all the lowest in ASEAN countries.Footnote 3 As to the control variables of which the coefficient is statistically significant, the coefficient of Age is estimated to be negative, while the coefficient of Urban is estimated to be positive. The older Thai people tend to think that the policies to protect the environment should be decided by lower levels of government, while urban residents in Thailand tend to think that the policies should be decided by higher levels of government, controlling for other factors.
Ordered probit regression (Thailand)

Notes: **1% significance level; *5% significance level.
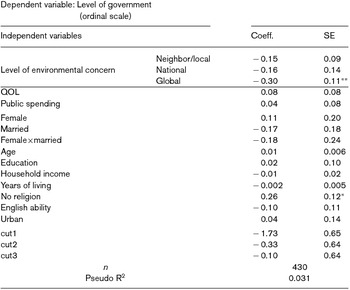
Table 11 reports the results of Vietnam. Among the three variables measuring consciousness toward environmental issues at the three levels, the coefficient of Global is statistically significant and estimated to be negative. The people living in Vietnam who have higher consciousness toward the global environment are less likely to prefer that the policies to protect the environment be decided by higher levels of government, controlling for other factors. The results would not support the fourth or fifth hypothesis. The ASEAN-Barometer Survey shows that about 68% of the Vietnamese respondents trust in regional organizations such as ASEAN and the United Nations, which are the highest score in ASEAN countries.Footnote 4 On the other hand, the Vietnamese identified environmental pollution (air, water, soil, and noise pollution) as the most serious compared to other surveyed countries in the AsiaBarometer Survey of 2004 (Hong, Do Manh, Reference Hong, Inoguchi, Tanaka, Sonoda and Dadabaev2006).Footnote 5 The roles of government and consciousness about environmental issues may be determined independently by the Vietnamese people. Among the control variables, the estimated coefficient of No religion is positive and statistically significant.
Ordered probit regression (Vietnam)

Notes: **1% significance level; *5% significance level.
Concluding remarks
This study explored perceptions and beliefs held by the people living in the ASEAN countries about which level of government should decide on environment protection policies. The relationships between the levels of government they prefer to decide the policies and the levels of environmental consciousness at the three levels were examined. The set of questions addressed were whether those who have higher consciousness toward environmental issues at neighbor or local level prefer local governments to decide the environment policies, whether those who have more consciousness about environmental issues at national level prefer the national government to decide the policies, and whether those who have higher consciousness toward environmental problems at global level prefer higher levels of government such as the United Nations to decide the policies. I address these questions by fitting several probit regressions to survey data collected recently in the ASEAN countries.
The findings support the hypotheses tested using the multi-level regression of ordinal-scale variables that take on the values of ‘State and local governments’, ‘National governments’, ‘Regional organizations such as ASEAN or APEC’, and ‘United Nations’ as the dependent variable.
As to the multi-level regressions in which the dependent variables are dichotomous, I found the results support the hypotheses or do not contradict the hypotheses in the regressions in which the dependent variable is ‘State and local governments’, ‘National governments’, or ‘United Nations’.
Among the control variables of which the coefficient was statistically significant, no religion, the levels of life quality, or English speaking ability affects the dependent variable positively. Demographic profiles such as gender and age turned out to be not important factors in country analyses.
As to the society-level variables, CO2 emissions growth per capita affect statistically significantly the dependent variable. The higher the growth rate of CO2 emissions in their countries, the more likely the people of the ASEAN countries are to think that environmental policies should be decided by lower level of governments close to them.
In the country analyses, the results support the hypotheses in Brunei, Indonesia, and the Philippines. The region where people live was also an important factor in Cambodia, Indonesia, Malaysia, and Thailand.
About the author
Seiji FUJII is Full-time Lecturer at the Department of International Studies and Regional Development of the University of Niigata Prefecture. His published works include: The Quality of Life in Asia: A Comparison of Quality of Life in Asia, Volume 1 in Quality of Life in Asia, Dordrecht: Springer, 2013 (co-authored with Takashi Inoguchi); ‘The Quality of Life in Japan’ (with Takashi Inoguchi), Social Indicators Research, 92(2) (2009): 227–62; ‘Political Shirking- Proposition 13 vs. Proposition 8’, Japanese Journal of Political Science, 10(2) (2009): 213–37; and ‘The AsiaBarometer: Its aim, Its scope and Its development’ (with Takashi Inoguchi), in Møller, Valerie, Denis Huschka, and Alex C. Michalos (eds.), Barometers of Quality of Life Around the Globe: How Are We Doing?, Volume 33 in Social Indicators Research Book Series, Dordrecht: Springer, 2008, pp. 187–232. Dr Fujii received his Ph.D. in Economics from the University of California at Irvine in 2006.
Coding of household income

Descriptive statistics in multi-level regressions