


Introduction
Riebeckite is a relatively common C2/m sodium amphibole with ideal composition Na2 ${\rm Fe}_{\rm 3}^{{\rm 2 +}} {\rm Fe}_{\rm 2}^{{\rm 3 +}} $ Si8O22(OH)2, and thus is the ferro-ferri- counterpart of glaucophane. Typically, riebeckite is found in peralkaline acid igneous rocks, high-grade schists and meta-ironstones (Deer et al., Reference Deer, Howie and Zussman1997). The crystal structure of riebeckite was determined by Hawthorne (Reference Hawthorne1978) on a F-rich sample from a granitic pegmatite in the Pikes Peak area of Colorado, USA. The specimen was also Li-bearing, a feature that was later recognized to be common in some sodium amphiboles with a significant Fe content and A-site occupancy (Hawthorne et al., Reference Hawthorne, Ungaretti, Oberti, Bottazzi and Czamanske1993, Reference Hawthorne, Ungaretti, Oberti, Cannillo and Smelik1994). The synthesis of riebeckite and magnesio-riebeckite was reported by Ernst (Reference Ernst1962), who found that the upper stability limit of riebeckite is 400°C lower than that of magnesio-riebeckite; F substitution for OH was found to increase the thermal stability of the amphibole, in agreement with the occurrence of F-rich riebeckite at magmatic conditions (Ernst, Reference Ernst1968). The asbestiform variety of riebeckite is known as ‘crocidolite’, or ‘blue asbestos’, and has been considered for decades an important industrial mineral because of its properties, including mechanical strength and flexibility, coupled to high chemical, thermal and mechanical durability (Zoltai, Reference Zoltai and Veblen1981). For these reasons, ‘crocidolite’ has been used in a large variety of technological applications. However it was later recognized, as with other asbestos minerals, as one of the most hazardous solid environmental pollutants (e.g. Gunter et al., Reference Gunter, Belluso, Mottana, Hawthorne, Oberti, Della Ventura and Mottana2007), and banned from the market in 1973 in the USA (https://www.epa.gov/asbestos/us-federal-bans-asbestos).
Despite its importance in both petrology and environmental mineralogy, crystal-chemical studies on riebeckite are few: for example, complete reference data for well-characterized samples are not found in the literature. In this paper, we present for the first time a complete characterization of a near end-member riebeckite using a multi-technique approach. The sample studied was purchased from a mineral dealer. The host rock is an alkali pegmatite from Mt. Malosa, Zomba District, Malawi, and consists of centimetre-sized orthoclase with large (up to several cm long) amphibole and aegirine crystals. Associated minerals include rare-earth-element- and boron-rich minerals (e.g. Guastoni et al., Reference Guastoni, Nestola and Giaretta2009, Reference Guastoni, Kondo and Nestola2010). Due to the availability of many large single crystals, we were able to do a complete study of the sample, including micro-chemistry (EMPA and LA-ICP-MS), X-ray diffraction, Mössbauer spectroscopy, and vibrational spectroscopies performed on both single crystals (FTIR and Raman) and powders (FTIR).
Experimental methods
Single-crystal structure REFinement (SREF)
X-ray diffraction (XRD) data on a crystal 40 µm × 40 µm × 100 µm in size were collected at the University of Manitoba, Department of Geological Sciences (UM-DGS), using a Bruker D8 three-circle diffractometer equipped with a rotating-anode generator, multilayer optics, an APEX-II CCD detector and working with MoKα radiation. A total of 16,415 intensities was collected up to 2θ = 60° using 2–4 s per frame (taken at steps of 0.2°) with a crystal-to-detector distance of 5 cm. Empirical absorption corrections (SADABS, Krause et al., Reference Krause, Herbst-Irmer, Sheldrick and Stalke2015) were applied, and multiple reflections were merged, resulting in 5346 reflections, corresponding to 1386 unique reflections in the C2/m space group (R int = 1.2%). Unit-cell dimensions were obtained by least-squares refinement of the positions of 3950 reflections with I > 10σI in the same θ range and are reported in Table 1. The structure was refined with the program SHELXTL version 6.14 (Sheldrick, Reference Sheldrick2015) to an R index of 1.8%. All atoms but H were refined anisotropically using neutral-scattering factors. Atom coordinates and displacement parameters are reported in Tables 2 and 3, and selected interatomic distances are reported in Table 4. Detailed crystallographic information has been deposited as a cif with the Principal Editor of Mineralogical Magazine and is available as Supplementary material (see below).
Unit-cell dimensions and crystallographic details for riebeckite from Malawi.

*weight = 1/[σ2( ${\rm F}_{\rm o}^2 $) + (0.0298*P)2 + 0.93*P], where P = (max (
 ${\rm F}_{\rm o}^2 $, 0) + 2*
 ${\rm F}_{\rm c}^2 $)/3.
Atom coordinates, displacement parameters (Å2), and refined site-scattering values (ss, in epfu) for riebeckite from Malawi.

epfu – electrons per formula unit.
Anisotropic displacement parameters for riebeckite from Malawi.

Selected interatomic distances (Å) angles (°) and polyhedral distortion for riebeckite from Malawi.

OAV and TAV = octahedral and tetrahedral angular variance (°^2); OQE and TQE = octahedral and tetrahedral quadratic elongation (dimensionless); Robinson et al. (Reference Robinson, Gibbs and Ribbe1971).
Microchemical analysis
The crystal used for XRD analysis was embedded in epoxy resin and polished for EMPA. WDS analyses were done using a Cameca SX-100 electron microprobe at UM-DGS; operating conditions were: 15 kV accelerating voltage, 20 nA beam current and 1 µm beam size. The standards used are (all Kα lines): Na: albite; Si and Ca: diopside; F: fluoro-riebeckite; Mg: forsterite; Al: andalusite; K: orthoclase; Ti: titanite; Fe: fayalite; Mn: spessartine; Cl: tugtupite; V: VP2O7; Cr: chromite; and Zn: gahnite. Seventeen analytical points were measured on the sample.
The presence of Li was detected and quantified by Laser Ablation Induced Coupled Plasma Mass Spectroscopy (LA-ICP-MS) at UM-DGS on the same mount previously used for EMPA. A Merchantek New Wave UP-213 laser ablation device was used with a Nd:YAG source, wavelength = 213 nm, a 4 ns pulse width, a repetition rate of 10 Hz, a flat top beam, a 3–5 J/cm2 fluence, a beam size of 15–30 µm, a spot ablation mode, an ablation and a background time of 30 s. A Thermo Finnigan Element2 sector field ICP-MS was used with a plasma power of 1386 W, 15.8 l/min of cool gas, 0.86 l/min of auxiliary gas, 0.71 l/min of sample gas, 0.38 l/min of ablation carrier gas and a ThO/Th of 0.15%.
The analytical protocol consisted of a 10% mass window, 10 ms of sample time, a sample/peak of 10, an integration window of 10%, an EScan scanning type and an average integration type. Data reduction was done with the Iolite 2.212 software (Paton, Reference Paton, Hellstrom, Paul, Woodhead and Hergt2011), using a NIST SRM 610 standard reference material and SiO2 as the internal standard.
Mössbauer spectroscopy
The Mössbauer spectrum was collected using a 57Co(Rh) point source at UM-DGS. The sample was finely ground in acetone to avoid oxidation and then mixed with sugar. The powder was loaded into a Pb ring (with a 2 mm inner diameter) and covered with tape on both sides. Assuming a recoilless fraction of 0.7, the amount of sample corresponds to an absorber thickness of ~4 mg Fe/cm2. The spectrometer was calibrated against α-Fe. Data were evaluated with the program RECOIL (Rancourt and Ping Reference Rancourt and Ping1991; Rancourt et al., Reference Rancourt, McDonald, Lalonde and Ping1993; Rancourt et al. Reference Rancourt, Ping, Boukili and Robert1996) using a classical full static Hamiltonian approach with Lorentzian-shaped doublets.
Fourier-transform infrared (FTIR) and Raman spectroscopies
Powder FTIR data were collected using a Nicolet iS50 spectrometer equipped with a KBr beam splitter and a DLATGS detector at UniRomaTre. A crystal fragment was finely ground, and two KBr pellets were prepared, one with a 5/150 mg (sample/KBr) for the OH-stretching region, and a second with 1/150 mg for the lower frequency region; digitized data were collected at a nominal resolution of 4 cm–1. Single-crystal spectra were collected (at INFN-LNF, Frascati) using a Bruker Hyperion 3000 microscope equipped with a N2-cooled MCT detector. The microscope was attached to a Vertex V70 optical bench, equipped with a KBr broadband beamsplitter and a Globar IR source. Nominal resolution was 4 cm–1 and 256 scans were accumulated for both spectrum and background. Samples were prepared as doubly polished sections.
Raman scattering data were acquired on cleavage sections using a Horiba Jobin-Yvon T64000 triple-monochromator spectrometer equipped with an Olympus BX41 confocal microscope and 50× objective. Data were collected in back-scattering geometry with a spectral resolution of 2 cm–1. Two laser lines (λ = 514.532 and 488.0 nm) were used to verify the absence of photoluminescence peaks. Samples were oriented with the monoclinic c axis vertical under the microscope using their prismatic morphology. The laser beam was normal to the ( $\bar 1$10) crystallographic plane, as verified by XRD; both parallel-polarized and cross-polarized patterns were measured. The measured Raman spectra were corrected for the Bose-Einstein population to remove the trivial temperature dependence of the intensities: I reduced = I measured/(n(ω, T) + 1) with
 $n(\omega, T) = 1/(e^{{\hbar}\ {\rm \omega} /k_{\rm B}T} - 1)$, where k B is the Boltzmann constant, ω is the wavenumber (in cm–1), T is the temperature (K) and
 $\hbar = h/2{\rm \pi} $ is the reduced Planck constant (Kuzmany, Reference Kuzmany2009). The temperature reduced spectra were then fitted with pseudo-Voigt functions to determine the peak positions, widths and integrated intensities.
Results
EMP analysis and crystal-chemical formula
The microchemical composition obtained as an average of 17 analytical points is given in Table 5. The crystal-chemical formula was calculated on the basis of 24 (O, OH, F or Cl) (Hawthorne and Oberti, Reference Hawthorne, Oberti, Hawthorne, Oberti, Della Ventura and Mottana2007). The H2O content was calculated based on the assumption that O(3) = (OH,F) = 2 atoms per formula unit (apfu). The FeO to Fe2O3 ratio was first estimated on the basis of electroneutrality requirements given that the number of A-group cations, and hence the total number of cations, can also be validated by SREF. Because LA-ICP-MS analysis of Li (averaged over six point analyses) gave only 71(12) ppm, Li was not included in the calculations.
Microchemical analysis and unit formula of riebeckite from Malawi*.

*Unit formula calculated on the basis of 24 O and 2 (OH,F); 17 point analysis were merged, and the analytical ranges indicate that the crystal is quite homogeneous.
**Calculated based on 0.10 A-group cations.
Ferric vs. ferrous iron from Mössbauer spectroscopy
Initial evaluation of Mössbauer data was done using a model with one doublet for Fe3+ at M(2) and two doublets for Fe2+ at M(1) and M(3). The resulting amount of Fe3+ was 32.7% of total iron, corresponding to 1.5 apfu. However, the three-doublets model provided some inconsistencies with the formula reported in Table 5, e.g. a low Fe3+ content at M(2), a low Fe2+ content at M(1) (1.4 apfu) and a high Fe2+ content at M(3) (1.22 apfu). Thus a new model was chosen, which included Fe2+ at M(2) and an additional doublet corresponding to Fe2+ at M(4). This latter component was added because of a small but detectable shoulder at ~+1.7 mm/s, which could be resolved introducing a doublet with hyperfine parameters compatible with Fe2+ at M(4) (Hafner and Ghose, Reference Hafner and Ghose1971). The resulting hyperfine parameters (Table 6) are consistent with data from the literature (Ernst and Wai, Reference Ernst and Wai1970), with Fe2+ at the M(1) site having a quadrupole splitting of ~2.85 mm/s. Intermediate values of ~2.5 mm/s are found for Fe2+ at the M(3) site, whereas Fe2+ at the M(2) site has a quadrupole splitting of ~2.2 mm/s. The final model is shown in Fig. 1. The results of the fitting, including site proportions, are listed in Table 6.
Mössbauer spectrum of riebeckite from Malawi; spectral resolution based on the classical full static Hamiltonian approach with Lorentzian shaped doublets (see text for explanation).
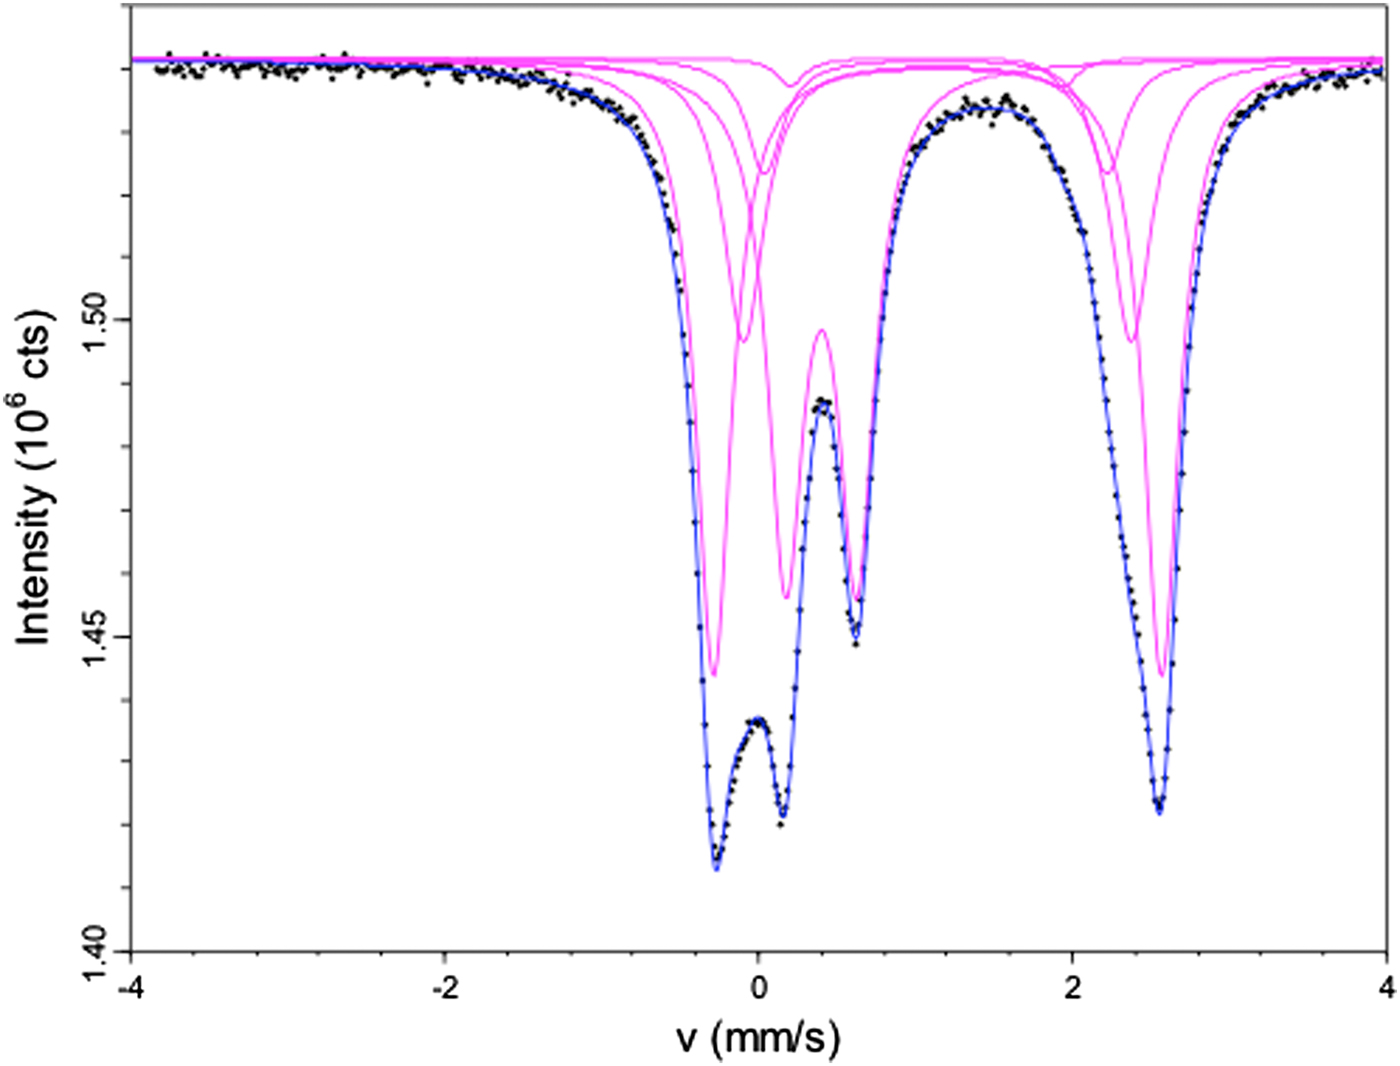
Mössbauer site distribution parameters and site properties for riebeckite from Malawi as derived from the spectral resolution given in Fig. 1.

IS – isomer shift; QS – quadropole splitting.
The relative amounts of total Fe2+ and Fe3+ calculated from Mössbauer are:  ${\rm Fe}_{{\rm tot}}^{{\rm 3 +}} $ = 0.32 and
 ${\rm Fe}_{{\rm tot}}^{{\rm 2 +}} $ = 0.68. These numbers are in good agreement with the estimated overall Fe3+ and Fe2+ contents obtained by EMPA + SREF analysis (0.36 and 0.64, respectively; Table 5).
Single-crystal structure refinement (SREF)
Site populations were derived by combining the refined site-scattering values and bond lengths obtained from SREF with the results from EMPA.
A site
EMPA and SREF results are consistent with a very low A-site occupancy in the riebeckite of this work. The A-site population by EMPA is 0.04 apfu K+ and 0.06 apfu Na+ (Table 6), and SREF shows that both cations are ordered at the A(m) site, which is shifted ~0.50 Å away from the centre of symmetry in the plane of the mirror. Comparison of the observed (SREF) and calculated (from the unit formula) site-scattering values (Table 7) shows that the discrepancy, although within the standard deviation, is reasonable because of the very low occupancy and possible cation disorder.
Final assigned site populations (apfu) and refined scattering values (epfu) for riebeckite from Malawi*.

*Obs = from SREF; calc = from the site populations.
T sites
According to the chemical analysis reported in Table 5, Si is 7.97 apfu, and hence T(1)Al3+ is 0.03 apfu, a result which is confirmed by the refined mean bond lengths at the T(1) and T(2) sites (Oberti et al., Reference Oberti, Hawthorne, Cannillo, Càmara, Hawthorne, Oberti, Della Ventura and Mottana2007).
M(1,2,3) sites
In amphiboles with no significant oxo component, C(Mg2+, Fe2+ and Mn2+) are distributed over the M(1,2,3) sites, whereas C(Fe3+, Al3+ and Ti4+) are ordered at the M(2) site (Hawthorne and Oberti, Reference Hawthorne, Oberti, Hawthorne, Oberti, Della Ventura and Mottana2007). Based on this assumption, and because the values of the refined site-scattering for the C cations are close to those calculated from the unit formula, the individual site populations of the M(1) site, which is likely to contain only two species (Mg and Fe), can be obtained from the refined site-scattering value: 26 (Fe2+) + 12 (2 – Fe2+) = 49.80 epfu, which gives M(1)Fe2+ = 1.84 apfu and M(1)Mg2+ = 0.16 apfu. A similar calculation can be done for the M(3) site, where the available Mn2+ is likely to order based on current knowledge of the amphibole crystal-chemistry. The proposed site populations can be further validated by comparing the refined <M(1,2,3)–O> distances with those calculated by using the <cation–O> distances optimized for (OH,F)-amphiboles (Hawthorne and Oberti, Reference Hawthorne, Oberti, Hawthorne, Oberti, Della Ventura and Mottana2007; Oberti et al., Reference Oberti, Hawthorne, Cannillo, Càmara, Hawthorne, Oberti, Della Ventura and Mottana2007). The results are reported in Table 7.
M(4) site
A comparison of the refined site-scattering value with that calculated from the unit formula of Table 7 provides a reasonable agreement.
Comparison with Mössbauer results
A combination of the above data allows us to propose the following crystal-chemical formula:
A(K0.06Na0.04)B(Na1.82Ca0.13 ${\rm Fe}_{{\rm 0}{\rm. 05}}^{{\rm 2 +}} $)C[M(1)(
 $ {\rm Fe}_{{\rm 1}{\rm. 84}}^{{\rm 2 +}} {\rm Mg}_{{\rm 0}{\rm. 16}}^{{\rm 2 +}} $)M(2)(
 $ {\rm Fe}_{{\rm 0}{\rm. 21}}^{{\rm 2 +}} {\rm Mg}_{{\rm 0}{\rm. 04}}^{{\rm 2 +}} {\rm Fe}_{{\rm 1}{\rm. 64}}^{{\rm 3 +}} {\rm Al}_{{\rm 0}{\rm. 10}}^{{\rm 3 +}} {\rm Ti}_{{\rm 0}{\rm. 01}}^{{\rm 4 +}} $) M(3)(
 ${\rm Fe}_{{\rm 0}{\rm. 89}}^{{\rm 2 +}} {\rm Mg}_{{\rm 0}{\rm. 05}}^{{\rm 2 +}} {\rm Mg}_{{\rm 0}{\rm. 06}}^{{\rm 2 +}} $)]T(Si7.97Al0.03)O22 W(OH1.9
 ${\rm F}_{0.10}^\ndash $);
hence, the amphibole studied in this work is close to end-member riebeckite, ideally, □Na2 ${\rm Fe}_{\rm 3}^{{\rm 2 +}} {\rm Fe}_{\rm 2}^{{\rm 3 +}} $ Si8O22(OH)2.
From Table 5 we can calculate the relative percentages (with respect to total Fe content) and compare them to those obtained by Mössbauer analysis: M(4)Fe2+ = 1.1 vs. 1.4(0.1)%, M(1)Fe2+ = 39.7 vs. 39.0(0.1)%, M(3)Fe2+ = 20.1 vs. 20.4(0.1)%, M(2)Fe2+ = 3.7 vs. 7.3(0.1)%, M(2)Fe3+ = 35.4 vs. 31.9(0.1)%. They are significantly different only at the M(2) site. However, a rigid use of the Mössbauer results, would have provided a lower amount of Fe3+ and an higher amount of Fe2+ at the M(2) site, which would have worsened the agreement between observed and calculated mean bond lengths and, more important, would have generated a unit formula which is not electroneutral (Δ = –0.14 charges).
Vibrational spectroscopies (FTIR, Raman)
The hydroxyl modes
The OH-stretching FTIR spectrum collected on the KBr pellet is compared in Fig. 2 with the FTIR spectrum collected on a thin (26 µm) randomly oriented single-crystal section. The patterns are very similar and consist of three sharp peaks centred at 3650, 3635 and 3618 cm–1 in the powder spectrum, while being slightly shifted (by ~1 cm–1) in the single-crystal spectrum. It is noteworthy that the powder spectrum has sharper peaks (full width at half maximum ≈7 cm–1) than the single-crystal spectrum (FWHM ≈10 cm–1). Asymmetry is observed in both spectra on the lower-wavenumber side of the main peak at 3618 cm–1.
FTIR OH-stretching spectra of riebeckite from Malawi, collected on (a) a KBr pellet and (b) on a 26 µm thick single crystal (unpolarized radiation).

The NIR spectrum collected on a thicker crystal fragment is shown in Fig. 3. FTIR data in the NIR region (4000–10000 cm–1) for amphiboles are rare in the literature. Attempts to use the NIR spectra of actinolites or asbestos materials for remote-sensing applications have been published by Mustard (Reference Mustard1992) and Lewis et al. (Reference Lewis, Chaffin, Gunter and Griffiths1996). According to these studies, bands due to the OH combination modes (stretching + libration) fall in the 4100–4500 cm–1 range, while the first overtone of the O–H stretching vibration is expected around 7100 cm–1. The NIR spectrum of riebeckite from Malawi shows several peaks in the combination region, notably a multicomponent broad band centred at 4140 cm–1 and a triplet of bands at 4343, 4293 and 4266 cm–1. The shape of these overlapping peaks is similar to that observed in the fundamental OH-stretching region; these three bands can, in fact, be assigned to the combination of the three stretching modes (νOH) observed in Fig. 2 with one OH libration (δOH) mode. Considering an average wavenumber ~4300 cm–1 for the combination triplet, and an average wavenumber ~3640 cm–1 for the fundamental mode(s), the wavenumber of the libration is ~650 cm–1, in line with the few available data for the δOH mode in amphiboles (Ishida et al., Reference Ishida, Jenkins and Hawthorne.2008). The splitting parameter between the three peaks is ~50 cm–1, i.e. much larger that the splitting parameter between the corresponding three peaks in the fundamental region (~18 cm–1; Fig. 2). The assignment of the broad absorption at 4140 cm–1 is not clear; it could be due either to a combination of the fundamental modes with a second OH libration at ~450 cm–1 or to an overtone of a T–O mode at ~1000 cm–1. The first overtone of the O–H stretching (2·νOH) occurs as a relatively intense and sharp peak at 7065 cm–1 and two minor peaks at 7100 and 7134 cm–1, respectively. The splitting parameters between these three components are constant and doubled with respect to those measured in the fundamental region (~34 cm–1 vs. ~17 cm–1). Also, the overtone wavenumbers are far lower than twice the frequency of the corresponding fundamentals. The same behaviour has been observed for a variety of asbestos amphiboles, and it is a result of the significant anharmonicity of the O–H bond vibration (Lewis et al., Reference Lewis, Chaffin, Gunter and Griffiths1996). Further interesting features in the NIR spectrum reported in Fig. 3 are the very broad absorption extending from 5000 to 10,000 cm–1, which peaks at ~8000 cm–1, and the presence of an additional peak ~8500 cm–1. Based on the literature data (i.e. Hawthorne, 1983; Mustard, Reference Mustard1992), this broad absorption should be related to electronic transitions and charge transfer between the Fe2+ and Fe3+ ions in the amphibole structure.
The NIR spectrum of riebeckite from Malawi.

The Raman spectra recorded on the same sample are given in Fig. 4. Two spectra were collected with the crystal aligned (by morphology) with the c axis vertical with respect to the microscope view, and the polarization of the incident light (E i) either parallel or perpendicular to the polarization of the scattered light (E s) (royal blue and red, respectively in Fig. 4). Two further spectra were collected with the same polarization scheme but after rotating the crystal by 90° about the laser-beam direction (blue and pink, respectively, in Fig. 4). It is evident that both crystal orientation and the different polarization scheme have a strong effect on the spectrum. In particular, the OH-stretching signal (right side of Fig. 4) is maximized at parallel polarization (E i || E s) and when E i ⊥ c, while the intensity vanishes for E i ⊥ E s. In any case, the E i || E s spectrum (royal blue in Fig. 4) is very similar to the FTIR spectrum, and consists of an intense peak at 3619 cm–1 and a weak peak at ~3640 cm–1. Both peaks are rather sharp (FWHM ≈ 4 cm–1) and have a symmetrical Lorentzian-type shape, thus indicating negligible chemical or structural disorder in the atomic environment of WOH in the areas probed.
Polarized Raman spectra of riebeckite from Malawi, measured in four different scattering geometries: cr designates the direction of the crystal prismatic axis, E i and E s denote the polarization of incident and scattered light. The peak positions are from spectral resolution. The band assignment is schematic and it is based on comparison with other amphiboles and other complex silicates (Apopei and Buzgar, Reference Apopei and Buzgar2010; Leissner et al., Reference Leissner, Schlüter, Horn and Mihailova2015; Gasharova et al., Reference Gasharova, Mihailova and Konstantinov1997).

The framework phonon region
The FTIR powder spectrum of the riebeckite studied in the low-frequency region (<1200 cm–1) is shown in Fig. 5, and can be compared with the Raman spectra in the same region of Fig. 4. Raman spectroscopy has been used extensively to study amphiboles in the region of the framework phonon modes (Lazarev, Reference Lazarev1972; Wang et al., Reference Wang, Dhamelincourt and Turrell1988a,Reference Wang, Dhamelincourt and Turrellb; Gillet et al., Reference Gillet, Reynard and Tequi1989; Della Ventura et al., Reference Della Ventura, Robert and Bény1991, Reference Della Ventura, Robert, Bény, Raudsepp and Hawthorne1993; Kloprogge et al., Reference Kloprogge, Case and Frost2001; Rinaudo et al., Reference Rinaudo, Belluso and Gastaldi2004, Reference Rinaudo, Cairo, Gastaldi, Gianfagna, Mazziotti Tagliani, Tosi and Conti2006; Fornero et al., Reference Fornero, Allegrina, Rinaudo, Mazziotti-Tagliani and Gianfagna2008, among others). A collection of spectra for a large set of compositions was given by Apopei and Buzgar (Reference Apopei and Buzgar2010). In contrast, FTIR data for the <1200 cm–1 region are relatively scarce; an analysis of IR spectra in this region was published by Andrut et al. (Reference Andrut, Gottschalk, Melzer and Najorka2000) for synthetic tremolite, Sr-substituted tremolite and richterite–tremolite solid solutions, and by Ishida et al. (Reference Ishida, Jenkins and Hawthorne.2008) for synthetic calcium amphiboles; data for natural samples of various compositions have been given by Ishida (Reference Ishida1989, Reference Ishida1990a,Reference Ishidab and Reference Ishida1998).
The FTIR powder spectrum of riebeckite from Malawi in the low-frequency region.

According to the literature, Si–O bond-stretching vibrations occur in the 950–1130 cm–1 region and give rise to strong IR absorption in the spectrum of riebeckite (Fig. 5). The Raman spectrum shows two relatively weak bands at 1086 and 1043 (Fig. 4), which probably arise from Si–O stretchings involving bridging O atoms (Obr, shared between two TO4), and a very intense peak (actually the most intense peak in the Raman pattern) at 972 cm–1 with an evident shoulder at 988 cm–1. The 972 cm–1 peak most probably originates from Si–O bond-stretching involving non-bridging (Onbr) oxygen atoms (Dowty, Reference Dowty1987). Amphiboles typically show their most intense Raman peak in the 680–650 cm–1 range, and the exact position of this peak has been proposed as a tool to identify the amphibole species, particularly when studying mineral fibres (e.g. Rinaudo et al., Reference Rinaudo, Belluso and Gastaldi2004, Reference Rinaudo, Cairo, Gastaldi, Gianfagna, Mazziotti Tagliani, Tosi and Conti2006). In contrast, riebeckite exhibits an intermediate parallel polarized Raman peak in this range, at 665 cm–1 (Fig. 4) which is commonly assigned to Si–O–Si bending, also called the SiO4-ring-breathing mode for silicates containing silicate rings, such as tourmaline, amphibole and layer silicates. Considering that all riebeckite spectra so far published (e.g. Apopei and Buzgar, Reference Apopei and Buzgar2010, Rinaudo et al., Reference Rinaudo, Belluso and Gastaldi2004) show their most intense peak around 970 cm–1, this type of pattern could possibly be used as a marker for this amphibole species. Furthermore, two parallel-polarized Raman peaks at 541 and 579 cm–1 even stronger than the peak at 665 cm–1 are observed for riebeckite. Such a feature is not common for amphiboles with predominantly divalent ions at the M(1,2,3) sites, but has been observed for pargasite (Leissner et al., Reference Leissner, Schlüter, Horn and Mihailova2015). The phonon energy of the Raman peaks at 541 and 579 cm–1 matches the range of O–Si–O and Si–O–Si bending in silicates, and their stronger intensity for riebeckite might be related to the occurrence of both Fe2+ and Fe3+ at the M(1,2,3) sites and their influence on the TO4 ring-modes. Further data are necessary to clarify this issue. The spectral range below 400 cm–1 should be dominated by MO6 modes, with an additional contribution from TO4 external modes and possible OH librations, following the general considerations for silicates (e.g. Lazarev, Reference Lazarev1972 and Dowty, Reference Dowty1987; see also the correlation tables in Kloprogge et al., Reference Kloprogge, Case and Frost2001 and Apopei and Buzgar, Reference Apopei and Buzgar2010). In this region, riebeckite shows a complex pattern, consisting of several peaks at 367, 332, 249, 165 and 146 cm–1, plus other minor features (Fig. 4). Most of these are intense for E i || E s, whereas the 107 cm–1 peak has its maximum intensity for E i ⊥ E s.
Cation ordering in riebeckite from the OH-stretching spectra
Following previous spectroscopic literature on amphiboles with two divalent cations substituting at the O–H coordinated M(1,3) sites (e.g. Strens, Reference Strens1966; Burns and Strens, Reference Burns and Strens1966; Della Ventura, Reference Della Ventura1992; Della Ventura et al., Reference Della Ventura, Robert and Hawthorne1996, Reference Della Ventura, Robert, Raudsepp, Hawthorne and Welch1997, Reference Della Ventura, Robert, Hawthorne, Raudsepp and Welch1998, Reference Della Ventura, Hawthorne, Robert, Delbove, Welch and Raudsepp1999, Reference Della Ventura, Redhammer, Iezzi, Hawthorne, Papin and Robert2005, Reference Della Ventura, Redhammer, Robert, Sergent, Iezzi and Cavallo2016; Hawthorne et al., Reference Hawthorne, Welch, Della Ventura, Liu, Robert and Jenkins2000; Iezzi et al., Reference Iezzi, Cámara, Della Ventura, Oberti, Pedrazzi and Robert2004, Reference Iezzi, Della Ventura, Hawthorne, Pedrazzi, Robert and Novembre2005, Hawthorne and Della Ventura, 2007), and considering the crystal-chemistry of the sample studied, the peaks at 3618, 3636 and 3650 cm–1 in the FTIR spectra (Fig. 2) can be assigned to Fe2+Fe2+Fe2+–OH–□–SiSi, MgFe2+Fe2+–OH–□–SiSi and MgMgFe2+–OH–□–SiSi local arrangements, respectively. As discussed in previous papers (Wang et al., Reference Wang, Dhamelincourt and Turrell1988a,Reference Wang, Dhamelincourt and Turrellb; Leissner et al., Reference Leissner, Schlüter, Horn and Mihailova2015; Della Ventura, Reference Della Ventura and Gualtieri2017) the same number of bands occurs in the OH-stretching region of the FTIR and Raman spectra of amphiboles, as is also the case for the riebeckite of this work. However, a comparison of Figs 2 and 4 shows that the corresponding peaks have very different relative intensities (Table 8). In the Raman spectrum, the 3618 cm–1 peak due to the Fe2+Fe2+Fe2+–OH configuration is by far the most intense, the 3636 cm–1 peak due to the MgFe2+Fe2+–OH configuration is very weak, and the peak at 3648 cm–1, due to the MgMgFe2+–OH configuration is absent.
Relative band (cm–1) intensities (in %) from vibrational spectra*.

*Results from Raman data are averaged over seven probed areas; uncertainties in the mean values are calculated from standard deviations.
A further notable observation is that in both FTIR and Raman spectra, no band involving occupied A-site configurations (see also Della Ventura et al., Reference Della Ventura, Hawthorne, Robert and Iezzi2003) can be detected, although EMPA and SREF indicate that 0.08 A cations are present. This fact can be explained only when associating the M(1)M(1)M(3) configurations involving an occupied A site to F occurring at the O(3) site. This association is compatible with the crystal-chemical formula. In other words, all vibrational data suggest complete short-range order between O(3)F and A(Na, K) in the amphibole studied. This conclusion is in agreement with SREF data. Ordering of A cations at the A(m) site in F-rich amphiboles is well known in amphiboles (Hawthorne et al., Reference Hawthorne, Oberti and Sardone1996a), and is explained by positive Coulombic interactions given that A(m) is closer to the O(3) site occupied by F. It is now confirmed to be effective at very low F content.
Strens (Reference Strens1966) and Burns and Strens (Reference Burns and Strens1966) showed that when two divalent cations occur at the OH-coordinated M(1) and M(3) octahedra, the OH-stretching spectrum consists of four bands that are related to the four possible cation arrangements at the M(1,3) sites. Accordingly, the site occupancies of the two divalent cations can be related to the observed relative intensities of the four bands in the OH-spectrum (Law, Reference Law and Strens1976, Della Ventura et al., Reference Della Ventura, Robert and Hawthorne1996, Hawthorne et al., Reference Hawthorne, Della Ventura and Robert.1996b, Della Ventura et al., Reference Della Ventura, Robert, Raudsepp, Hawthorne and Welch1997, Iezzi et al., Reference Iezzi, Della Ventura, Hawthorne, Pedrazzi, Robert and Novembre2005, Della Ventura et al., Reference Della Ventura, Redhammer, Iezzi, Hawthorne, Papin and Robert2005, Reference Della Ventura, Redhammer, Robert, Sergent, Iezzi and Cavallo2016) provided that there is no variation in the molar absorptivity among the local configurations (Skogby and Rossman, Reference Skogby and Rossman1991).
The spectra reported in Figs 2 and 4 were resolved using the Peakfit™ program by Jandel Scientific; for the single-crystal spectrum the background could be treated as linear, while for the powder spectrum a polynomial function was used to remove the broad absorption due to moisture in the pellet, which overlaps with the OH bands. We tried to minimize this effect by drying the mineral + KBr powder overnight at 110°C, but the broad absorption could not be significantly removed. All the bands were modelled as symmetric Gaussians (Della Ventura et al., Reference Della Ventura, Robert and Hawthorne1996); a minor additional peak at ~3610 cm–1 was necessary to take into account the asymmetry of the main band towards the lower frequency side. Because the corresponding Fe2+Fe2+Fe2+-OH Raman peak collected from μm-sized spatial areas does not show an asymmetric shape, this asymmetry cannot be considered as an intrinsic feature of riebeckite, e.g. caused by phonon-electron interactions due to the presence of mixed-valence elements. Instead, it may be related to substitutional disorder at the NN M(1,3) or NNN M(2) and M(4) sites (e.g. Iezzi et al., Reference Iezzi, Cámara, Della Ventura, Oberti, Pedrazzi and Robert2004, Reference Iezzi, Della Ventura, Hawthorne, Pedrazzi, Robert and Novembre2005) within the larger amount of sample probed by powder FTIR spectroscopy. In the first case, from the crystal-chemical formula given above, the only feasible candidate is Mn2+; in the second case the only candidate is Ca at M(4). The presence of Fe3+ at M(1,3), coupled with O2– at W might be also considered, however both the Mössbauer and SREF results rule out this hypothesis. The resulting relative integrated intensities, calculated by ignoring the 3610 cm–1 component, which has an area ~10% of the total absorption, are listed in Table 8, along with the relative Raman intensities arising from the OH stretching.
The data in Table 7 were treated using the equations of Burns and Strens (Reference Burns and Strens1966):
 $${\rm Mg}_{M{\rm (1,3)}}^{2 +} = {\rm 3I}_{\rm A}^{\rm o} + {\rm 2I}_{\rm B}^{\rm o} + {\rm I}_{\rm C}^{\rm o} $$
 $${\rm Fe}_{M{\rm (1,3)}}^{2 +} = {\rm I}_{\rm B}^{\rm o} + {\rm 2I}_{\rm C}^{\rm o} + {\rm 3I}_{\rm D}^{\rm o} $$
where  ${\rm I}_{\rm A}^{\rm o} $,+
 ${\rm I}_{\rm B}^{\rm o} $,
 ${\rm I}_{\rm C}^{\rm o} $ and
 ${\rm I}_{\rm D}^{\rm o} $, are the observed relative (integrated) intensities assigned respectively to the MgMgMg, MgMgFe2+, MgFe2+Fe2+ and Fe2+Fe2+Fe2+ local arrangements. The resulting Fe2+ contents at the M(1,3) sites from the FTIR (both powder and single-crystal) and Raman data are also listed in Table 8. Even considering the uncertainties associated with the estimation of the peak intensities, there are significant differences between the different methods; in fact FTIR powder spectroscopy yields a M(1,3)Fe2+ content very similar to the value obtained by combining SREF + EMPA (Table 7); the M(1,3)Fe2+ content obtained by single-crystal FTIR is significantly underestimated, due to the enhanced intensity of the C band with respect to the D band (Fig. 2 and Table 8). The different estimates may be partly due to probable inhomogeneities across the sample, that are averaged when analysing powders, and partly to problems related to the polarization of the O–H dipole, which are minimized in powders. The M(1,3)Fe2+ content obtained by single-crystal Raman spectroscopy is slightly higher than the value obtained by powder FTIR spectroscopy but, within uncertainties, it still matches the site occupancy determined by combined SREF, EMPA and Mössbauer spectroscopy. In addition, it is worth noting that M(1,3)Mn2+ in minor concentrations can hardly be distinguished from M(1,3)Fe2+ via the OH stretching mode (e.g. Reece et al., Reference Reece, Redfern, Welch, Henderson and McCammon2002; Oberti et al., Reference Oberti, Della Ventura, Boiocchi, Zanetti and Hawthorne2017), due to the very similar chemical characteristics of these elements (Leissner et al., Reference Leissner, Schlüter, Horn and Mihailova2015); hence the more reliable values that one can obtain only on the basis of relative Raman intensities of OH stretching is M(1,3)Mg and M(1,3)Fe* = M(1,3)(Fe2+ + Mn2+).
From the relative band intensities in the FTIR spectra, information related to Fe2+/Mg SRO can also be extracted (Della Ventura et al., Reference Della Ventura, Robert and Hawthorne1996). Assuming that Mg and Fe2+ are totally disordered at the M(1,3) sites, the relative band intensities can be calculated ( ${\rm I}_{{\rm B,C,D}}^{\rm C} $) following Strens (Reference Strens1966) and Law (Reference Law and Strens1976) as:
 $${\rm I}_{\rm B}^{\rm C} = {\rm x}_{{M(1)}}^{\rm 2} \,\,{\rm y}_{M(3)} + \,2{\rm x}_{M(1)} {\rm y}_{M(1)} {\rm x}_{M(3)} $$
 $${\hskip-4pt\rm I}_{\rm C}^{\rm C} = {\rm y}_{{M(1)}}^{\rm 2} {\rm x}_{M(3)} + {\rm} 2{\rm x}_{M(1)} {\rm y}_{M(1)} \,{\rm y}_{M(3)} $$
 $${\hskip-82pt\rm I}_{\rm D}^{\rm C} = {\rm y}_{{M(1)}}^{\rm 2} \,{\rm y}_{M(3)} $$
where yM(1) = Fe2+ at each of the two M(1) sites, yM(3) = Fe2+ at M(3), xM(1) = Mg at each of the two M(1) sites and xM(3) = Mg at M(3).
Substituting the site occupancies of Table 7 into equation 2, we obtain  ${\rm I}_{\rm B}^{\rm C} $ = 2,
 ${\rm I}_{\rm C}^{\rm C} $ = 19 and
 ${\rm I}_{\rm D}^{\rm C} $ = 79. These values are in reasonable agreement with the observed relative intensities (FTIR powder data) given in Table 8, allowing us to conclude that there is complete Fe2+/ Mg disorder over the M(1,3) sites in the riebeckite studied.
Conclusions
This work reports a multi-technique crystal-chemical study of a relatively common, but little studied Fe-rich sodium amphibole, riebeckite. A combination of refined site-scattering and Mössbauer data shows that trivalent cations are fully ordered at M(2), while OH-stretching spectroscopy (both FTIR and Raman) indicates complete short-range order of O(3)F and A(Na, K). The Fe2+/Mg composition at M(1,3) provided by powder FTIR is in excellent agreement with the site populations given by EMP and SREF, whereas single-crystal FTIR spectroscopy does not provide satisfactory results, possibly because FTIR powder data do not depend on features such as crystal orientation and beam polarization. This issue however needs to be investigated in detail on a larger set of amphiboles because vibrational spectroscopy can be important analytical tools for fibrous amphiboles of environmental/biomedical interest (e.g. Della Ventura, Reference Della Ventura and Gualtieri2017). Single-crystal Raman spectroscopy only slightly overestimates the content of Fe2+ at M(1,3), but within the experimental uncertainty (5%); therefore, this method is a reliable tool for a non-destructive crystal-chemical analysis.
Acknowledgements
P. Leverett, W. Maresch and an anonymous referee provided careful reviews of the manuscript. G. Redhammer (Salzburg) helped with the interpretation of the Mössbauer spectrum and T. Malcherek (Hamburg) helped with the XRD orientation of the sample used for Raman measurements. Part of this work was done during the stay of U.S. at the Department of Geological Science (UM, Winnipeg) financed by a PhD grant from Roma Tre University.
Supplementary material
To view supplementary material for this article, please visit https://doi.org/10.1180/minmag.2017.081.064



