


1 Introduction
Granular materials are observed in a wide spectrum of scenarios from industrial to large-scale naturally occurring events, such as sand dunes, avalanches and extra-terrestrial flows (Jaeger, Nagel & Behringer Reference Jaeger, Nagel and Behringer1996; Delannay et al. Reference Delannay, Valance, Mangeney, Roche and Richard2017). They are unusually complex and are known to exhibit interesting features, such as segregation (Ottino & Khakhar Reference Ottino and Khakhar2000; Goldhirsch Reference Goldhirsch2003; Gray Reference Gray2018), clustering (Savage Reference Savage1992), collapse, roll waves (Forterre & Pouliquen Reference Forterre and Pouliquen2003; Viroulet et al. Reference Viroulet, Baker, Rocha, Johnson, Kokelaar and Gray2018), oscillons (Umbanhowar, Melo & Swinney Reference Umbanhowar, Melo and Swinney1996; Aranson & Tsimring Reference Aranson and Tsimring2006), flow instabilities (Pouliquen, Delour & Savage Reference Pouliquen, Delour and Savage1997; Forterre & Pouliquen Reference Forterre and Pouliquen2001), and discontinuities such as shock waves (Amarouchene, Boudet & Kellay Reference Amarouchene, Boudet and Kellay2001; Rericha et al. Reference Rericha, Bizon, Shattuck and Swinney2001; Gray, Tai & Noelle Reference Gray, Tai and Noelle2003; Gray & Cui Reference Gray and Cui2007; Vreman et al. Reference Vreman, Al-Tarazi, Kuipers, Annaland and Bokhove2007; Johnson & Gray Reference Johnson and Gray2011; Vilquin, Boudet & Kellay Reference Vilquin, Boudet and Kellay2016) and granular jumps (Brennen, Sieck & Paslaski Reference Brennen, Sieck and Paslaski1983; Savage Reference Savage1984; Gray et al. Reference Gray, Tai and Noelle2003; Faug et al. Reference Faug, Childs, Wyburn and Einav2015).
Granular flows are interesting but unusually complex. A single system of granular material can display partly solid-, liquid- and gas-like behaviour, all at the same time (Jaeger et al. Reference Jaeger, Nagel and Behringer1996). These flows are characterized by inelastic collisions that cause severe dissipation in the kinetic energy of macroscopic grains. While some states and features are similar to those observed in molecular gases and/or liquids, such as shock waves and Kelvin–Helmholtz type instability, others (like fingering, clustering and segregation, for example) are peculiar to granular flows (Pouliquen et al. Reference Pouliquen, Delour and Savage1997; Gray Reference Gray2018). The dissipative effect results in a faster decay of the granular temperature that resists the tendency of grains to pass information through granular collisions (Brey, Cubero & Ruiz-Montero Reference Brey, Cubero and Ruiz-Montero1999). Therefore, grains achieve a sonic state at a much lower velocity, and shock waves are commonly observed at speeds that can be easily achieved in avalanches and routine industrial processes (Heil et al. Reference Heil, Rericha, Goldman and Swinney2004; Amarouchene & Kellay Reference Amarouchene and Kellay2006). Granular flow around a bluff body results in the formation of a nearly parabolic shock wave, with fast-moving grains upstream of the shock front and almost stationary grains sitting on the nose (stagnation zone). The wake is characterized by two thick granular streams separated by a granular vacuum in the shadow region of the obstacle, the overall structure resembling the flow of molecular gases at hypersonic speeds around similar obstacles (Amarouchene et al. Reference Amarouchene, Boudet and Kellay2001; Gray et al. Reference Gray, Tai and Noelle2003; Gray & Cui Reference Gray and Cui2007; Cui & Gray Reference Cui and Gray2013). The formation of shocks in granular media has been earlier studied experimentally as well as numerically by modelling such flows using a continuum, discrete element method and molecular dynamics approach (Goldshtein et al. Reference Goldshtein, Shapiro, Moldavsky and Fichman1995; Buchholtz & Pöschel Reference Buchholtz and Pöschel1998; Rericha et al. Reference Rericha, Bizon, Shattuck and Swinney2001; Boudet, Amarouchene & Kellay Reference Boudet, Amarouchene and Kellay2008; Pudasaini & Kröner Reference Pudasaini and Kröner2008; Padgett, Mazzoleni & Faw Reference Padgett, Mazzoleni and Faw2015). Similar shock waves are common to fluids in the supersonic regime, and have been studied in detail ever since they were discovered. One interesting phenomenon related to shock waves that has gained much attention is shock–shock interactions. The interaction phenomenon depends on the nature, strength and orientation of shock waves, and can result in a complex flow field with mixed regions of subsonic and supersonic flows. Johnson & Gray (Reference Johnson and Gray2011) observed the interaction of oblique shock waves when a granular jet impinges on a flat inclined plane and results in the formation of two shock waves that meet and interact downstream to form a tear-drop granular region.
In this article, we present results pertaining to shock–shock interactions in granular media that can have implications in common situations – for instance, in landslides and snow avalanches. To the best knowledge of the authors, this is one of the few attempts to investigate the phenomenon of shock–shock interactions in granular media in detail. We report, for the first time, a new dynamic instability that is apparently a manifestation of shock–shock interactions in rapid granular flows around closely placed obstacles. While granular flows qualitatively share some similarities with gas dynamics, no correspondence to the dynamic instability discussed in the present article is found in gas dynamics. We first characterize the shock–shock interaction structures, and then illustrate the dynamic instability in such situations using controlled laboratory-scale granular flow experiments.
Schematic of the experimental set-up.

2 Experimental set-up
The experimental set-up is shown in figure 1. It consists of a 310 mm wide and 1000 mm long rectangular channel of glass sheets with a channel gap of 5 mm. The channel can be inclined to the horizontal at any angle ( $\unicode[STIX]{x1D719}$) between
 $20^{\circ }$ to
 $80^{\circ }$. The opening of the hopper is fixed and an equal amount of material is loaded before each run to ensure the same mass flow conditions at the channel inlet. Two similar isosceles triangular wedges, separated by spacing
 $s$, are placed at the centre of the channel, tightly clamped between two glass sheets. The triangular wedges are precisely manufactured from brass material by a laser cutting process. Monodisperse transparent glass beads with a nominal diameter of
 $0.125\pm 0.025~\text{mm}$ are loaded into the hopper stationed at the top of the channel, to slide down under the influence of gravity when released via a gate mechanism. The channel is illuminated using a white LED-based light panel placed on the rear side of the channel and the camera used for visualization is positioned normal to the flow, focusing the region of interest. Density variations created by flow structures result in intensity variations in the light transmitted through the channel which are captured in the shadowgraph images. Details of the experimental set-up used in the present investigation can be found in the recent work (Garai, Verma & Kumar Reference Garai, Verma and Kumar2019). Experiments are performed several times for repeatability and uncertainty analysis. Table 1 shows the important flow properties of granular streams at different channel inclinations (
 $\unicode[STIX]{x1D719}$). Velocity is estimated by tracking coloured tracer particles in the images taken from a Dantec Dynamics Motion Pro High-Speed camera with a 35 mm lens. Images were acquired at rates of 700 and 1165 f.p.s. for velocity estimation, as shown in figure 2. The Mach angle is used to estimate the Mach number using the gas dynamic analogy. The Mach angle in the present case is obtained by perturbing the granular stream with the tip of a fine needle, as suggested by Amarouchene & Kellay (Reference Amarouchene and Kellay2006) and Heil et al. (Reference Heil, Rericha, Goldman and Swinney2004). The speed of sound has also been estimated using the Mach number data and is found to be approximately 0.22
 $\text{m}~\text{s}^{-1}$ averaged at all channel inclinations. In granular flows over inclined planes similar to the present work, the Froude number,
 $Fr=U/\sqrt{gh}$, is another important parameter, where
 $g$ is the acceleration due to gravity and
 $h$ is the depth of granular flow upstream of the shock wave. This is also tabulated in table 1. The depth of the granular flow,
 $h$, was estimated by observing the cross-section of the flow with a laser sheet. It was observed that the channel was approximately filled to 50 % of the channel depth, suggesting that
 $h$ is approximately 2.5 mm (20 grain diameters).
Illustration of particle tracking with time using high-speed imaging for flow velocity estimation in granular flow past a single wedge. The images are taken at a frame rate of 1165 f.p.s.

Flow properties.

3 Results and discussion
Schematic of the shock–shock wave interaction morphology.

Shadowgraph images of structures formed due to shock interactions in a granular stream past a pair of triangular wedges: (a)  $\unicode[STIX]{x1D703}=40^{\circ }$,
 $s=2d$,
 $\unicode[STIX]{x1D719}=60^{\circ }$; (b)
 $\unicode[STIX]{x1D703}=60^{\circ }$,
 $s=2d$,
 $\unicode[STIX]{x1D719}=60^{\circ }$; (c)
 $\unicode[STIX]{x1D703}=50^{\circ }$,
 $s=0.5d$,
 $\unicode[STIX]{x1D719}=65^{\circ }$; (d)
 $\unicode[STIX]{x1D703}=50^{\circ }$,
 $s=1d$,
 $\unicode[STIX]{x1D719}=65^{\circ }$; (e)
 $\unicode[STIX]{x1D703}=60^{\circ }$,
 $s=d$,
 $\unicode[STIX]{x1D719}=50^{\circ }$. Panels (b) and (e) are instantaneous whereas others are time averaged.

The interaction structures are obtained by placing two similar triangular wedges with semi-wedge angle  $10^{\circ }\leqslant \unicode[STIX]{x1D703}\leqslant 80^{\circ }$ separated by spacing
 $0.5d\leqslant s\leqslant 2.5d$ in the free stream corresponding to different channel inclination
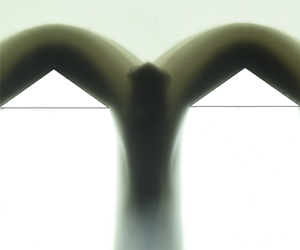
 $30^{\circ }\leqslant \unicode[STIX]{x1D719}\leqslant 80^{\circ }$. Figure 3 shows schematically the arrangement of wedges and the typical flow features resulting from shock–shock interactions in such a system. The grains sliding down the channel collide inelastically with the wedge surface and bounce back in a direction that depends on the wedge angle. The grains bouncing away from the walls are then dragged downwards by the undeflected free stream grains coming from the top. As more and more grains strike and reflect from the wedges, the net interaction of these with the free stream creates a front of concentrated grains that appear as a shock wave. While the interaction phenomenon is highly sensitive to the above-mentioned geometric parameters, some typical shock–shock interaction structures are shown in figure 4, which are observed over a wide range of parametric values covered in the present experimental work. All the images in the present article demonstrate the time-averaged flow features over a duration of 0.02 s (camera exposure time), unless it is stated otherwise as instantaneous (taken with a shutter speed of
 $1/8000~\text{s}$).
Figure 4(a) shows two attached shock waves for  $\unicode[STIX]{x1D703}=40^{\circ }$ and
 $\unicode[STIX]{x1D719}=70^{\circ }$, mildly interacting to form a thin granular streak when the separation between the wedges
 $s=2d$. At a higher semi-wedge angle
 $\unicode[STIX]{x1D703}=60^{\circ }$ in figure 4(b), the shock waves are detached in the form of a parabolic dome on each wedge. Detached shock waves from the two wedges interact near the centre region to form two transmitted waves, giving rise to a diamond-shaped structure. The concentrated slow-moving grains in the diamond structure are pushed by the free stream grains coming from the top and the gravitational force to move downstream in the form of a granular streak. Once the grains that are constrained between the wedges reach the minimum area near the base of the wedges, they are relaxed and free to dilate. This causes the streak to progressively become thinner in the wake (see figure 4b). This is perhaps the first time that shock interaction streaks have been revealed in granular flows.
Figure 4(c) and (d) show the shock wave structure for the same  $\unicode[STIX]{x1D703}$ and
 $\unicode[STIX]{x1D719}$, but at different spacing
 $s$. The grains collecting near the centre of the two wedges due to the interaction process must pass through the spacing that separates the two wedges. For higher spacings, the grains flow rather easily between the two wedges, whereas the smaller spacing creates more resistance, causing grains to build up between the wedges. Because of the small separation in figure 4(c), the grains in the centre of the wedges suffer more resistance in moving downstream and are thus heaped to form a single parabolic-type detached shock wave. The two wedges seem to behave like a single wedge for the incoming granular stream. On the other hand, the shock waves in figure 4(d), with spacing increased from
 $0.5d$ to
 $1.0d$, appear to transit from a detached to an attached nature and interact near the centre region with a concentrated diamond streak. The spacing
 $s$ between the two wedges thus plays a significant role in dictating the interaction process and the overall flow structure around the obstacles. Figure 4(e) for
 $\unicode[STIX]{x1D703}=60^{\circ }$,
 $s=d$ and
 $\unicode[STIX]{x1D719}=50^{\circ }$ represents one of the few cases of shock interaction where the central structure is unstable, and oscillates from left to right about the mean position at the centre. The oscillatory nature near the interaction zone is communicated downstream in the wake region and is very well observed in the central granular stream passing between the wedge spacing.
For a detailed analysis of the shock interaction process, experiments have been performed for different combinations of  $\unicode[STIX]{x1D703}$,
 $\unicode[STIX]{x1D719}$ and
 $s$, systematically varying only one at a time. Figure 5 shows the snapshots of flow structures obtained for different channel inclinations (flow speeds) while keeping the wedge angle and spacing the same. To study the effect of channel inclination (
 $\unicode[STIX]{x1D719}$) on the interaction structure, wedges with
 $\unicode[STIX]{x1D703}=60^{\circ }$ are selected for which the shock wave is always detached. When the gate is removed to initiate the flow, the grains start piling up on the top and in the central region of the wedges. The process results in the formation of a parabolic shock front and a triangular heap of slow-moving grains, the apex of which is stabilized by the frictional resistance between the grains (figure 5). This resistance is related to the angle of repose, which is apparently similar to the angle obtained from the sand pile formed by the continuous pouring of grains to form a conical heap. The angle of repose of the inner stagnant zone for a single shock wave has been earlier investigated in some detail (Amarouchene et al. Reference Amarouchene, Boudet and Kellay2001). For small channel inclination (
 $\unicode[STIX]{x1D719}=33^{\circ }$), the velocity and the mass flow rate of the free stream are small, resulting in weak interaction of the shock waves, as shown in figure 5(a). As the inclination is increased to
 $40^{\circ }$, the mass flow rate of the grains increases and the grains are more constrained while passing through the spacing
 $s$. The constrained grains are acted upon by the inter-granular friction and the friction between the grains and wedge surface, causing their motion to be retarded and thereby increasing the size of the central diamond streak (figure 5b). The flow develops and stabilizes when equilibrium is attained between the incoming and outgoing granular flux, with a well-defined diamond structure, as shown in figure 5.
Shock interaction structures for varying channel inclination  $\unicode[STIX]{x1D719}$. Other geometric parameters, such as
 $\unicode[STIX]{x1D703}=60^{\circ }$ and
 $s=1.2d$, are constant for all the images.

As measured from the resulting images, the apex angle ( $p$ in figure 3) of the shock diamond is small for mild interactions that occur at low values of
 $\unicode[STIX]{x1D719}$ and high values of
 $s$. With an increase in
 $\unicode[STIX]{x1D719}$ (keeping
 $s$ constant), the apex angle increases to its maximum value such that the repose angle of the diamond (
 $r$) is close to the general angle of repose of glass beads, which is
 $22.6^{\circ }$, as measured experimentally. For instance, the apex angle in figure 5(b) is close to
 $120^{\circ }$. Once the apex angle reaches its maximum value, the sharp apex transforms into a rounded nose with an increase in the value of
 $\unicode[STIX]{x1D719}$, and further to a flattened surface, giving it a trapezoidal shape (figure 5c and d). As the inclination of the channel approaches
 $60^{\circ }$, the diamond structure becomes unstable and starts oscillating between the wedges in the direction transverse to the free stream (see movie 2 and movie 3 in the supplementary movies provided). The oscillatory nature of the streak is sensitive to, and observed for a narrow range of parameters. However, it is worth mentioning that the dynamic instability is triggered when the diamond structure transforms from the sharp apex to the trapezoidal configuration. No oscillations are observed for the structure with
 $\unicode[STIX]{x1D719}=80^{\circ }$ shown in figure 5(d). The instability phenomenon is demonstrated in figure 7, where instantaneous snapshots of the flow field at every quarter of the cycle are shown. As seen in figure 6, the value of
 $L$ (which signifies the location where the shock waves start interacting between the two wedges as shown in figure 3) increases with an increase in channel inclination (
 $\unicode[STIX]{x1D719}$). The increase in the onset distance with the channel inclination is due to greater accumulation of granular mass between the wedges. The accumulation is the result of granular collapse due to congestion caused by closely placed wedges. A higher value of this parameter signifies an early and more intense interaction, resulting in a bigger streak of concentrated grains at the centre, as shown in figure 8. The curves in figure 6 also demonstrate that the value of
 $L$ is sensitive to the wedge spacing. While the general trend is that the onset of interaction length (
 $L$) decreases with the increase in the wedge spacing at a fixed channel inclination, it is observed that the curve for
 $s/d=1.2$ lies above the curve for
 $s/d=1.0$. A possible reason for this behaviour could be that for very small wedge spacing and higher mass flow rate at higher channel inclinations, grains do not make a conical heap and are rather more spread out on the two wedges, resulting in smaller values of
 $L$ for
 $s/d=1.2$.
Location from the base of the wedge ( $L$ in figure 3) at which the shock waves start interacting with each other.

Instantaneous shock–shock interaction structures showing the position of the diamond structure during one cycle of oscillation for  $\unicode[STIX]{x1D703}=60^{\circ }$,
 $s=1.0d$ and
 $\unicode[STIX]{x1D719}=60^{\circ }$.

Variation in the size of the diamond streak with the channel inclination for different wedge spacing.

To characterize shock–shock interaction structures, we measure the size, shape and position of the central streak and observe the critical values of the geometrical parameters where oscillations are triggered. The variation in the size of the central granular streak with  $\unicode[STIX]{x1D719}$ is shown in figure 8. The shape of the diamond streak and its size
 $t$ is schematically shown in the inset of figure 3. Numerical values shown in the present work are the average values over a few experimental realizations. The figure shows a continuous increase in the size of the diamond streak with the channel inclination; except for
 $s/d=2.0$, where the size starts decreasing beyond
 $60^{\circ }$. The variation in size beyond
 $70^{\circ }$ is not significant and appears to be saturating for
 $s/d\leqslant 1.5$. The increase in the streak size indicates stronger shock–shock interaction due to increase in the Mach number at higher channel inclinations. Due to the higher Mach number, transmitted shock waves (as shown in figure 3) penetrate deeper into the grains, resulting in bigger streaks for strong interactions. The frequency (
 $f$) and amplitude (
 $a$) of the oscillations are estimated by tracking pixel intensities in successive frames of digital videos. For the present case of
 $\unicode[STIX]{x1D703}=60^{\circ }$ and
 $s=1.25d$, oscillations start at
 $\unicode[STIX]{x1D719}=60^{\circ }$ and terminate when
 $\unicode[STIX]{x1D719}$ is increased to
 $70^{\circ }$. The amplitude and frequency of the dynamic instability remains constant at approximately 4.74 mm and 3.19 Hz, respectively. For
 $\unicode[STIX]{x1D703}=60^{\circ }$ and
 $s=1.0d$, the instability was triggered at a lower channel inclination
 $\unicode[STIX]{x1D719}=50^{\circ }$ with
 $a=2.8~\text{mm}$ and
 $f=3.0~\text{Hz}$, and persisted until
 $\unicode[STIX]{x1D719}=65^{\circ }$ with
 $a=3.07~\text{mm}$ and
 $f=2.87~\text{Hz}$. The dependency of the apex shape of the diamond streak on
 $s$ and
 $\unicode[STIX]{x1D719}$ is summarized in the phase diagram shown in figure 9. The enclosed region within the diagram covers the cases where oscillations are observed in our experiments.
Phase diagram, showing the morphology of granular streaks with changes in wedge spacing  $s$ and channel inclination
 $\unicode[STIX]{x1D719}$ (velocity). The enclosed region indicates the cases where dynamic instability in the shock–shock interaction zone is observed in the present experiments.

Based on the observations, the authors propose a possible mechanism for the formation of a high-density granular structure near the shock–shock interaction zone and the reason for its oscillation under certain experimental conditions. The granular streak is formed due to the interaction of the shock waves from the two wedges. Grains from the interacting shocks undergo inelastic collisions with each other, resulting in severe dissipation of the kinetic energy. Consequently, the grains momentarily collapse and concentrate in the interaction zone, resulting in the formation of a high-density granular streak. Low-momentum grains inside the streak are being acted upon by the gravitational force and the free stream grains, causing them to accelerate down the channel. The amount of granular mass that can pass between the two wedges depends on  $\unicode[STIX]{x1D703}$ and
 $s$. For a small value of
 $\unicode[STIX]{x1D703}$ and a large value of
 $s$, grains are less constrained and are easily able to pass through the wedges with a small streak, as shown in figure 4(a), whereas for a high value of
 $\unicode[STIX]{x1D703}$ and a small value of
 $s$, the grains become more constrained and a more dense streak is formed, as shown in figure 4(d). If the spacing is too small, the granular mass is unable to negotiate the gap and spills over the sides, resulting in a single shock profile, as shown in figure 4(c). For a very low value of
 $\unicode[STIX]{x1D703}$, the grains do not tend to stagnate on the wedge surface and the blockage caused by the wedge is so small that no oscillations are observed irrespective of the value of
 $\unicode[STIX]{x1D719}$ and
 $s$. Similarly, for a high value of
 $s$, such as
 $1.5d$, clogging is observed for high values of
 $\unicode[STIX]{x1D703}$ and
 $\unicode[STIX]{x1D719}$, but no oscillations are observed at any combination.
For a particular combination of parameters, the shock–shock interaction structure becomes unstable. This results in eccentricity in the shock–shock interaction structure, causing the central streak to form slightly away from the centre. The central high-density structure is formed by the free stream grains, which are diverted by the wedge surfaces towards the centre region. The grains coming from the right-hand wedge try to push the streak towards the left, whereas grains coming from the left-hand wedge try to push the streak towards the right, as shown schematically in figure 10, with representative streamlines in blue. Since the streak is off-centre due to inherent disturbances, the imbalance, as represented by red arrows in figure 10, causes the streak to move in one direction. If the streak is on the right side, grains coming from the left side dominate and push it further to the right. The process continues until the streak attains sufficient height on the right-hand wedge, where it topples back towards the left side under its own weight. The grains inside the streak then continue their motion in the leftward direction due to their momentum and an additional push from the grains coming from the right-hand wedge. It is observed that grains within the streak closer to the centre are shed downstream, whereas more grains are deposited on the other side of the streak that is away from the centre. Thus, the entire shock–shock interaction structure is dynamic in nature, and grains inside the streak are continuously replaced by the new set of grains coming from the free stream. The entire mechanism causes the streak to oscillate left and right. The process of this new dynamic instability in shock–shock interaction can be clearly seen in the movies (both slow motion and regular speed) provided in the supplementary material. The motion of the central streak induces oscillations in the wake (figure 4e) and also on the parabolic shock waves on the individual wedges, which can be noticed from figure 7. The resulting oscillatory nature of the structure due to dynamic instability creates a natural sieving effect that facilitates easy passage of granular flux through the limited spacing between the wedges. Practically, it has been observed that a shaking mechanism avoids choking and increases the mass flow rate through the sieve holes.
Schematic of the oscillating shock–shock interaction structure. Blue lines show the streamlines for representative purposes. Dotted red lines show the push exerted by grains from either wedge and the net imbalance is shown by the solid arrow.

4 Conclusions
The phenomenon of shock–shock interactions in dilute granular flows past two triangular wedges is experimentally investigated. Interaction between the shock waves causes the grains to collapse, resulting in the formation of interesting patterns with a concentrated streak of grains between the two wedges. The streak destabilizes under certain experimental conditions and starts oscillating between the two wedges. The observed new dynamic instability is essentially due to the inability of the system configuration to have a steady flow solution to allow incoming mass flux, resulting in the system exhibiting a natural sieving effect. The frequency of oscillations due to this dynamic instability is observed to be close to 3 Hz in the present work. Dense granular mass flux may perhaps depend on grain interactions, which possibly are a function of grain shape. This suggests that the frequency of the observed instability perhaps depends on the grain geometry – a topic which needs further investigation.
Acknowledgements
The authors would like to thank Professor K. Poddar for providing some necessary equipment for the experiments.
Supplementary movies
Supplementary movies are available at https://doi.org/10.1017/jfm.2019.988.



