INTRODUCTION
Anthropogenic habitat disturbance can have wide-ranging consequences for mutualisms, as disturbance effects on one partner result in effects on both (Chapman et al. Reference CHAPMAN, CHAPMAN, VULINEC, ZANNE and LAWES2003). For this reason, one of the many goals in conservation and restoration ecology is the maintenance and/or re-establishment of interactions between plants and animals. Seed dispersal mutualisms are especially important because seed dispersal fundamentally influences plant communities by establishing the initial template for spatial distribution of seedlings (Wang & Smith Reference WANG and SMITH2002). Anthropogenic disturbance can modify seed dispersal by impacting the animal dispersers directly (Chapman & Bourke Reference CHAPMAN and BOURKE2001, Chapman et al. Reference CHAPMAN, CHAPMAN, VULINEC, ZANNE and LAWES2003, Restrepo & Gomez Reference RESTREPO and GOMEZ1998) and by altering their behavioural patterns (Bossard Reference BOSSARD1991, Jordano & Schupp Reference JORDANO and SCHUPP2000, Levey et al. Reference LEVEY, BOLKER, TEWKSBURY, SARGENT and HADDAD2005), with important consequences for the species they disperse.
Myrmecochory (seed dispersal by ants) is a geographically and phylogenetically widespread dispersal syndrome, with ants dispersing plants from more than 80 plant families (Beattie Reference BEATTIE1985, Dunn et al. Reference DUNN, GROVE, BARRACLOUGH, GIVNISH and MAJER2007). While many plant species are specifically adapted for seed dispersal by ants and have special lipid-rich appendages called elaiosomes (Beattie Reference BEATTIE1985), ants are typically opportunistic and pick up both myrmecochorous (adapted) and non-myrmecochorous seeds (Christianini et al. Reference CHRISTIANINI, MAYHE-NUNES and OLIVEIRA2007). Ants collect and transport seeds to ant nests, where they consume the nutritional reward and discard the seed virtually unharmed; the seed can subsequently germinate (Beattie & Culver Reference BEATTIE and CULVER1981, Hughes & Westoby Reference HUGHES and WESTOBY1992). Despite its prominence as a dispersal syndrome, much of the work on seed dispersal by ants has been carried out in temperate and sclerophyll habitats (Giladi Reference GILADI2006). Relatively little is known about the role of seed dispersal by ants in tropical ecosystems (but see Dalling & Wirth Reference DALLING and WIRTH1998, Horwitz & Beattie 1980, Kaspari Reference KASPARI1996, Pizo Reference PIZO2007) and even less about the potential disruptive effects of extensive habitat alteration in the tropics on the interactions between ants and seeds.
One of the primary benefits of seed dispersal by ants appears to be dispersal for distance (Andersen Reference ANDERSEN1988, Giladi Reference GILADI2006), and most studies of myrmecochory use seed removals and dispersal distance as proxies for seed fitness (Gorb & Gorb Reference GORB and GORB1999, Horvitz & Schemske Reference HORVITZ and SCHEMSKE1986, Hughes & Westoby Reference HUGHES and WESTOBY1992). Factors that influence seed removal rate and seed dispersal distance include habitat characteristics and ant-specific characteristics, such as ant body size and behaviour. We hypothesize that habitat alteration in a tropical dry forest affects (1) ant community composition and species richness, (2) removal of Acacia collinsii and papaya seeds by ants and (3) seed dispersal distances and dispersal curves for A. collinsii and papaya seeds. If seed disperser assemblages shift with disturbance regime, we expect to see associated changes in seed removals and seed dispersal distance.
STUDY SITE
We carried out our study in April 2005 in Santa Rosa National Park, Guanacaste Province, Costa Rica. This area is characterized as a tropical dry forest, receiving between 915 and 2558 mm of rainfall annually, with an average of 1614 mm, falling primarily from April until November (Janzen Reference JANZEN1983, Reference JANZEN1988). Early successional forest in Santa Rosa is dominated by Acacia collinsii Saff., a pioneer tree species native to dry deciduous forests of Central America. Acacia collinsii trees are closely associated with Pseudomyrmex spinicola and P. nigrocincta ants (Janzen Reference JANZEN1983), which nest in hollow A. collinsii thorns, defending the tree from herbivores and encroaching vegetation. Pseudomyrmex ants also clear vegetation underneath their host trees (Janzen Reference JANZEN1966, Suarez et al. Reference SUAREZ, DE MORAES and IPPOLITO1998), resulting in patches of bare ground in areas where A. collinsii trees are abundant. Acacia collinsii trees commonly grow along disturbance edges (personal observation), such as roadsides and forest edges and are characteristic of a distinct forest-edge habitat; they are less abundant in more mature forests.
METHODS
Ant community composition
To sample the ant community, we placed five 50-m transects, 20 m apart, within each site and placed one pitfall trap every 10 m along each transect (30 pitfall traps per site). Pitfall traps consisted of 50-mL Falcon tubes (Benton-Dickenson Labware), filled 75% of the way up with soapy water and left in the ground for 24 h. Ants from pitfall traps were sorted, identified to species, and voucher specimens were deposited into the Museum of Natural History, University of Colorado. To calculate the relative abundance of ant species, we took the number of occurrences per species (number of pitfall traps per site where the species was collected) and divided by the total number of occurrences for all ant species in that site.
Effect of habitat disturbance on seed removals and dispersal distance
To determine the effect of land-use change on seed removals and seed dispersal by ants, we carried out seed-baiting experiments in four sites that differ in the degree of habitat alteration, listed from least disturbed to most disturbed: (1) secondary forest, (2) forest edge, (3) Acacia collinsii edge and (4) open pasture. Secondary forest sites were at least 100 m from the nearest road and had regenerated over the 35 y since the areas were cleared in 1972. The forest-edge sites were located along an open field. The Acacia edge site was located along a dirt road and was heavily dominated by A. collinsii trees. The open-pasture site was a large ungrazed field surrounded by disturbed forest edges. An introduced African grass, Hyparrhenia rufa Stapf, dominates this highly disturbed area. We were unable to find replicates of these specific vegetation types within the park. As a result, we replicated transects within each habitat.
We used fresh A. collinsii seeds from mature fruit collected locally within the park and papaya seeds from commercially purchased papaya fruits in all seed-baiting experiments in our study. Neither papaya nor A. collinsii seeds are specifically adapted for dispersal by ants, but both seed types have fleshy pulp that attracts ants. Acacia collinsii seeds are found in large pods, and a sticky yellow aril surrounds the seeds. While the white-throated magpie jay (Calocitta formosa Swainson 1827) is the primary disperser of A. collinsii seeds, we observed these seeds in ant refuse piles and preliminary baiting trials showed that ants were attracted to the yellow aril. Because Acacia seeds were less available, we supplemented seed depots with papaya seeds. Papaya (Carica papaya L., Caricaceae) is native to the lowland tropics of Central and South America and occurs throughout Costa Rica.
At each site, seed depots were placed along ten 50-m transects, with each seed depot placed at 10-m intervals along each transect (10 transects, 6 seed baits per transect = 60 seed depots per habitat) to ensure independent discoveries by different ant colonies. Each seed depot consisted of a white index card and we placed three fresh Acacia and five fresh papaya seeds at each depot. One observer circulated among four seed depots for 2 h or until all seeds were removed, recording all observed seed removals and following removed seeds. Ant activity significantly decreased in the late morning and ceased almost completely during the middle of the day; we therefore observed seed depots in the early morning and late afternoon. We recorded ant recruitment (defined as more than 10 individuals of the same species present at the seed depot) to the seed resource (yes/no), seed dispersal distance (displacement distance from depot to nest or drop point), seed destination (nest or drop), and the number of seeds remaining after 2 h. A seed was considered removed when it was moved 5 cm. We recorded each unique dispersal event. Unique events were those that involved a new depot or a new nest, regardless of how many times a single colony exploited a particular depot. For those events where more than one seed was removed by the same colony, only one dispersal event was recorded. We terminated observations of removed seeds when we were unable to track the seeds to their final destination, thus underestimating the dispersal distance for those seeds. For all terminated observations, we measured the distance to where the seed was last tracked.
Ant species characteristics and dispersal distance
We recorded the ant species removing seeds and those ants not easily identified in the field were collected for identification, taking care not to collect individuals that were carrying seeds back to the nest. In the cases where many individuals were recruited to the baits, we collected individuals at nests. For Pheidole spp., we collected major workers from the nests for identification. Voucher specimens were deposited into the University of Colorado Museum of Natural History entomological collection.
To assess ant body size characteristics, we measured head length, head width and Weber's length (Weber's length is measured from the anterodorsal margin of the pronotum to the posteroventralmost extension of the mesosoma) using a dissecting microscope with a micrometer. All individual ants collected at seed baits carrying seeds were measured. For species that carried seeds infrequently (Table 1), we were only able to collect a few specimens. As a result, the sample size for these species is too low to appropriately estimate body size. Since all measured body size traits are strongly correlated across species, we used Weber's length as an indicator of ant body size in all analyses including body size characteristics.
Actual ant species richness and relative abundance of Ectatomma ruidum and Pheidole fallax per site at Santa Rosa National Park, Costa Rica. Occupancy is calculated as the percentage of pitfall traps per habitat where E. ruidum and P. fallax were collected. Relative abundance is calculated as the number of occurrences of E. ruidum and P. fallax in pitfall traps per site divided by the total number of occurrences for all ants at that site.

ANALYSES
Ant community comparisons
The ant communities were compared among sites using EstimateS software (Version 7.5, R. K. Colwell, http://purl.oclc.org/estimates). We transformed ant community data into a presence/absence matrix, with each pitfall trap in a site as an observation and computed Jaccard's Classic similarity index, which is based on the probability that two randomly chosen individuals, one from each of the samples, both belong to the same species (Chao et al. Reference CHAO, CHAZDON, COLWELL and SHEN2005). A value of 1 represents complete overlap in species composition between two habitats and a species of 0 indicates that the two habitats do not share any species. Relative abundance per ant species was calculated by dividing the number of occurrences per species per habitat by the total number of occurrences for all ant species within that habitat. Absolute species occurrence (hereafter referred to as per cent species occupancy) was calculated as the number of pitfall traps where the species was collected per habitat divided by the total number of pitfall traps within that habitat.
Among-habitat analyses
JMP Software (JMP, a product of the SAS Institute, Cary, North Carolina, USA) was used for all statistical analyses. Because seed depots were separated by at least 10 m, they were likely to be encountered by distinct ant colonies and we observed no instances where the same ant colony was collecting seeds from multiple spatially separated seed depots. Therefore, each seed depot was treated as an independent replicate (Christian Reference CHRISTIAN2001, Christianini et al. Reference CHRISTIANINI, MAYHE-NUNES and OLIVEIRA2007, Kaspari Reference KASPARI1996, Pizo & Oliveira Reference PIZO and OLIVEIRA2001). There were no differences in seed removals between Acacia and papaya seeds and the vast majority of seed depots had both types of seeds removed; therefore, we pooled across seed type for the analyses of seed removal and dispersal distance. Using the following statistical models, we examined the influence of four variables on seed removals and dispersal distance: habitat, ant recruitment, ant species identity, and time block.
Model 1: Seed removals = ß0 + ß1 (habitat) + ß2 (recruitment) + ß3 (ant species) + ß4 (time block) + e
Model 2: Log (dispersal distance) = ß0 + ß1 (habitat) + ß2 (recruitment) + ß3 (ant species) + ß4 (time block) + e
Dispersal distances were not normally distributed; as a result, all dispersal distances were log-transformed for the analyses to ensure normal distribution of the error terms. Seed removal observations were made at three time periods, which were treated as time blocks for the purposes of the analyses. All observations made between 6h30 and 7h30 in the morning were put into the 7h00 block, those made between 8h30 and 9h30 were placed in the 9h00 block, and those made after 15h30 were placed into the 16h00 block. We ran two models predicting seed removals, both including time block, habitat, ant species, and recruitment as random effects, but the first model included all three time blocks as predictors and the second model excluded the 9h00 block because our observations showed that ant foraging and seed removal decreased substantially during that time period.
Ant species characteristics and dispersal distance
We used a generalized linear regression to address whether ant body size predicts both mean and maximum seed dispersal distance. For dimorphic species in the genus Pheidole, we used the Weber's length of minor workers because these workers carried seeds, while the major workers patrolled the trails (personal observation). Each unique dispersal event where we collected an ant specimen was treated as an independent replicate.
RESULTS
Ant community
We collected 44 ant species across all habitats. The majority of species were rare, with only one or a few individuals collected per site. The ant assemblages differed among habitats, with the open-pasture and forest-edge habitats most similar in species composition (Jaccard's Classic = 0.457) and Acacia most dissimilar with the other three (Acacia-Open Jaccard's = 0.222, Acacia-Edge Jaccard's = 0.231, and Acacia-Forest Jaccard's = 0.263). Pheidole fallax and Ectatomma ruidum were the most abundant ant species collected in pitfall traps, though both their relative abundance and occupancy differed among habitats (Table 1). In terms of both relative abundance and per cent occupancy, Pheidole fallax was the most abundant ant species in the Acacia edge habitat and E. ruidum was the most abundant in the open-pasture habitat and less abundant than P. fallax in the other three habitats (Table 1).
Effect of habitat disturbance on seed removals
We observed 240 seed depots containing 1920 seeds throughout the course of the study (N = 8 seeds per seed depot, 60 seed depots per habitat, 4 habitats). Out of 1920 seeds, ants removed 589 seeds during the 2-h observation periods (31% seed removal). Patterns of seed removal varied among habitats in the number of seed depots (out of 60 total) that had seed removal (open-pasture N = 42, Acacia edge N = 41, forest edge N = 28, secondary forest N = 17; Table 2) and the percentage of seeds removed during the observational period (open-pasture = 38.3%, Acacia edge = 36.5%, forest edge = 29%, secondary forest = 29.9%, Figure 1).
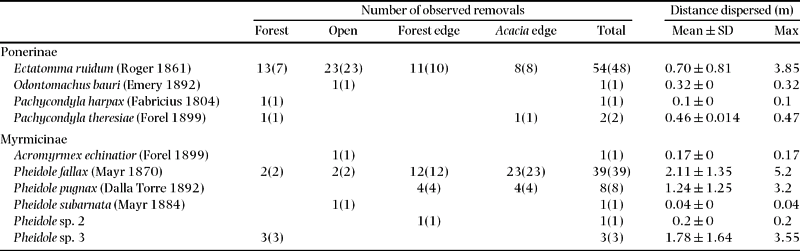
Total observations of unique removals of seeds, and distances removed, by ant species in Forest (N = 20), Open (N = 28), Forest edge (N = 28), and Acacia edge (N = 36) sites. Number of seed depots per site at which each ant species was observed removing seeds is given in parentheses. Mean (±SD) and maximum recorded dispersal distances are given per ant species; for species that dispersed seeds once, the mean and maximum distances are the same.

Differences in seed removals among habitats at Santa Rosa National Park, Costa Rica, pooling data across time blocks (Forest N = 18; Open N = 30; Acacia edge N = 37; Forest edge N = 28). The error bars represent ± 1 SE.

Both habitat and time block (observation periods: 7h00, 9h00, 16h00) significantly influenced seed removals (ANOVA overall model df = 11, 228; F = 9.46, P < 0.0001) with a significant interaction term (ANOVA df = 6, 233; F = 5.45, P < 0.0001). The percentage of seeds removed was lowest in the secondary forest and forest edge sites. Removals were highest in the early morning and lowest in the late morning. Ant activity was significantly reduced between 9h00 and 15h00 and ceased almost entirely in the open-pasture habitat. When we excluded the mid-morning time block from the analysis, we still found a significant influence of habitat on seed removals (ANOVA df = 3, 155; F = 15.1, P < 0.0001; Figure 1), but no effect of time block and no interaction between habitat and time block.
Effect of habitat disturbance on seed dispersal distance
We found significant differences in log(dispersal distance) among habitats (ANOVA df = 3, 109; F = 5.60, P = 0.0013; Figure 2); seeds were dispersed significantly shorter distances in the open-pasture than in the other three habitats and slightly further in the Acacia edge than in the secondary forest and forest edge habitats (Figure 2). Overall, 44.2% of all observed seeds were taken to nests, 15.7% were dropped in litter during transport and subsequently abandoned, and 39.1% of seed observations were terminated due to loss of visual contact with the ant carrying the seed.
Mean dispersal distance by habitat (Forest N = 18; Open N = 30; Acacia edge N = 37; Forest edge N = 28). Data presented for overall mean dispersal distance, pooling data for all observed seed removals, but excluding lost seeds. The error bars represent ±1 SE.

Ant species characteristics and dispersal distance
We observed 24 ant species interacting with seeds at seed baits during the course of the study. Most of these species did not remove seeds (14 out of 24; Table 2) and species in the genus Solenopsis cleaned seeds at baits without removing the seeds. Both ant species identity (ANOVA df = 9, 102; F = 5.44, P < 0.0001) and recruitment (ANOVA df = 1, 110; F = 12.9, P = 0.0005) significantly influenced log(dispersal distance). However, the ant species and recruitment terms are not independent of each other since the species that dispersed seeds further were also the recruiting species; thus, when both factors are included in the overall model, they no longer significantly predict log(dispersal distance). For the ant species that dispersed seeds, we found no relationship between the mean and maximum dispersal distance and Weber's length, a measure of ant body size (mean dispersal distance: df = 1,9; R2 = 0.13, P = 0.31; and maximum dispersal distance: df = 1,9; R2 = 0.105, P = 0.344).
Of the species that did remove seeds, four species dispersed seeds more than once, and two ant species, Ectatomma ruidum and Pheidole fallax, were together responsible for 92% of all observed seed removals (Table 2). The Weber's lengths differed between E. ruidum and P. fallax (E. ruidum N = 22, mean ± SD = 2.46 ± 0.13; P. fallax minor N = 15, mean ± SD = 0.86 ± 0.12), as did the dispersal curves generated by these two species (Figure 3) and their relative contribution to seed removals in different habitats (Table 2), with P. fallax most commonly dispersing seeds in the Acacia-edge site and E. ruidum in the open-pasture site.
Seed dispersal curves generated by Ectatomma ruidum (filled in bars, N = 54) and Pheidole fallax (open bars, N = 39), pooling data for all seeds across all sites.

DISCUSSION
Ants dispersed a large proportion of seeds in Santa Rosa National Park, seeds not morphologically adapted for such dispersal mechanisms. Ants removed nearly a third of all seeds within the first 2 h of observation in our study and both seed removals and seed dispersal distance differed significantly among sites. Contrary to our expectations, habitat disturbance did not negatively affect seed removals, which were highest at most disturbed site, the open pasture, and lowest at the most intact site, the secondary forest. However, average dispersal distance was highest in the edge habitats and lowest in the open pasture, a result we attribute to the differences in the relative abundance and behavioural characteristics between the two most common seed dispersers, Ectatomma ruidum and Pheidole fallax.
How should dispersal services be evaluated? One possible criterion for evaluation of seed dispersal services is the measure of distance a propagule is moved away from the maternal plant. Another possible measure of dispersal is a measure of seed germination and survival of offspring to adulthood, as well as adult fecundity. Ants could influence all three of these criteria and separate studies have shown the effects of ants on seed germination (Christianini et al. Reference CHRISTIANINI, MAYHE-NUNES and OLIVEIRA2007, Leal et al. Reference LEAL, WIRTH and TABARELLI2007), relatedness among offspring (Kalitz et al. Reference KALITZ, HANZAWA, TONSOR, THIEDE and VOUGT1999), and plant fitness. While our study does not help elucidate effects of ants on all these factors, we show that not all ant species are of equal quality in terms of dispersal distance. From the perspective of the plant, the consequences of dispersal by one ant species versus another can be very different (Carney et al. Reference CARNEY, BYERLEY and HOLWAY2003, Ness Reference NESS2004). We found significant differences in both mean and maximum achieved dispersal distance between ant species, an effect that in our system is mediated by ant life history and species-specific behaviour.
Several studies on seed dispersal by ants have noted that larger ant species tend to disperse seeds further than smaller species (Horwitz & Schemske 1986, Kaspari Reference KASPARI1996, Ness et al. Reference NESS, BRONSTEIN, ANDERSEN and HOLLAND2004). In contrast, we found no significant relationship between body size and dispersal distance, most likely due to the fact that the vast majority of seeds were removed by two ant species that differ not only in body size but also in biology and behaviour – E. ruidum and P. fallax. Ectatomma ruidum workers are large-bodied generally solitary foragers (Breed et al. Reference BREED, ABEL, BLEUZE and DENTON1990), while P. fallax ants (along with other species in the genus Pheidole) are relatively small. Pheidole fallax ants recruit heavily to resources (Itzkowitz & Haley Reference ITZKOWITZ and HALEY1983), and E. ruidum ants have also been reported to exhibit low-level recruitment to sugar baits (Pratt Reference PRATT1989). In our observations, E. ruidum rarely recruited to seed depots and individual ants had difficulty handling and moving an entire seed, dropping many close to the seed depot. In many instances, E. ruidum ants removed the aril of Acacia seeds without moving the seed at all, while P. fallax ants recruited heavily and as a result, were able to transport seeds, resulting in increased dispersal distance.
Studies have shown that a number of Pheidole species, including P. fallax, discard collected seeds into refuse piles (Kaspari Reference KASPARI1996, Levey & Byrne Reference LEVEY and BYRNE1993). In one P. fallax refuse pile in Santa Rosa National Park, we found seeds from 16 plant species, including those of A. collinsii, which were the most abundant. Several studies have demonstrated that seed germination can be higher on soils from ant nests (Leal et al. Reference LEAL, WIRTH and TABARELLI2007, Pizo & Oliveira Reference PIZO and OLIVEIRA2001), though we did not test seed viability and germination in our study. The majority of ant species that interacted with seeds cleaned seeds in situ, and a few studies have shown that seed cleaning by ants improves germination (Christianini et al. Reference CHRISTIANINI, MAYHE-NUNES and OLIVEIRA2007, Pizo & Oliveira Reference PIZO and OLIVEIRA1998). Taken together, seed-cleaning and seed dispersal some distance away from the maternal plant confer important benefits for plants that include removal from the parent-offspring conflict zone underneath the parental canopy (Giladi Reference GILADI2006), decreased predation by potential seed harvesters (Giladi Reference GILADI2006), increased germination rates (Christianini et al. Reference CHRISTIANINI, MAYHE-NUNES and OLIVEIRA2007), and possibly germinating in nutrient-rich ant nests.
The overall main effect of habitat disturbance on seed dispersal by ants at our sites was the shift in the ant community and the relative abundance of key disperser species, changes that cascaded down to affect ant-seed interactions. Other studies have also demonstrated the importance of ant species composition for seed dispersal (Gorb & Gorb Reference GORB and GORB1999, Horvitz & Beattie Reference HORVITZ and BEATTIE1980, Manzaneda et al. Reference MANZANEDA, REY and BOULAY2007, Ness Reference NESS2004). Santa Rosa National Park contains a highly diverse ant community and a third of the ant species we collected in pitfall traps interacted with seeds, though the contribution to seed removals from the majority of these species was negligible. Two disturbance specialists, P. fallax and E. ruidum, were disproportionately important seed dispersers in our study. From the perspective of plants, dispersal by these ant species can be beneficial if habitat alteration negatively impacts other dispersal vectors or if optimal germination and establishment sites are associated with ant nests.
ACKNOWLEDGEMENTS
This study is part of the PhD dissertation of TJZ at the University of Colorado – Boulder and was financially supported by the Organization for Tropical Studies, the Walker Van Riper Museum Grant from the University of Colorado, by Sigma Xi Grants-In-Aid student grant, and by the generous support from the Department of Ecology and Evolutionary Biology at the University of Colorado. We thank the Area de Conservacion Guanacaste for allowing us to work at Santa Rosa National Park. We also thank our field assistants Julia Richards, Chrissy Murphy, Larkin Carey, Jessica Vargas and Christie Chatterly, Melissa Geraghty for help with ant identifications, and Josh Sloane for help with ant body size measurements. The manuscript was greatly improved by comments from Ian Turner, Nathan Sanders and Martin Pfeiffer, along with two anonymous reviewers.