Introduction
Wolbachia is one of the most widespread maternally transmitted bacteria in invertebrates (Werren, Reference Werren1997). In addition to insects, Wolbachia also frequently infects mites (Breeuwer & Jacobs, Reference Breeuwer and Jacobs1996; Tsagkarakou et al., Reference Tsagkarakou, Gulllemaud, Rousset and Navajas1996; Gotoh et al., Reference Gotoh, Noda and Hong2003), spiders (Rowley et al., Reference Rowley, Raven and McGraw2004; Goodacre et al., Reference Goodacre, Martin, Thomas and Hewitt2006) and nematodes (Bandi et al., Reference Bandi, Anderson, Genchi and Blaxter1998; Fenn et al., Reference Fenn, Conlon, Jones, Quail, Holroyd, Parkhill and Blaxter2006). Especially, many nematodes infected with these bacteria are either the vectors or the causative agents of serious human diseases. There are various statuses of Wolbachia in their hosts. A single insect species or population may be infected with more than one symbiotic microorganism and different populations may have different infection statuses (Perrot-Minnot et al., Reference Perrot-Minnot, Guo and Werren1996; Werren et al., Reference Werren, Baldo and Clark2008). Moreover, in many hosts, Wolbachia trigger a phenomenon known as reproduction regulation by cytoplasmic incompatibility (CI), parthenogenesis, feminization, and male-killing (Hoffmann & Turelli, Reference Hoffmann, Turelli, O'Neill, Hoffman and Werren1997). Several reports noted that CI, the most common of the reproductive abnormalities, facilitated the ability of Wolbachia to invade host populations (Turelli, Reference Turelli1994; Sinkins, Reference Sinkins2004). Because various Wolbachia strains play different roles in manipulating their host reproduction, they may have different effects on their host's ecology and evolution.
In addition to reproduction regulation, Wolbachia also play an important role in their hosts’ fitness and population genetic variability. There is increasing evidence that Wolbachia may influence a host's evolutionary history, social organization, and population structure (Werren, Reference Werren1997; Jiggins, Reference Jiggins2003; Hurst & Jiggins, Reference Hurst and Jiggins2005). In the birdnest blowfly, Protocalliphora sialia, a particular Wolbachia strain was found to be associated with a particular mtDNA haplotype (Baudry et al., Reference Baudry, Bartos, Emerson, Whitworth and Werren2003). Moreover, Dean et al. (Reference Dean, Ballard, Glass, William and Ballard2003) revealed that selective sweeps significantly reduced mtDNA nucleotide diversity in infected vs. uninfected populations. Similarly, most other CI-associated Wolbachia sweeps were associated with low mtDNA variation in many hosts (Rasgon et al., Reference Rasgon, Cornel and Scott2006; Nunes et al., Reference Nunes, Nolte and Schlötterer2008; Raychoudhury et al., Reference Raychoudhury, Grillenberger, Gadau, Bijlsma, van de Zande, Werren and Beukeboom2010; Graham & Wilson, Reference Graham and Wilson2012; Xiao et al., Reference Xiao, Wang, Murphy, Cook, Jia and Huang2012). However, other studies suggested that symbionts may either reduce or increase mtDNA diversity (Shoemaker et al., Reference Shoemaker, Keller and Ross2003; Keller et al., Reference Keller, Windsor, Saucedo and Werren2004; Yu et al., Reference Yu, Zhang, Xue and Hong2011). Studies have shown that the relationships between Wolbachia and host mtDNA can be divided into four categories: (a) Wolbachia induce the decrease of mtDNA diversity; (b) Wolbachia do not cause changes in mtDNA diversity; (c) Wolbachia induce mtDNA mutations; and (d) Wolbachia induce the paraphyly of a single species based on mtDNA. Therefore, when using mtDNA as a maker of population genetic analyses, we should take into account the influence of Wolbachia.
Given the influence of Wolbachia on host biology and the potential impact of Wolbachia on host population genetic structure, studies on effects of the Wolbachia infections on their hosts are necessary. Earlier studies have indicated that many species of spider mites are infected with Wolbachia (Gotoh et al., Reference Gotoh, Noda and Hong2003; Grbić et al., Reference Grbić, Van Leeuwen, Clark, Rombauts, Rouzé, Grbić and Hernández-Crespo2011; Xie et al., Reference Xie, Chen and Hong2011; Zhu et al., Reference Zhu, Zhang, Zhang, Ge, Gotoh and Hong2012). Tetranychidae is one of the most important families of subclass Acari in terms of economic impact, because it contains several agricultural pest species of major relevance (Helle & Sabelis, Reference Helle and Sabelis1985; Baker & Tuttle, Reference Baker and Tuttle1994; Bolland et al., Reference Bolland, Gutierrez and Flechtmann1998; Zhang, Reference Zhang2003; Migeon et al., Reference Migeon, Nouguier, Dorkeld, Sabelis and Bruin2011). Tetranychidae species are wingless and usually rely on crawling for dispersal (Mitchell, Reference Mitchell1973), but many of them can also be carried long distances by wind and by human activities (Grafton-Cardwell et al., Reference Grafton-Cardwell, Granett and Normington1991). Several Wolbachia strains can induce CI in Tetranychus urticae, Tetranychus piercei, and Tetranychus turkestani (Breeuwer & Jacobs, Reference Breeuwer and Jacobs1996; Breeuwer, Reference Breeuwer1997; Zhu et al., Reference Zhu, Zhang, Zhang, Ge, Gotoh and Hong2012). To better control Tetranychidae pests, many studies have inferred the genetic structure (Navajas et al., Reference Navajas, Perrot-Minnot, Lagnel, Migeon, Bourse and Cornuet2002; Bailly et al., Reference Bailly, Migeon and Navajas2004; Sun et al., Reference Sun, Lian, Navajas and Hong2012). However, the studies on Tetranychus pueraricola were limited.
Since Wolbachia is one of the most widespread bacterium in insects, many studies increasingly focused on the transmission mode of Wolbachia in its host. Expect vertical transmission, Wolbachia is susceptible to horizontal transmission, although direct evidences are limited. A lack of evolutionary congruence between mtDNA haplotypes and Wolbachia indicated multiple infections and horizontal transmission have occurred between unrelated hosts (Ahmed et al., Reference Ahmed, De Barro, Ren, Greeff and Qiu2013; Zhang et al., Reference Zhang, Ding, Zhang and Hong2013a). Furthermore, extensive horizontal transmissions of Wolbachia can explain its temporal and spatial heterogeneity in infection prevalence (Kraaijeveld et al., Reference Kraaijeveld, Franco, Knijff, Stouthamer and Alphen2011). One approach to explore if horizontal transmission is occurring is to compare the evolutionary relationships of the endosymbionts and their host.
T. pueraricola was first found infesting kudzu vine and was described as a new species by Ehara & Gotoh (Reference Ehara and Gotoh1996). Previous studies indicated that T. pueraricola is highly polyphagous, but especially prefers leguminous plants. For example, they showed higher developmental rates and fecundity on soybean, kidney bean, and cowpea (Gotoh et al., Reference Gotoh, Suwa, Kitashima and Rezk2004). In addition, this species is similar to another mite, T. urticae Koch (red form) (Suwa & Gotoh, Reference Suwa and Gotoh2006). Recently, T. pueraricola was determined to be widely distributed on various plants and in many regions of China. However, the distribution of Wolbachia in T. pueraricola, and the effect on its host have not yet been tested.
The aim of this study was to address the following questions: (i) what is the distribution of Wolbachia in natural populations of T. pueraricola (ii) do Wolbachia induce CI in T. pueraricola (iii) whether there is a horizontal transmission of Wolbachia in T. pueraricola, and (iv) what is the main factor that influences the genetic differentiation of T. pueraricola? We examined Wolbachia diversity in 12 natural populations of T. pueraricola in China based on Wolbachia surface protein (wsp) sequences and multiple locus sequence typing (MLST) data. Additionally, we established laboratory cultures of wTpue1- and wTpue3-infected and uninfected lines to examine if these strains induce CI in T. pueraricola. To further understand the potential factors that influence genetic differentiation of T. pueraricola, we compared the effects of Wolbachia infection patterns and geographical distribution on host mtDNA and nuclear DNA diversity.
Materials and methods
Sample collection and DNA extraction
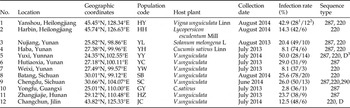
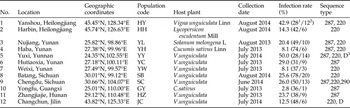
From 2013 to 2014, T. pueraricola adults were collected from 12 populations over a large area of China (table 1). At each locality, individuals were randomly collected in a 5 × 5 m2 square. Samples were preserved in absolute alcohol until extraction.
Tetranychus pueraricola sample and Wolbachia infection status details.
1 Total number of individuals.
2 Number of infected individuals.
3 Double-infected (287, 220).
Total genomic DNA was extracted from the entire spider mite with a DNeasy Blood and Tissue kit (Qiagen, Valencia, CA, USA) following the manufacturer's protocol. All specimens were placed in a 1.5-ml plastic tube with 180 µl lysis buffer and proteinase K, incubated at 56°C for 2 h or longer, and subjected to DNA purification with a DNeasy Tissue kit (Qiagen, Valencia, CA, USA). Total DNA was eluted with 100 µl of elution buffer.
Polymerase chain reaction (PCR) and sequencing
For each population, 28–78 adult mites were screened for the presence of Wolbachia strains. Wolbachia detection and identification were performed with the primers 81F (5′-TGGTCCAATAAGTGATGAAGAAAC-3′) and 691R (5′-AAAAATTAAACGCTACTCCA-3′) for wsp (Braig et al., Reference Braig, Zhou, Dobson and O'Neill1998). PCRs were performed on a Veriti machine (ABI Biosystems, Foster City, CA, USA) in a 25 µl reaction volume containing 0.2 µl Maxima Hot Start Taq polymerase (5 U µl−1, Fermentas), 2.5 µl 10 × Hot Start Taq Buffer (Fermentas), 2.5 µl MgCl2 (2 mM, Fermentas), 2.0 µl dNTPs (2.5 mM each, Takara), 1 µl of DNA (concentration not estimated), and 0.5 µl primer (20 µM each). Cycling conditions were 95°C for 3 min followed by 35 cycles of 95°C for 30 s, 54°C for 45 s, and 72°C for 1 min, with a final extension at 72°C for 10 min. Positive and negative controls were included in PCRs. After verification via gel electrophoresis, DNA from all Wolbachia-positive individuals were subjected to cloning and sequencing. For cloning, an AxyPrep DNA Gel Extraction kit (AxyGEN, USA) was used to purify amplified fragments and a Peasy-T3 Cloning kit (TransGen Biotech, Beijing, China) was used to ligate PCR products into the cloning vector. Three positive clones per individual were finally confirmed by direct sequencing.
Single-infection status was confirmed by analyzing the wsp sequences. Then, Wolbachia MLST analysis was undertaken using standard primers and PCR protocols for amplification of the five reported Wolbachia MLST genes (ftsZ, coxA, fbpA, hcpA, and gatB) (Baldo et al., Reference Baldo, Hotopp, Jolley, Bordenstein, Biber, Choudhury, Hayashi, Maiden, Tettelin and Werren2006). All MLST sequences were compared with entries in the PubMLST Wolbachia MLST database. Sequence type (ST) of Wolbachia strains was characterized by the allele number at five MLST loci. Strains with five identical alleles were considered the same ST.
The mitochondrial COI gene, which encodes cytochrome oxidase subunit I was amplified using the primers PCOI1F (5′-TTTTTATAGTGATACCAGCAA-3′) and PCOI1R (5′-CTCTAAAGATAGCAAATACGG-3′), PCOI2F (5′-GTTGATTTATGTTTTCCACGA-3′), and PCOI2R (5′-CTCTTAAAGATAGCAAATACGG-3′) by nested PCR. Due to the low amplification efficiency of one-step PCR, we choose another better amplification method—nested PCR, which can improve the experimental accuracy and sensitiveness. All PCRs were performed under the following cycling conditions: one cycle of 95°C for 3 min; 35 cycles of 95°C for 30 s, 47°C for 45 s, and 72°C for 1 min, and a final extension 72°C for 10 min.
The nuclear gene, which encodes 6-phosphofructokinase (PFK-6), was amplified using the primers Ngene1F (5′-ACAAGACACGAGAATCACCGTA-3′) and Ngene1R (5′-GAACGGCAGCATTCATACCAC-3′). The PCR cycles were as follows: one cycle of 95°C for 3 min; 35 cycles of 95°C for 30 s, 52°C for 30 s, and 72°C for 1 min, and a final extension at 72°C for 10 min. PCR products were electrophoresed on 1.5% agarose gels stained with ethidium bromide and visualized under UV transillumination. Amplified fragments were purified using a Gel Extraction Mini kit (Watson, Shanghai, China). Then, the distinct single-band amplicons were cloned into the pEasy-T3 vector (TransGen Biotech, Beijing, China), and the positive clones were screened and finally confirmed by direct sequencing.
DNA sequence and phylogenetic analysis
Sequences were aligned using Clustal W implemented in Mega 6 software (Tamura et al., Reference Tamura, Stecher, Peterson, Filipski and Kumar2013), and the alignment was manually edited with Bioedit software (Hall, Reference Hall1999). The COI sequences were collapsed into haplotypes using Collapse 1.2 (Posada, Reference Posada2004). Haplotype number, haplotype diversity (Hd), and nucleotide diversity (Pi) were calculated in DnaSP5.10 (Librado & Rozas, Reference Librado and Rozas2009). An intraspecific phylogeny of COI and nuclear gene haplotypes was inferred using the network algorithm median-joining in Network (Bandelt et al., Reference Bandelt, Forster and Röhl1999). All sequences have been deposited in the GenBank database. Phylogenetic analyses were estimation for a concatenated data set of MLST genes. Maximum Likelihood tree was constructed using MEGA6.0, with gamma-distributed rates with 1000 bootstrap replications, and the method of Jukes and Cantor as genetic distance model.
Analysis of genetic differentiation
Analysis of molecular variance (AMOVA) was used to formally assess and test the association among Wolbachia and the mtDNA sequences. Dataset 1 included all sequences from T. pueraricola and was subdivided into north populations (HH, HY, and JC) and south populations (YL, YH, YY, YC, YW, SB, SC, GY, and HZ). Dataset 2 was subdivided into sequences isolated from infected and uninfected T. pueraricola, infected sets included any kind of Wolbachia infection (wTpue1, wTpue2, wTpue3, and wTpue1 + wTpue3). The two structured datasets were then used to test whether mtDNA from T. pueraricola showed significant genetic differentiation relative to bacterial infection or geographic origin. Dataset 3 included all single-copy nuclear DNA sequences from T. pueraricola and was subdivided into north populations (HH, HY, and JC) and south populations (YL, YH, YY, YC, YW, SB, SC, GY, and HZ). Genetic differentiation was investigated by AMOVA and the related fixation index (Fst) as implemented in Arlequin3.1 (Excoffier & Lischer, Reference Excoffier and Lischer2010).
Preparation of spider mite lines
T. pueraricola infected with wTpue1 were collected from Anhui Province in 2014, and T. pueraricola infected with wTpue3 were collected from Jilin Province in 2014. Mites were reared on leaves of the common bean (Phaseolus vulgaris L.) placed on a water-saturated sponge mat in Petri dishes (dia. 9) at 25 ± 1°C, 70% relative humidity, and under L16–D8 conditions. Subsequently, we obtained 100% infected and 100% uninfected lines (Zhao et al., Reference Zhao, Chen, Ge, Gotoh and Hong2013).
Cross experiments
To reveal if wTpue1 and wTpue3 induce CI in T. pueraricola, four crosses were conducted (♀U × ♂U, ♀U × ♂I, ♀I × ♂U, and ♀I × ♂I). Each female at the last developmental stage before adult emergence was placed with two males. We used 1-day-old virgin males produced as a cohort by groups of females isolated as teliochrysalids. This procedure was designed to avoid the potential decrease of the Wolbachia effects due to male aging or other reasons. Males were removed 2 days after female eclosion, and mated females were allowed to oviposit for 5 days. Data were analyzed with one-way analysis of variance (ANOVA), and the means were compared using the Tukey-HSD test (SPSS 17.0).To normalize the data, log transformation was used for the number of eggs laid per female, and arcsine square root transformation was used for egg hatchability.
Results
Wolbachia infection rate and diversity
Examination of the 539 T. pueraricola female adults that were collected from 12 natural populations revealed that all populations were infected with Wolbachia. The infection rates of the populations varied from 2.8 to 50% (table 1).
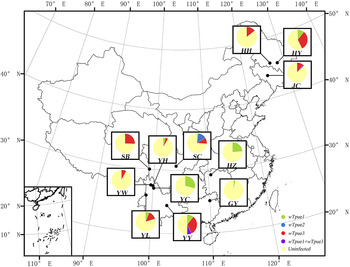
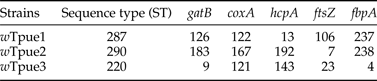
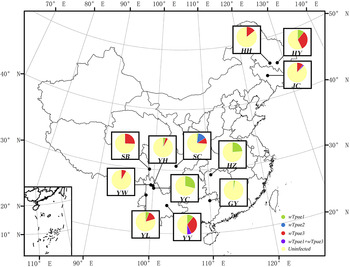
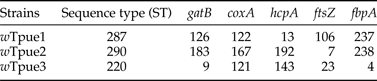
wsp sequence analysis revealed three strains: wTpue1, wTpue2 and wTpue3. Double infections were found only in YY and JC populations (table 1, fig. 1). Three sequence types (STs, corresponding to wsp sequence types) were revealed by MLST analyses (table 2) and were unambiguously assigned to supergroup B (Supplementary fig. S1).
Distribution and prevalence of Wolbachia variants in the examined populations of T. pueraricola. Each pie diagram shows the proportions of Wolbachia-infected and uninfected individuals in each geographic population.
MLST allelic profiles of Wolbachia detected from T. pueraricola.
Additionally, more remarkably, in the SC population (n = 50), individuals were single-infected with strain wTpue1, wTpue2, or wTpue3, but no individuals were double- infected (fig. 1).
mtDNA and nuclear DNA
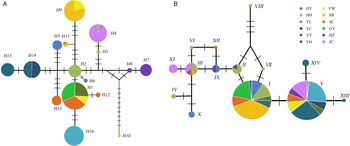
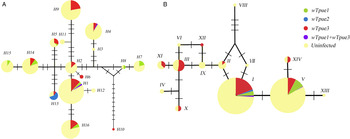
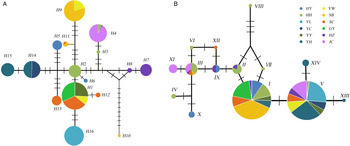
The COI sequences of 396 individuals were sequenced and revealed 16 haplotypes (GenBank: KU516055–KU516070). The SC population had the most number of haplotypes (H1, H11, H12, and H13), and the remaining populations had 1–3 haplotypes. Haplotype H1 was the most common and most widespread, and was found in four out of 12 populations studied. However, H4 was the only haplotype shared between southern and northern China (fig. 2A). Alternatively, single-copy nuclear DNA sequences (6-phosphofructokinase) revealed 14 haplotypes (GenBank: KU516071–KU516084). Haplotypes I and V were the most widespread haplotypes, and the HH population had the most haplotypes (I, II, III, IV, V, VI, VII, and VIII); haplotypes IV, VI, VII and VIII were only found in the HH population (fig. 2B).
Haplotype networks for populations based on (A) mitochondrial and (B) a single-copy nuclear gene of T. pueraricola. Different colors represented different geographic populations. Circles represent different haplotypes, and the size of each circle reflects the number of individuals with each haplotype. Bars on the branches refer to the number of mutations.
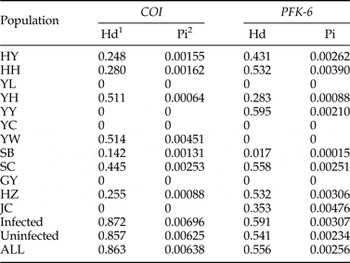
For these samples, haplotype and nucleotide diversity estimates calculated from the mtDNA and single-copy nuclear DNA sequence data for different populations, and infected and uninfected groups of T. pueraricola are presented in table 3. The average COI nucleotide and haplotype diversity values were estimated to be 0.00638 and 0.863, respectively. The molecular diversity of infected individuals was higher than the molecular diversity of the uninfected groups (infected Hd: 0.872, Pi: 0.00696; uninfected Hd: 0.857, Pi: 0.00625). Similarly, in nuclear DNA sequence analysis, haplotype and nucleotide diversity were higher in the infected group compared with the uninfected group (infected Hd: 0.591, Pi: 0.00307; uninfected Hd: 0.541, Pi: 0.00234).
Genetic variation in T. pueraricola populations from China.
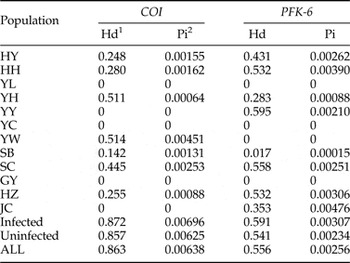
COI (mtDNA), PFK-6 (nuclear gene). For full site names and other details, see table 1.
1 Haplotype diversity.
2 Nucleotide diversity.
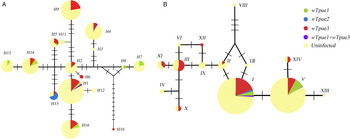
In the T. pueraricola populations sampled, mtDNA haplotype relationships were estimated as a network based on Wolbachia status (fig. 3A). There was a high level of COI variation among sequences. Moreover, there were 13 haplotypes in infected individuals and 14 haplotypes in uninfected individuals, and no clear relationship between Wolbachia status and mitochondrial haplotypes. Usually, the same Wolbachia strains existed in T. pueraricola individuals with divergent COI haplotypes. Moreover, based on the nuclear DNA haplotype results, there were eight haplotypes in infected individuals and 13 haplotypes in uninfected individuals (fig. 3B).
Haplotype networks for Wolbachia infection based on (A) mitochondrial and (B) a single-copy nuclear gene of T. pueraricola. Each haplotype is colored based on the proportion of individuals with each Wolbachia infection status. Circles represent different haplotypes, and the size of each circle reflects the number of individuals with each haplotype. Bars on the branches refer to number of mutations.
Population genetic differentiation
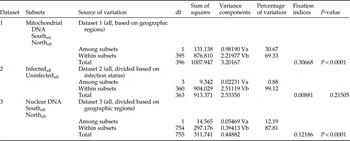
Analysis of mtDNA haplotype variation using AMOVA was performed (i) among all individuals, divided into geographic regions(south; north) and (ii) among all individuals, divided based on infection status (infected; uninfected). From dataset1, an AMOVA clearly showed significant differentiation among haplotypes from different geographical regions (south and north) (P < 0.0001) for all individuals (table 4), which indicates that there is a strong natural barrier to gene flow among these populations. However, when haplotype variation was partitioned between infected and uninfected individuals in dataset 2, the AMOVA results clearly showed absence of significant differentiation.
Datasets and AMOVA results for T. pueraricola.
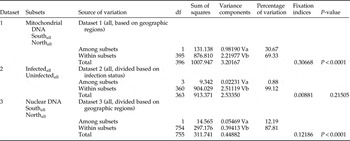
Furthermore, similar to the mtDNA for the nuclear DNA, AMOVA clearly showed significant differentiation among haplotypes from different geographical regions (Fst = 0.12186; P < 0.001) (table 4).
CI crossing experiments
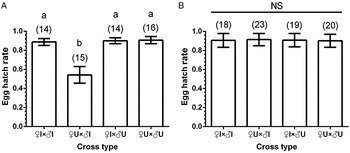
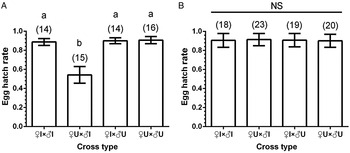
We found that wTpue1 induce a certain degree of CI, and the predicted incompatible cross (♀U × ♂I) showed a reduction in egg hatchability (fig. 4A). However, individuals infected with wTpue3 yielded different results. No significant differences were found between the predicted incompatible cross (♀U × ♂I) and the other compatible crosses (fig. 4B). Therefore, wTpue3 existed as a non-CI strain in this spider mite. Our results indicate that the two widespread Wolbachia strains have different effects on host reproduction.
CI resulting from crosses of two Wolbachia strains. Results are depicted as mean percent egg hatchability ± SE. Number of replicates for each of the nine cross types are shown in parentheses; a and b represent statistically different groups (Tukey-HSD test, P < 0.05); NS, not significant at the 5% level. A: wTpue1 strain; B: wTpue3 strain.
Discussion
In the current study, we investigated the infection rates of Wolbachia in 12 natural populations of T. pueraricola, and our results indicated that the rates of Wolbachia infection were lower than those in T. truncates (2.8–50% vs. 55.6–90%, respectively) (Zhang et al., Reference Zhang, Ding, Zhang and Hong2013a). However, in different geographic populations of T. pueraricola, Wolbachia infection rates also differed. We inferred that this may be associated with different invasion events, Wolbachia strains, region topography, climate, host genetic background, and Wolbachia transmission efficiency. For example, the infection prevalence in 2013 was lower than in 2014 (table 1). Similarly, Wolbachia prevalence was also found to differ among populations of the beetle Chelymorpha alternans (Keller et al., Reference Keller, Windsor, Saucedo and Werren2004) and the fire ant Solenopsis invicta (Ahrens & Shoemaker, Reference Ahrens and Shoemaker2005).
We then used MLST analysis to discover the diversity of Wolbachia strains in our samples. Our results revealed that three Wolbachia strains (wTpue1, wTpue2, and wTpue3) infected T. pueraricola, of these strains, wTpue1 and wTpue3 were widespread in China. However, wTpue2 was only present in the SC population. Four infection statuses were found in the examined mites, in addition to single infections for each strain, we also found double infection of strains of wTpue1 and wTpue3, which indicates that Wolbachia infection in T. pueraricola is complex. Moreover, we found several populations of T. pueraricola that contained more than one Wolbachia strain, which indicates that Wolbachia was introduced to T. pueraricola on multiple occasions. Similar phenomena have also observed in other arthropods (Kikuchi & Fukatsu, Reference Kikuchi and Fukatsu2003; Ros et al., Reference Ros, Fleming, Feil and Breeuwer2012; Symula et al., Reference Symula, Alam, Brelsfoard, Wu, Echodu, Okedi, Aksoy and Caccone2013; Zhang et al., Reference Zhang, Zhang, Sun, Yang, Ge and Hong2013b ). However, another potential cause of these results could be related to different effects of Wolbachia strains on their hosts.
Among insects, CI is a frequent reproductive effect of Wolbachia. Many studies showed that the CI levels induced by Wolbachia had great variability. Some of Wolbachia strains have neutral effects (they cannot induce CI); but several Wolbachia strains can induce extreme CI (Breeuwer, Reference Breeuwer1997; Perrot-Minnot et al., Reference Perrot-Minnot, Cheval, Migeon and Navajas2002; Vala et al., Reference Vala, Weeks, Claessen, Breeuwer and Sabelis2002; Gotoh et al., Reference Gotoh, Noda and Hong2003). In our analysis, we found that wTpue1 induced weak CI. However, wTpue3 did not induce CI. The three Wolbachia strains found in T. pueraricola all belong to supergroup B, but wTpue1 and wTpue3 were not closely related (Supplementary fig. S1), therefore we considered the CI level induced by Wolbachia to be strain-specific. In addition, host background can also influence CI level. For example, Wolbachia popcorn cannot induce CI in Drosophila melanogaster. However, after the same strain was transinfected into a novel host, Drosophila simulans, the strain induced strong CI expression (McGraw et al., Reference McGraw, Merritt, Droller and O'Neill2001).
The existence of CI was believed to be a driver that induces a decrease of mtDNA genetic diversity. However, the mtDNA Hd and Pi of the infected groups were higher than those of the uninfected groups in our study (infected: Hd: 0.872, Pi: 0.00696; uninfected: Hd: 0.857, Pi: 0.00625). Similar results were obtained based on single-copy nuclear DNA. These results are contrast with the previous findings in T. urticae and T. truncatus, in which Wolbachia reduced the mtDNA variation of infected mites (Yu et al., Reference Yu, Zhang, Xue and Hong2011; Zhang et al., Reference Zhang, Ding, Zhang and Hong2013a ). We formed some possibilities to explain this difference, different genetic background of mite host. On the other hand, the different abilities of various Wolbachia strains to manipulate host reproduction in different mites have an impact on the DNA diversity of the mitochondria. However, the lack of reduced diversity in T. pueraricola still needs to be elucidated. There are three potential reasons we hypothesized may lead to these results: (i) Firstly, the invasion time of Wolbachia, (a) Wolbachia have invaded in T. pueraricola for a long time. In our study, wTpue1 induced CI in T. pueraricola, CI would decrease gene flow between adjacent areas if these areas were infected with incompatible strains of bacteria. Thus, one scenario is the infections could be long-standing rather than recent. Another possibility is that although Wolbachia may have induced reduction of mtDNA diversity when it initially infected T. pueraricola, as time goes on, new mutations accumulated (Avise, Reference Avise2000; Marshall, Reference Marshall2004). This would mean that these Wolbachia infections have been maintained stably in the mites for a long period of time. (b) The lack of decreased diversity reflects the fact that these infections are recent, and there has thus not been sufficient time for selection against uninfected individuals to reduced mtDNA diversity. (ii) Secondly, the distribution of Wolbachia strains was found to be very complex in our study. We found three different Wolbachia strains and four infection statuses. In many populations, there were two or three Wolbachia infection statuses. Although a selective sweep associated with one strain may reduce the diversity of mtDNA, high levels of diversity may be maintained within the population as a whole across the different infection statuses and strains the population harbors (Hurst & Jiggins, Reference Hurst and Jiggins2005). (iii) Finally, in our study, because wTpue1 induced CI but wTpue3 did not, the low levels of reproduction regulation caused by the two widespread Wolbachia strains have different effects on the selection of their hosts’ mtDNA haplotypes. However, given the low levels of CI, the association between Wolbachia and mtDNA may be a consequence of apparent coevolution and not of a selective sweep or there was a weak selective sweep. Meanwhile, the presence of non-CI wTpue3 indicated that this strain may have other effects or the infection could be recent. The exact reasons should be evaluated in future studies.
Our study found that mtDNA haplotype data were highly polymorphic, in total, 16 different haplotypes were detected. However, the haplotype data were not concordant with Wolbachia infection status. Hurst & Jiggins (Reference Hurst and Jiggins2005) revealed that the association between Wolbachia and its host would be lost if horizontal transmission of Wolbachia occurs. We discovered the phenomenon of double infection within the same individual, and many mtDNA haplotypes shared between the infected and uninfected populations, suggesting horizontal transmission of Wolbachia or Wolbachia undergone an incomplete vertical transmission in T. pueraricola. In addition, both infected group and uninfected groups shared the same haplotypes; therefore, we inferred that correlation between haplotype and infection type may have degraded with the accumulation of mtDNA mutations and strain loss (Solignac et al., Reference Solignac, Vautrin and Rousset1994; Turelli, Reference Turelli1994; James et al., Reference James, Dean, McMahon and Ballard2002). However, another scenario is that there was incomplete transmission of Wolbachia.
AMOVAs of mtDNA and the single-copy nuclear gene showed significant genetic differentiation between southern and northern populations. Moreover, pairwise estimates of Fst calculated between pairs of populations showed that most tests for population differentiation were significant (Supplementary table S1). Geographic barriers may play an important role in genetic differentiation. We observed high Fst values among T. pueraricola population pairs, even among populations within very close distances, which indicated strong genetic structure that corresponds to small-scale geographic breaks. For example, samples were collected from different regions with variable mountain landscapes and climatic conditions, which influence population expansion and contraction, which have resulted in the relative lack of sharing of mitochondrial haplotypes among regions. We also found single haplotypes in populations, especially for mtDNA; this may have occurred because the mitochondrial genome has a smaller effective population size than that of an average nuclear locus, and the rate of genetic drift was therefore increased in mtDNA (Fay & Wu, Reference Fay and Wu1999; Sakamoto et al., Reference Sakamoto, Hirai, Tanikawa, Yago and Ishii2015).
In conclusion, we provided a comprehensive overview of the infection status and reproductive effect of Wolbachia relative to the genetic diversity of T. pueraricola in China. Our study revealed that Wolbachia infection statuses varied in T. pueraricola. Additionally, the effects of Wolbachia are strain-dependent. The wTpue1 strain can induce CI; however, wTpue3 cannot. Moreover, Wolbachia did not dramatically reduce the mtDNA haplotype and nucleotide diversity. The T. pueraricola population differentiation based on mitochondrial and nuclear markers can be best explained by differing demographic histories rather than a Wolbachia-associated selective sweep.
SUPPLEMENTARY MATERIAL
The supplementary material for this article can be found at http://dx.doi.org/10.1017/S0007485316000444.
Acknowledgements
We thank Jia Zhang and Xu Zhang of the Department of Entomology, Nanjing Agricultural University (NJAU) for help with the collection of spider mites. We are grateful to Dr Jin-Tao Sun of NJAU for his generous help with data analyses. This work was supported by a grant-in-aid from the Science and Technology Program of the National Public Welfare Professional Fund (201103020) from the Ministry of Agriculture of China, and a grant-in-aid for scientific research (31371944) from the National Natural Science Foundation of China.