1. Introduction
Recent geochemical investigations, especially from northern Europe and North America, have demonstrated that δ13C chemostratigraphy has great potential for the local, regional and global correlation of the Upper Ordovician sedimentary sequences (e.g. Saltzman et al. Reference Saltzman, Bergström, Huff and Kolata2003; Ainsaar et al. Reference Ainsaar, Meidla and Martma2004a, Reference Ainsaar, Meidla and Tinnb; Kaljo et al. Reference Kaljo, Hints, Martma, Nõlvak and Oraspõld2004, Reference Kaljo, Martma and Saadre2007, Reference Kaljo, Hints, Männik and Nõlvak2008; Saltzman & Young, Reference Saltzman and Young2005; Young et al. Reference Young, Saltzman, Ausich, Desrochers and Kaljo2005; Ainsaar et al. 2007, Reference Ainsaar, Kaljo, Martma, Meidla, Mannik, Nolvak and Tinn2010; Bergström et al. Reference Bergström, Young, Schmitz and Saltzman2007, Reference Bergström, Chen, Schmitz, Young, Rong and Saltzman2009b, Reference Bergström, Agematsu and Schmitz2010a, Reference Bergström, Young and Schmitzb, Reference Bergström, Kleffner and Schmitz2012, Reference Bergström, Eriksson, Young, Ahlberg and Schmitz2014, Reference Bergström, Saltzman, Leslie, Ferretti and Young2015, Reference Bergström, Eriksson, Schmitz, Young and Ahlberg2016, Reference Bergström, Bruton, Schmitz and Terfelt2017; Fan et al. Reference Fan, Peng and Melchin2009, Reference Fan, Bergström, Lu, Zhang, Zhang, Li and Deng2015; Young et al. Reference Yang2010; Gorjan et al. Reference Gorjan, Kaiho, Fike and Chen2012; Husinec & Bergström, Reference Husinec and Bergström2015; Jones et al. Reference Jones, Creel and Rios2016; Kaljo et al. Reference Kaljo, Martma and Saadre2017; Bergström & Kleffner, Reference Bergström and Kleffner2018). Several Late Ordovician prominent positive δ13C excursions have been recognized and named from both North America and Baltoscandia (Saltzman et al. Reference Saltzman, Bergström, Huff and Kolata2003; Bergström et al. Reference Bergström, Saltzman and Schmitz2006, Reference Bergström, Young, Schmitz and Saltzman2007, Reference Bergström, Young and Schmitz2010b; Ainsaar et al. Reference Ainsaar, Kaljo, Martma, Meidla, Mannik, Nolvak and Tinn2010; Leslie et al. Reference Leslie, Saltzman, Bergström, Repetski, Seward, Gutiérrez-Marco, Rábano and García-Bellido2011). Aside from two very conspicuous excursions, namely the early Katian Guttenberg carbon isotope excursion (GICE) and the Hirnantian carbon isotope excursion (HICE), five subdominant Katian excursions are characteristic and intercontinentally correlatable (Bergström et al. Reference Bergström, Young, Schmitz and Saltzman2007, Reference Bergström, Young and Schmitz2010b, Reference Bergström, Saltzman, Leslie, Ferretti and Young2015; Ainsaar et al. Reference Ainsaar, Kaljo, Martma, Meidla, Mannik, Nolvak and Tinn2010; Bergström & Kleffner, Reference Bergström and Kleffner2018).
Carbon isotope chemostratigraphy of the Ordovician is still in the pioneer phase of development in China, especially compared with the large number of studies carried out in North America and northern Europe. The work on the Late Ordovician δ13C isotopes within China has focused on the GICE (Bergström et al. Reference Bergström, Chen, Schmitz, Young, Rong and Saltzman2009b; Munnecke et al. Reference Munnecke, Zhang, Liu and Cheng2011; Fan et al. Reference Fan, Bergström, Lu, Zhang, Zhang, Li and Deng2015; Liu et al. Reference Liu, Qi, Liu, Luo, Shao, Luo and Zhang2016a; Zhang & Munnecke, Reference Zhang, Trela, Jiang, Nielsen and Shen2016) and the HICE (Wang et al. Reference Wang, Chatterton and Wang1993, Reference Wang1997, Reference Wang, Orth, Attrep, Chatterton, Wang and Li2008; X Chen et al. Reference Chen, Rong, Fan, Zhan, Mitchell, Harper, Melchin, Peng, Finney and Wang2006; Fan et al. Reference Fan, Peng and Melchin2009; Yan et al. Reference Wang and Yang2009; Zhang et al. Reference Zhang, Zhang, Yuan and Xiao2009; Gorjan et al. Reference Gorjan, Kaiho, Fike and Chen2012; Liu et al. Reference Liu, Li, Algeo, Fan and Peng2016b; C Chen et al. Reference Chen, Wang, Algeo, Wang, Tu, Wang and Yang2017), whereas far less information is available for the other Katian positive carbon isotope excursions between these two prominent ones. A possible Whitewater excursion, identified both in the Jiangnan Region of South China (Munnecke et al. Reference Munnecke, Zhang, Liu and Cheng2011) and in the northeastern Tarim Basin of NW China (Zhang & Munnecke, Reference Zhang, Trela, Jiang, Nielsen and Shen2016), is the first documentation for the mid–late Katian carbon-isotope excursions in China. The main reason for this phenomenon is that China is short of stratigraphically complete carbonate successions of Katian age.
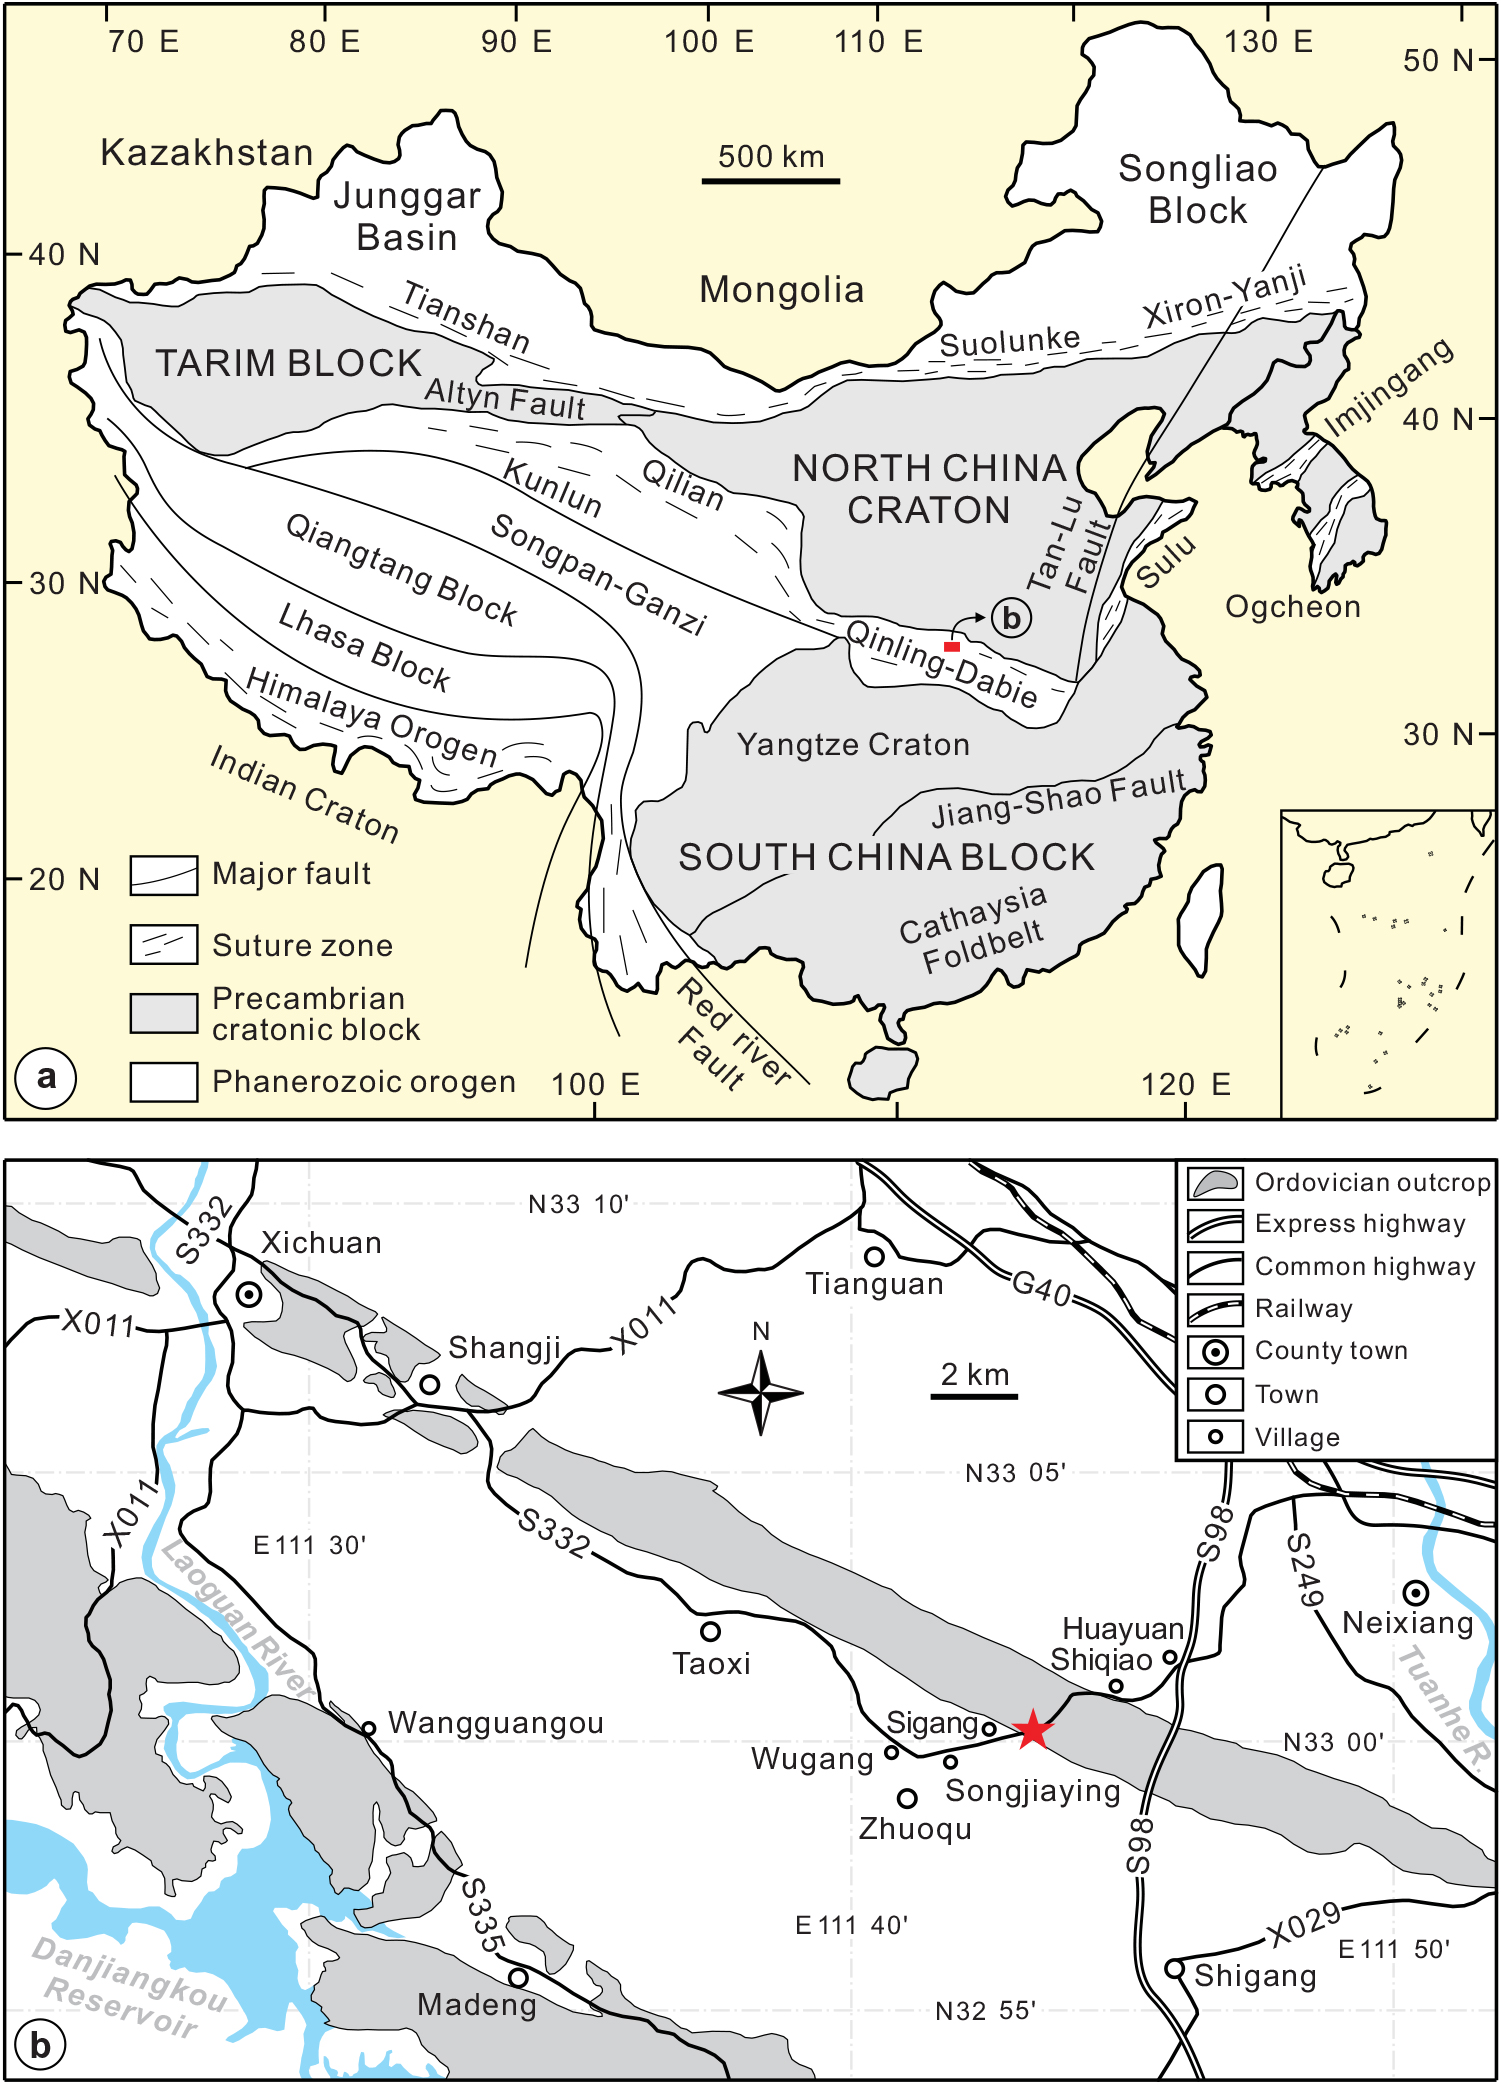
The Neixiang area, Henan Province, central China, (Fig. 1a) is the exception to the lack of Katian carbonate-dominated strata within China, and here calcareous facies in platform setting of mid–late Katian age are extensively developed. The Shiyanhe Formation in the Neixiang area represents the most stratigraphically continuous middle to late Katian carbonate succession in China (Rong et al. Reference Rong, Zhan, Wang, Huang, Tang and Luan2015; Jing et al. Reference Jing, Stouge, Ding, Wang and Zhou2017). Therefore, the Shiyanhe Formation is considered suitable for assessing the middle to late Katian δ13C chemostratigraphy. The major objective of the present paper is to investigate the carbon-isotope pattern of the Katian Shiyanhe Formation, and to produce a biostratigraphically calibrated δ13Ccarb curve for this stratigraphic interval in China.
Location map of the study section showing (a) the simplified geology of China (from Zheng et al. Reference Zhang and Munnecke2013), and (b) the distribution of Ordovician outcrops in the Neixiang area and the location of the Sigang section. Red star represents the locality of the Sigang section.

2. Geological setting
The Neixiang area lies within the eastern section of the Qinling Orogen, which is located in central China (Fig. 1a). To the south, the Qinling Orogen is separated from the South China Block by the Mianlue suture zone and to the north it is separated from the North China Craton by the Shangdan suture zone (Zhang et al. Reference Zhang1996). The Qinling Orogen is a composite continental orogen that experienced prolonged and multiphase orogenesis and played an important role in the formation and evolution of the China continent (Zhang et al. Reference Zhang1996, Reference Zhang, Meng, Zhou and Guo2001; Zhang, Reference Young, Saltzman, Bergström, Leslie and Xu2015). The Precambrian basement of the Qinling region is composed of late Palaeoproterozoic gneisses, and formed a northern part of the Yangtze Craton. From the Neoproterozoic to the end of the Silurian, the Qinling region remained attached to the Yangtze Craton. In the Early Devonian the Qinling region began to break off from the Yangtze Craton and then developed into an isolated ‘microplate’ along with the formation of the limited Mianlue Ocean. The separation from the Yangtze Craton continued until the Triassic, when the closure of the Mianlue palaeo-ocean occurred. During the Indosinian tectonic epoch (Middle–Late Triassic), the Qinling region accreted to the Yangtze Craton and was completely uplifted after the Middle Triassic. After the Middle Triassic, the Qinling region remained unsettled and was affected by several intra-plate tectonic events (Zhang et al. Reference Zhang1996, Reference Zhang, Meng, Zhou and Guo2001; Zhang, Reference Young, Saltzman, Bergström, Leslie and Xu2015).
The Qinling region has long been interpreted as the northern margin of the Yangtze Craton during the Ordovician period (Mu et al. Reference Mu, Li, Ge, Chen, Ni and Lin1981; Wang, Reference Trotter, Williams, Barnes, Lecuyer and Nicoll1985; Liu & Xu, Reference Liu and Xu1994; Zhang et al. 1996, Reference Zhang, Meng, Zhou and Guo2001; Ma et al. Reference Ma, Chen and Wang2009; Dong et al. Reference Dong, Zhang, Neubauer, Liu, Genser and Hauzenberger2011; Zhang, Reference Young, Saltzman, Bergström, Leslie and Xu2015; Rong et al. Reference Rong, Zhan, Wang, Huang, Tang and Luan2015). However, the region at that time was unstable and composed of a series of east–west, long and narrow submarine highs and rifts (Yang, Reference Yan, Chen, Wang, Wang and Wang1985; Rong et al. Reference Rong, Zhan, Wang, Huang, Tang and Luan2015). Such a tectonic setting was responsible for the Ordovician lithofacies distribution in this region. The Neixiang area was situated at the northernmost high during the Ordovician, and represents shallow-water platform facies composed of a mixture of carbonate and clastic deposits.
3. Lithostratigraphy and biostratigraphy
Rong et al. (Reference Rong, Zhan, Wang, Huang, Tang and Luan2015) reviewed the Upper Ordovician lithostratigraphic framework of the Neixiang area and referred the Upper Ordovician strata to the Yangzhuangcun, the Shiyanhe and the Liujiapo formations in ascending order. The Shiyanhe Formation consists of c. 186 m, primarily of limestone with minor mudstone. The Yangzhuangcun and the Liujiapo formations are composed predominantly of siliciclastic sedimentary rocks, and have thicknesses of c. 180 m and c. 77 m respectively. The three formations are deposited in continuity, whereas the whole succession disconformably overlies the Lower Ordovician Zuoqu Formation and is disconformably overlain by the Silurian (Llandovery) Zhangwan Formation.
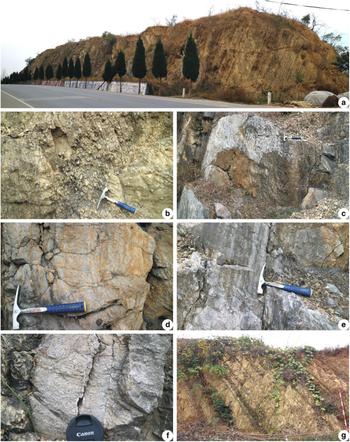
The most complete succession of the Shiyanhe Formation in the Neixiang area crops out at the Sigang section, which is located c. 12 km southwest of the county town of Neixiang (Fig. 1b). In this section the Shiyanhe Formation is exposed continuously in the road cuts along Highway S332 (Fig. 2a). The lower 44.5 m (beds 0–5) of the formation consists of yellow, thick-bedded calcareous mudstone with grey thin beds of limestone nodules (Fig. 2b); the middle 93.5 m (beds 6–20) is composed mainly of grey thick- to medium-bedded limestone interbedded with yellowish mudstone (Fig. 2c–f); the upper division (beds 21–26) is 48 m thick and is characterized by grey-yellow mudstone with intercalations of dark-grey, thin-bedded limestone (Fig. 2g).
Outcrop-scale features of the Sigang section. (a) Panoramic view of the main part of the section (younger is more distant, border trees are c. 3.5 m tall); (b) yellowish thick-bedded calcareous mudstone with greyish limestone nodules of bed 5 at c. 36 m above the base of the Shiyanhe Formation; (c) grey thick-bedded limestone of bed 6, c. 46 m above the base of the Shiyanhe Formation (hammer for scale); (d) greyish burrowed limestone of bed 10, at c. 61 m above the base of the Shiyanhe Formation; (e) grey laminar algal limestone of bed 10 at c. 65 m above the base of the Shiyanhe Formation; (f) greyish bioclastic limestone at the lowermost bed 14, c. 94 m above the base of the Shiyanhe Formation (lens cap = 6 cm); (g) overview of bed 26 (c. 179–184 m above the base of the Shiyanhe Formation), which is composed of intercalated yellow medium-bedded mudstones and grey thin-bedded argillaceous limestones (measuring rod = 2 m).

Biostratigraphic investigations of conodonts from the Shiyanhe Formation in the Sigang section have been successively carried out since the 1980s (Pei & Cai, Reference Pei and Cai1987; Liu et al. Reference Liu, Wang, Zhang and Du1991; Mei, Reference Mei1995; Wang et al. Reference Wang, Yan and Li2011; Jing et al. Reference Jing, Stouge, Ding, Wang and Zhou2017). However, the conodont biostratigraphic frameworks proposed by Pei & Cai (Reference Pei and Cai1987), Liu et al. (Reference Liu, Wang, Zhang and Du1991) and Mei (Reference Mei1995) are somewhat contradictory, which made the correlation of the Shiyanhe Formation debatable (Rong et al. Reference Rong, Zhan, Wang, Huang, Tang and Luan2015; Jing et al. Reference Jing, Stouge, Ding, Wang and Zhou2017). In order to provide a precise relative age for the Shiyanhe Formation, Jing et al. (Reference Jing, Stouge, Ding, Wang and Zhou2017) reassessed the conodont biostratigraphy based on a collection of more than 8800 identified conodont specimens from the Sigang section. The biozonal succession introduced by Jing et al. (Reference Jing, Stouge, Ding, Wang and Zhou2017) comprises, in upward order, the Oulodus ulrichi Biozone, the Oulodus robustus Biozone, the Aphelognathus grandis Biozone and the Aphelognathus divergens Biozone.
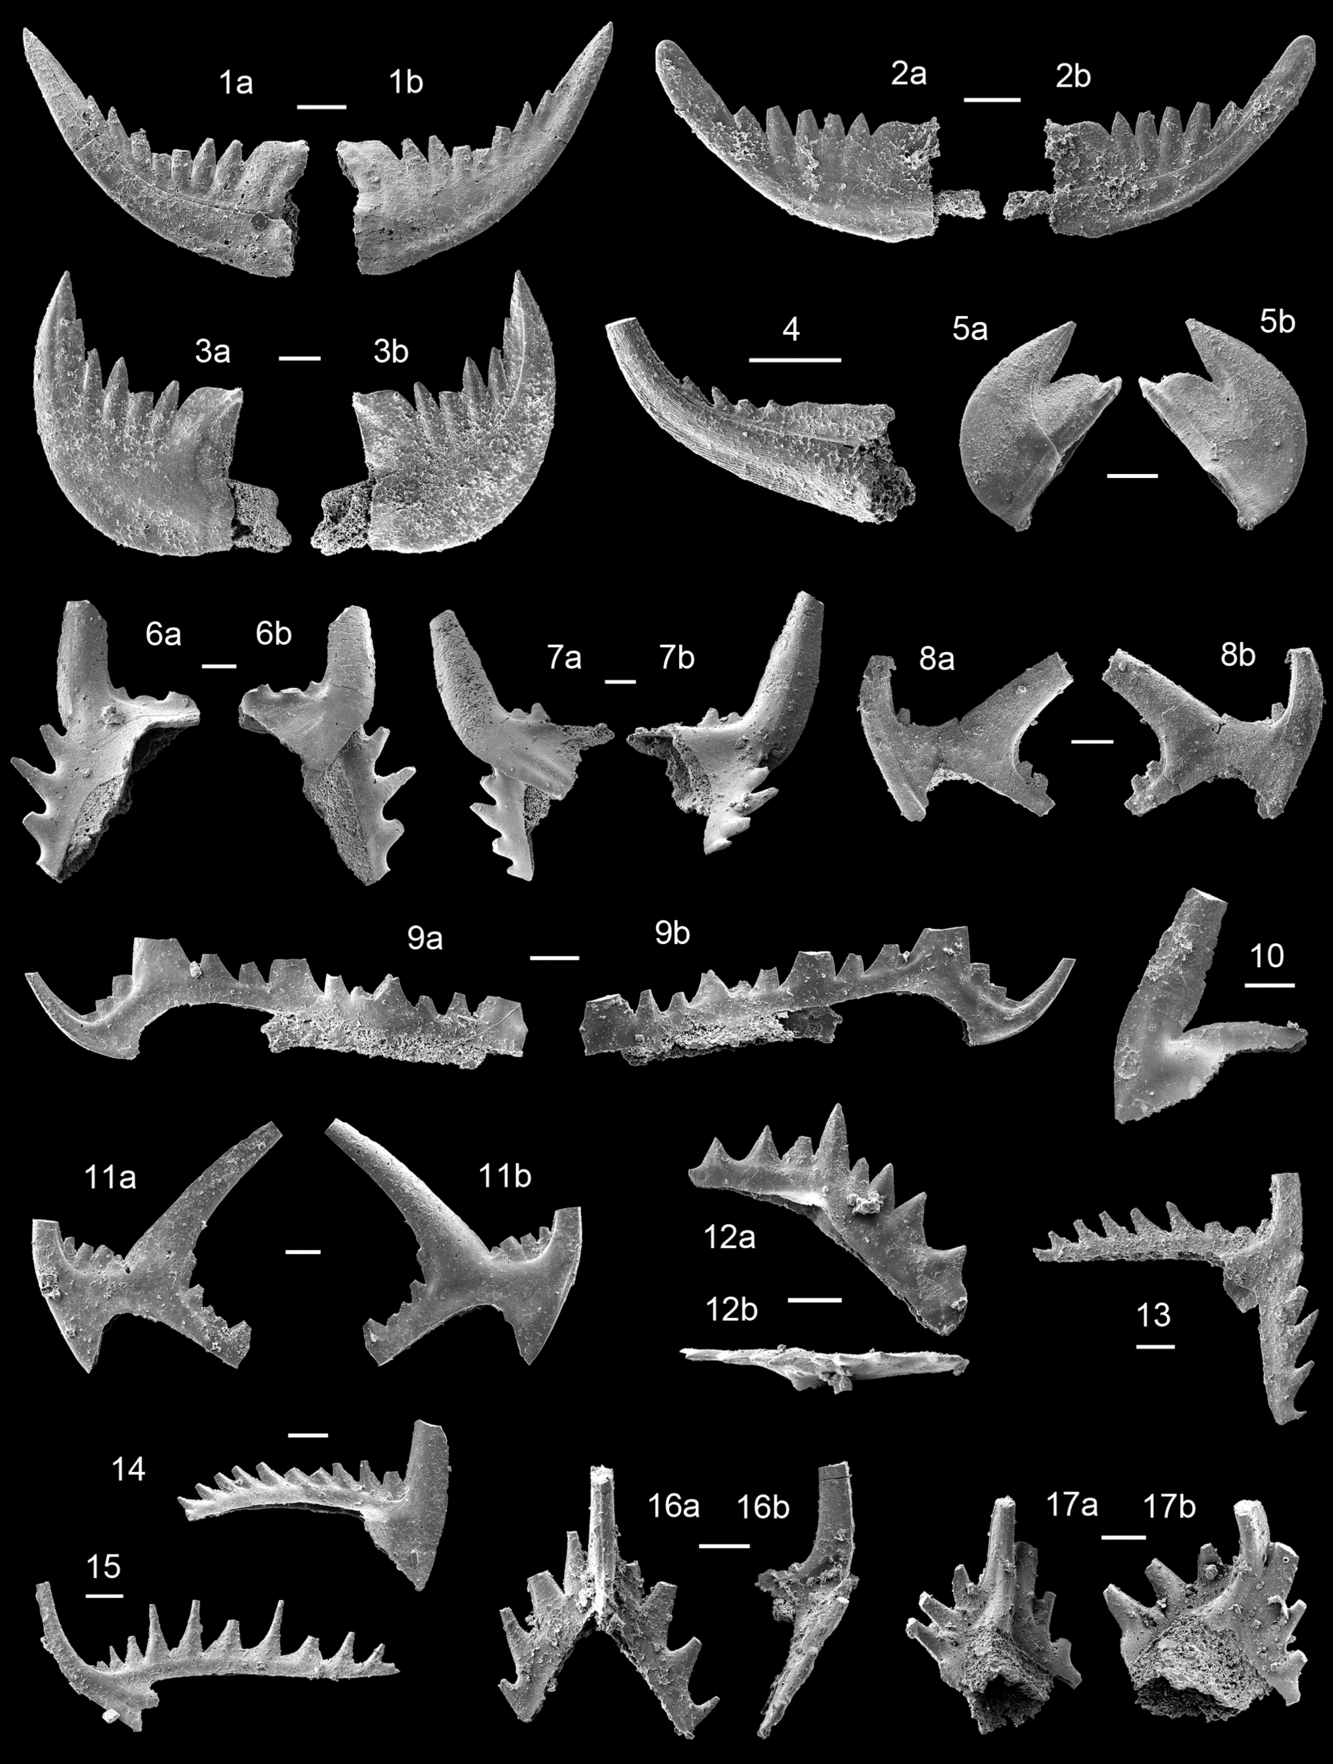
It should be noted that the stratigraphic range of the above-mentioned zonal species Oulodus ulrichi strides across the Belodina confluens Biozone and the Oulodus velicuspis Biozone (Sweet, Reference Zhu, Yu, Huang, Chu and Lu1988). Considering that in the Sigang section, Oulodus velicuspis is absent but Belodina confluens (Fig. 3) is abundant in the basal part of this unit, it is better to revise the Oulodus ulrichi Biozone as the Belodina confluens – Oulodus ulrichi Biozone (Fig. 4). Thus, the base of the Shiyanhe Formation can be correlated with the Belodina confluens Biozone of the North American Midcontinent succession.
Additional key taxa of conodonts from the Sigang section. Scale bars represent 100 μm. (1–5) Belodina confluens Sweet, Reference Sweet1979: (1) grandiform (S2) element from sample 16-1, inner and outer lateral views; (2) grandiform (S2) element from sample 4-1, outer and inner lateral views (note its blunt cusp); (3) compressiform (S1) element from sample 5-1, outer and inner lateral views; (4) dispansiform (S3) element from sample 2-1, inner lateral view; (5) eobelodiniform (M) element from sample 7-1, outer and inner lateral views. (6–11) Phragmodus undatus Branson & Mehl, Reference Branson and Mehl1933: (6) Pa element from sample 14-2, inner and outer lateral views; (7) Pb element from sample 14-2, outer and inner lateral views; (8) Sb element from sample 6-1, inner and outer lateral views; (9) Sa element from sample 5-2, lateral views; (10) M element from sample 5-2, inner lateral view; (11) Sc element from sample 5-2, outer and inner lateral views. (12–17) ‘Plectodina’tenuis (Branson & Mehl, Reference Branson and Mehl1933): (12) Pa element from sample 25-1, lateral and upper views; (13) Pb element from sample 2-1, inner lateral view; (14) M element from sample 5-2, inner lateral view; (15) Sc element from sample 25-1, inner lateral view; (16) Sa element from sample 25-1, posterior and lateral views; (17) Sb element from sample 15-1, posterior and postero-lateral views.

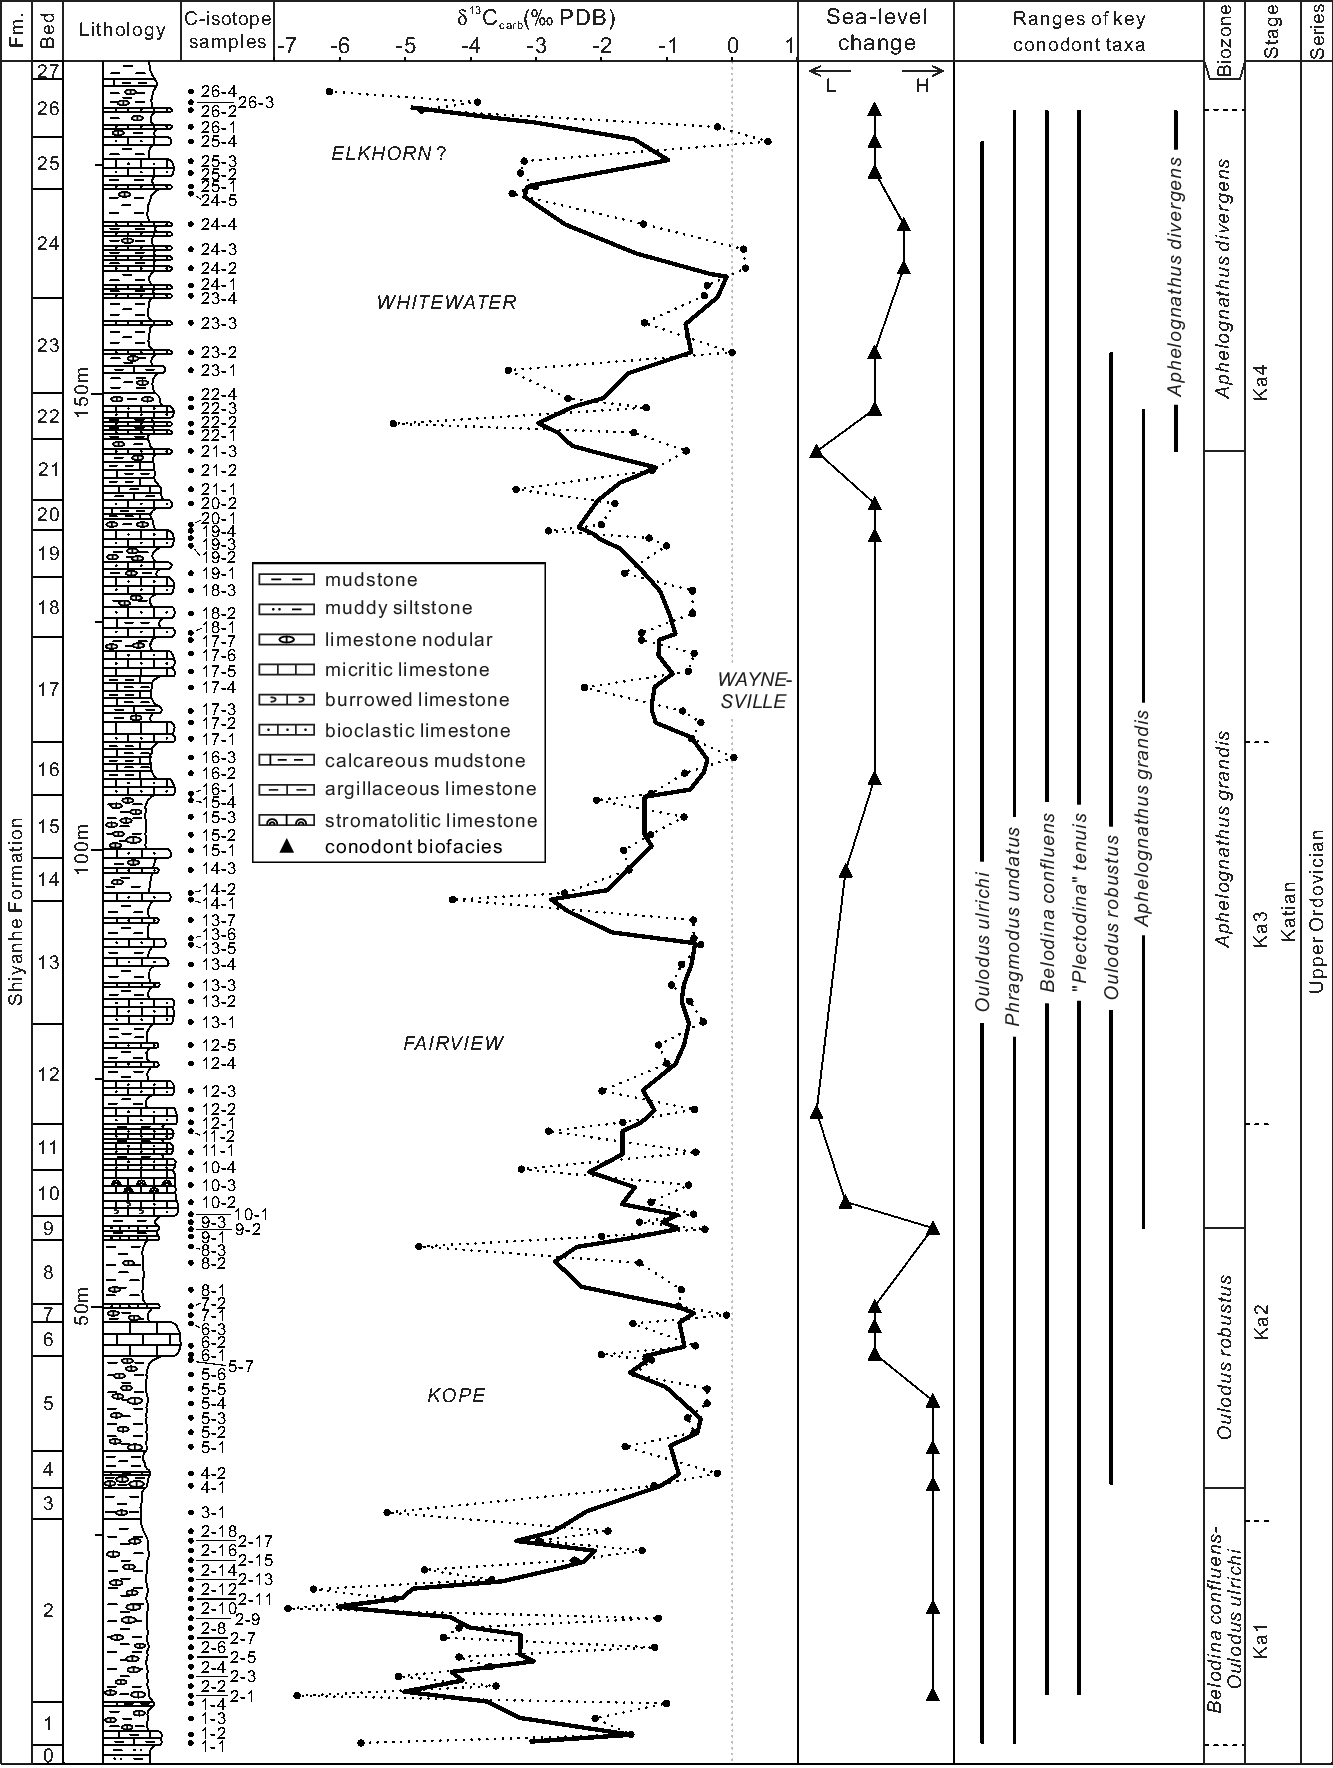
Stratigraphic framework of the Sigang section, central China, showing the detailed measured section with the positions of investigated carbon isotope samples, δ13Ccarb data, sketchy sea-level variations based on the turnovers of conodont biofacies, ranges of key conodont taxa, and bio- and chronostratigraphic subdivisions. Sea-level changes from Jing et al. (Reference Jing, Stouge, Ding, Wang and Zhou2017), and conodont zonation modified after Jing et al. (Reference Jing, Stouge, Ding, Wang and Zhou2017). Subdivision of the Katian Stage into stage slices follows Bergström et al. (Reference Bergström, Chen, Gutiérrez-Marco and Dronov2009a) and Cooper & Sadler (Reference Cooper, Sadler, Gradstein, Ogg, Schmitz and Ogg2012). Thick black line in δ13Ccarb column represents a three-point moving average of the δ13Ccarb data.

4. Material and methods
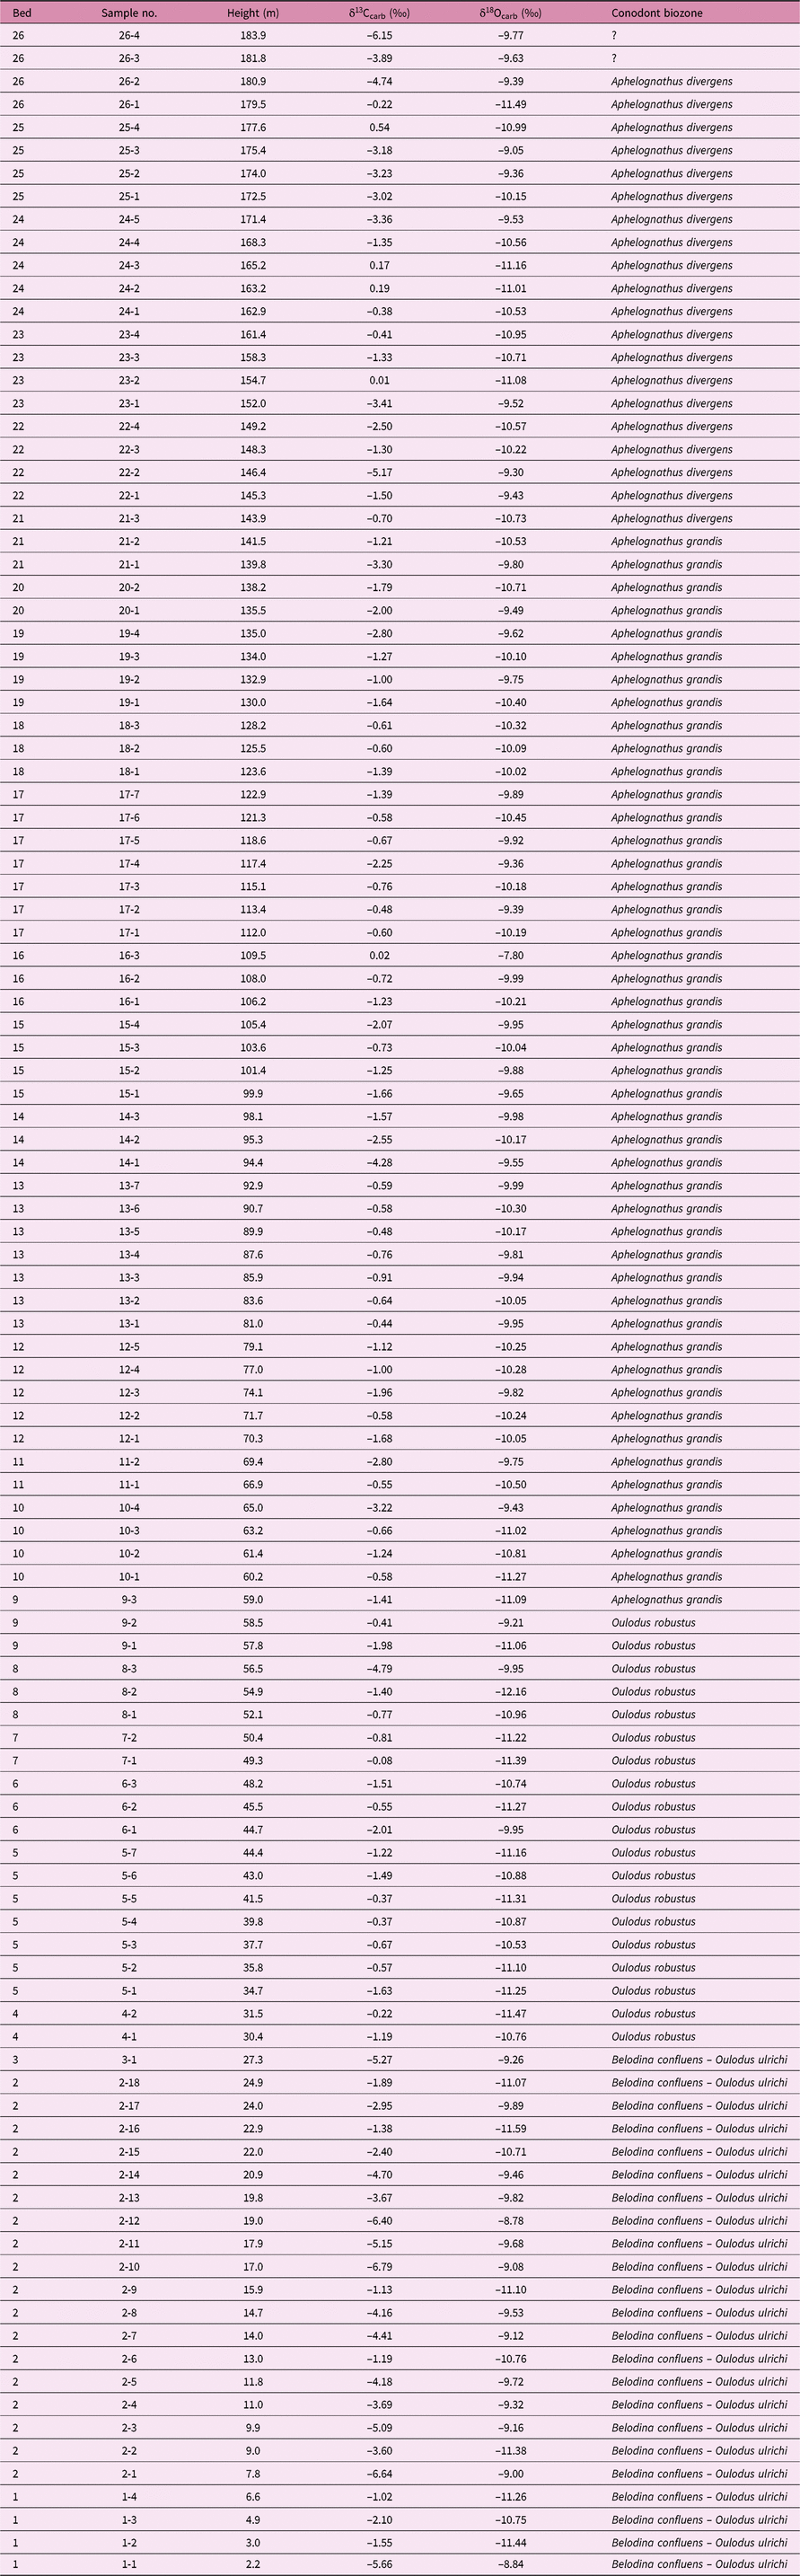
The carbonates of the Shiyanhe Formation in the Sigang section, Neixiang County, Henan Province, central China, are suitable for carbon chemostratigraphic analysis. During two separate field trips in 2014 and in 2015, 111 carbonate samples were collected from this section for a δ13Ccarb investigation (Fig. 4). The sampling intervals range from 0.3 m to 3.1 m, with an average of 1.6 m. Samples were checked in the field with hydrochloric acid for their carbonate content, and were micro-drilled in the laboratory from freshly broken surfaces for the δ13C analyses. Lime mudstones (micrite) were preferentially collected and sampled, but in intervals where only wackestone or packstone were available the micritic matrix was micro-drilled.
The δ13Ccarb values were measured in the Laboratory of Stable Isotopes in Nanjing Institute of Geology and Palaeontology, China. Powders for δ13C analyses were first weighted and heated for at least 5 hours in a vacuum oven at 105 °C, in order to remove water and volatile organic contaminants. Between 0.1 and 0.5 mg of carbonate was dissolved with anhydrous phosphoric acid at 25 °C for 24 hours on a Kiel Carbonate Device IV. The resulting CO2 gases were analysed for δ13C and δ18O using a Thermo Fisher MAT-253 mass spectrometer. The analysis results were reported in the δ notation relative to the Pee Dee Belemnite (PDB) standard. GBW-04405 was selected as a standard sample. Standard deviation is better than ±0.03 ‰ for δ13C and ±0.08 ‰ for δ18O. The complete carbon and oxygen isotopic data are presented in Table 1. Only the δ13Ccarb values are used for chemostratigraphy.
δ13Ccarb and δ18Ocarb data from the Sigang section

5. Results
The δ13Ccarb record from the Shiyanhe Formation in the Sigang section exhibits mostly negative values (Fig. 4). The δ13Ccarb data strongly scatter between –6.79 ‰ and –1.02 ‰ through the main part of the Belodina confluens – Oulodus ulrichi Biozone. This is followed by a pronounced increase from –5.27 ‰ at the upper Belodina confluens – Oulodus ulrichi Biozone (bed 3) to –0.22 ‰ at the basal Oulodus robustus Biozone (bed 4). In the principal part of the Oulodus robustus Biozone, the isotope values fluctuate between –2.01 ‰ and –0.08 ‰. This is followed by a decline to –4.79 ‰ in sample 8-3, i.e. at the level just below the top of the Oulodus robustus Biozone (Fig. 4). The δ13Ccarb values increase rapidly to –0.41 ‰ at the uppermost Oulodus robustus Biozone (bed 9) but then vary between –3.22 ‰ and –0.55 ‰ in the lowermost part of the Aphelognathus grandis Biozone (bed 10 to the lower part of bed 12) until they show an increase from –1.96 ‰ to –0.44 ‰, which is followed by minor fluctuations between –0.91 ‰ and –0.48 ‰ in the lower Aphelognathus grandis Biozone (i.e. the middle of bed 12 to bed 13). At the base of bed 14 (around the middle of the Aphelognathus grandis Biozone), the δ13Ccarb values drop sharply, reaching a value of –4.28 ‰ in sample 14-1. A pronounced shift toward positive values is present in the middle part of the Aphelognathus grandis Biozone (beds 14–16), with δ13Ccarb values reaching a maximum of +0.02 ‰ at the top of bed 16. A fall to values of –3.30 ‰ can be observed in the uppermost part of the Aphelognathus grandis Biozone (lower part of bed 21). δ13Ccarb values in the topmost metres of the Aphelognathus grandis Biozone and the Aphelognathus divergens Biozone range between –5.17 ‰ and +0.54 ‰, with three peaks. The first peak value (–0.70 ‰) was obtained at the base of the Aphelognathus divergens Biozone (middle of bed 21), and this positive shift is noised by a negative spike (–1.50 to –5.17 ‰). The second and third peak values, reaching +0.19 ‰ and +0.54 ‰, respectively, appear in the middle and uppermost part of the Aphelognathus divergens Biozone. One sharp decreasing trend is recorded in the uppermost part of the Aphelognathus divergens Biozone (Fig. 4).
The whole-rock δ13Ccarb curve (dotted line in Fig. 4) serves as a basic dataset in the current study. It shows five relatively apparent excursions at expected stratigraphical levels. However, given that the raw δ13Ccarb data are somewhat scattering, a three-point moving average (thick black line in Fig. 4) is applied to smooth out noisy spiking. The three-point running mean trendline clearly demonstrates five excursions which have also been recognized in the plotted curve with individual data points.
6. Discussion
6.a. Diagenetic considerations
It is important to assess the extent to which diagenesis has affected the δ13C values prior to making interpretations of the significance of the data, but a thorough treatment of effects on δ13C related to syn-depositional and diagenetic processes is beyond the scope of this paper. Instead, just a few observations are discussed that lend support to the interpretation that a primary δ13C signal is a major component in the present data.
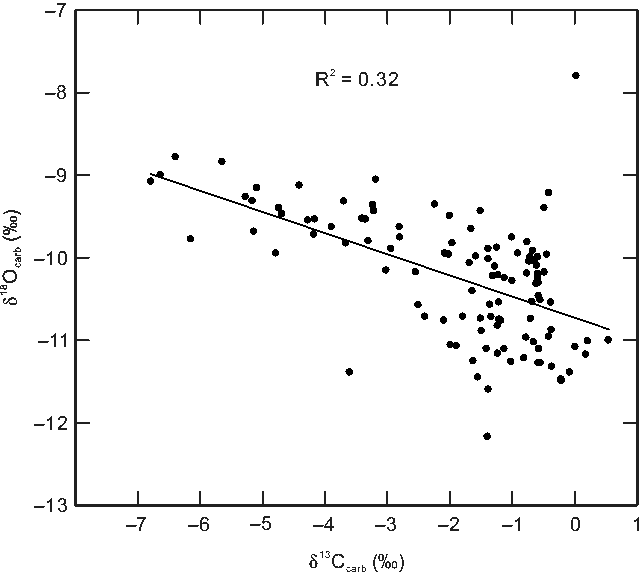
Correlation of δ13Ccarb and δ18Ocarb is traditionally viewed as an indicator of meteoric diagenesis (e.g. Banner & Hanson, Reference Banner and Hanson1990; Algeo et al. Reference Algeo, Wilkinson and Lohmann1992). A cross-plot of δ13C and δ18O data (Fig. 5) yields a negative correlation (R 2 = 0.32) from the Sigang section, and shows no clear covariation such as would be observed in settings with high pore-water – rock interaction and with meteoric water (Banner & Hanson, Reference Banner and Hanson1990; Immenhauser et al. Reference Immenhauser, Kenter, Ganssen, Bahamonde, Van Vliet and Saher2002). On the other hand, the δ13C effects of meteoric diagenesis should have been minimal prior to the Silurian development of terrestrial ecosystems dominated by vascular plants (Jones et al. Reference Jones, Creel, Rios and Santiago Ramos2015). Petrographic characters play a critical role in assessing the diagenesis of carbonate rocks. No obvious dolomitization can be observed in the carbonate-dominated Shiyanhe Formation, demonstrating that the δ13Ccarb composition is least affected by the alteration of dolomitizing fluids. The Shiyanhe limestones show insignificant recrystallization and retain the original sedimentary textures as well as many originally calcitic fossils, thus suggesting a high degree of textural preservation. Additionally, conodonts obtained from the Shiyanhe Formation are in a fine state of preservation (Fig. 3; see also Pei & Cai, Reference Pei and Cai1987, pls 12–14; Mei, Reference Mei1995, pls 1–3; Jing et al. Reference Jing, Stouge, Ding, Wang and Zhou2017, figs 4, 5). Most of them lack surface pitting and show minor diagenesis. Nevertheless, the conodonts are mainly opaque black, with a colour alteration index of ~5 (Jing et al. Reference Jing, Stouge, Ding, Wang and Zhou2017), indicating a relatively high level of thermal influence (Epstein et al. Reference Epstein, Epstein and Harris1977).
Cross-plot of δ13Ccarb and δ18Ocarb data from the Shiyanhe Formation of the Sigang section.

Thus, the δ13Ccarb data from the Shiyanhe Formation in the Sigang section largely preserve the original signal of perturbations in the carbon cycle, but some degree of diagenetic effects unavoidably exists. To limit the impact of diagenetic noises, the three-point moving average is employed in the chemostratigraphic correlation below.
6.b. δ13C correlation
Between the major global GICE and HICE, six (Bergström et al. 2007, 2010b, Reference Bergström, Saltzman, Leslie, Ferretti and Young2015) or five (Melchin et al. Reference Melchin, Mitchell, Holmden and Štorch2013; Husinec & Bergström, Reference Husinec and Bergström2015; Jones et al. Reference Jones, Creel and Rios2016) positive excursions in North America and four (Ainsaar et al. Reference Ainsaar, Kaljo, Martma, Meidla, Mannik, Nolvak and Tinn2010) in Baltoscandia have been identified. As noted above, trans-Atlantic correlations of these subdominant Katian δ13C anomalies have been extensively carried out in the last few years and have been used for long-distance correlation. The Shiyanhe Formation in the Sigang section has a stratigraphic range just spanning the temporal distribution of the δ13C excursions, which allows for the possibility of recovering these isotope events.
6.b.1. Regional correlation
A few papers have been published on mid–late Katian δ13Ccarb data from China so far, mostly with low resolution and poor biostratigraphic constraints (Wang & Yang, Reference Wang, Qi and Wu1994; Jiang et al. Reference Jiang, Zhu, Chen, Zhang and Qiao2001; Zhu et al. Reference Zheng, Xiao and Zhao2008; Hu et al. Reference Hu, Qian, Hu, Wang and Xiang2010; Munnecke et al. Reference Munnecke, Zhang, Liu and Cheng2011; Zhang & Munnecke, Reference Zhang, Trela, Jiang, Nielsen and Shen2016). Because no single outcrop exposes the entire interval of this period, all the previously published δ13C curves of this stratigraphic interval are segmented, hampering a regional chemostratigraphic correlation. In the literature, only one mid–late Katian excursion, the Whitewater excursion, has been identified in the Jiangnan Region of South China (Munnecke et al. Reference Munnecke, Zhang, Liu and Cheng2011) and in the Tarim Basin of NW China (Zhang & Munnecke, Reference Zhang, Trela, Jiang, Nielsen and Shen2016). Unfortunately, the Whitewater excursion in South China is biostratigraphically poorly controlled (Fig. 6), and that recovered in NW China is incomplete. It is difficult to make a precise correlation between the δ13C anomalies in the Sigang section and the data from Tarim and South China, and more chemostratigraphic as well as biostratigraphic information is required.
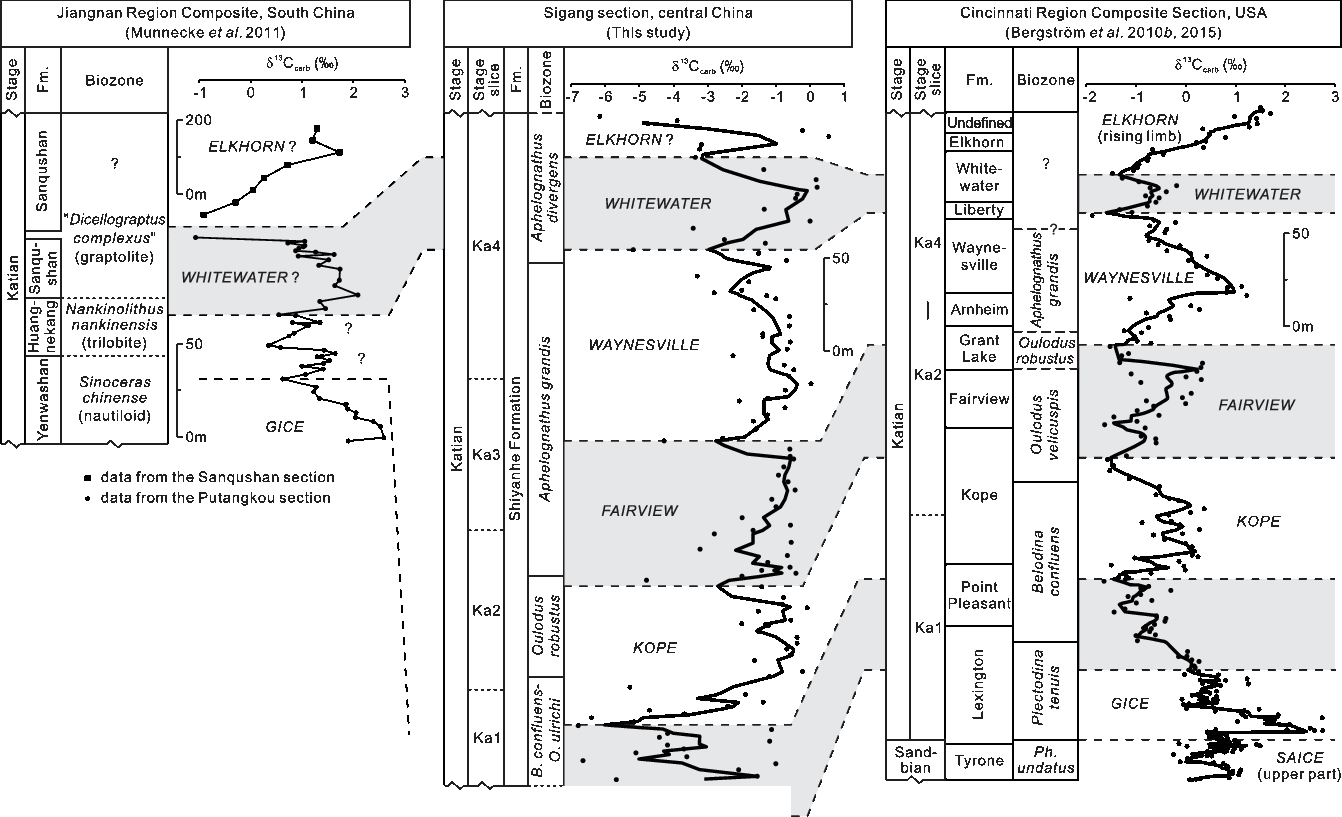
Correlation based on biostratigraphy and δ13Ccarb data between the Jiangnan Region Composite of South China (Munnecke et al. Reference Munnecke, Zhang, Liu and Cheng2011), the Sigang section (this study), and the Cincinnati Region Composite Section of the USA (Bergström et al. Reference Bergström, Young and Schmitz2010b, Reference Bergström, Saltzman, Leslie, Ferretti and Young2015). Note that the Jiangnan Region Composite of South China has been less decisively dated using macrofossils given the lack of investigation of conodonts, and that the strata above the Kope Formation of the Cincinnati Region Composite Section are biostratigrapically poorly controlled by conodonts.

6.b.2. Correlation with North America
Bergström et al. (Reference Bergström, Young, Schmitz and Saltzman2007, Reference Bergström, Young and Schmitz2010b) compiled δ13Ccarb data from one outcrop (Frankfort) and two drill cores (Minerva and Elkhorn) in the Cincinnati region of the USA as a standard δ13Ccarb curve for the Midcontinent successions of Katian age. Five positive δ13C excursions above the GICE were recognized in the Cincinnati standard reference, from oldest to youngest: Kope, Fairview, Waynesville, Whitewater and Elkhorn (Fig. 6). The Kope excursion and the lower half of the Fairview excursion were recovered in the Minerva drill core, and the upper half of the Fairview excursion, the Waynesville, Whitewater and Elkhorn excursions were documented in the Elkhorn drill core. Unfortunately, a functional biozonal succession for the Elkhorn drill core has not been conclusive (Bergström et al. Reference Bergström, Young and Schmitz2010b), implying the precise palaeontologic datings of the Fairview, Waynesville, Whitewater and Elkhorn excursions were not available. Therefore, the biostratigraphically well-controlled δ13Ccarb data from the Shiyanhe Formation in the Sigang section are expected to be useful for refining the biostratigraphical positions of those excursions. Based on the δ13Ccarb analysis coupled with the available biostratigraphic data, the correlation between the Neixiang area and the Cincinnati region is presented in Figure 6.
The fluctuation recorded in the lower part of the Belodina confluens – Oulodus ulrichi Biozone in the Sigang section can be correlated with the curve segment in the lower part of the Belodina confluens Biozone of the Cincinnati composite (Fig. 6). Such a correlation is not only supported by biostratigraphic evidence, but also demonstrated by their similar δ13Ccarb trends.
The oldest carbon isotope excursion within the Shiyanhe Formation is the Kope excursion, a further match of which between the Sigang and Cincinnati profiles can be provided by means of the δ13Ccarb data (Fig. 6). What should be noted is that the Kope excursion in the Sigang succession occupies the interval from the middle Belodina confluens – Oulodus ulrichi Biozone to the upper Oulodus robustus Biozone, whereas in the Cincinnati region this excursion spans the interval from the middle Belodina confluens Biozone to the lower Oulodus velicuspis Biozone. It seems that the upper boundary of the Kope excursion in the Sigang section is biostratigraphically slightly higher than that in the Cincinnati region. The imperfect match and correlation may be hampered by the fact that the Cincinnati profile represents a composite succession, and may also be impeded by method-inherent caveats such as different sampling densities and different trends in thicknesses.
The next younger δ13Ccarb excursion in the Sigang succession is interpreted to correspond to the Fairview excursion from the Cincinnati region (Fig. 6). This comparison is confirmed further by the similar two-peak shapes at both localities. In the Sigang section the Fairview excursion biostratigraphically covers the topmost part of the Oulodus robustus Biozone and the lower half of the Aphelognathus grandis Biozone.
Another δ13Ccarb excursion in the Sigang succession occurs in the interval including the upper half of the Aphelognathus grandis Biozone and the lowermost part of the Aphelognathus divergens Biozone (Fig. 6), and is considered to be comparable to the Waynesville excursion of the Cincinnati composite. Such a corresponding relation is also supported by the similarity of secondary isotope fluctuations.
Higher up in the Sigang section, a relatively simple, single-peak positive shift in δ13Ccarb is observed in the lower and middle parts of the Aphelognathus divergens Biozone (Fig. 6). This isotope anomaly is both shape-similar and biostratigraphically coeval (see below) to the Whitewater excursion of the Cincinnati region, so they are thought to be correlatable.
The stratigraphically youngest δ13Ccarb excursion in the Sigang section is just above the Whitewater excursion, and ranges the upper part of the Aphelognathus divergens Biozone (Fig. 6). This positive shift is supposed to be consistent with the Elkhorn excursion, which lies on the Whitewater excursion as well as in the Cincinnati curve. However, the thickness of this positive shift is thinner even than the rising limb of the Elkhorn excursion in Cincinnati (Fig. 6). In a recent abstract, Bergström & Kleffner (Reference Bergström and Kleffner2018) demonstrated that a complete Elkhorn excursion occurring in the upper part of the Aphelognathus divergens Biozone was found in a drill core from St Marys in western Ohio, USA. Regrettably, full data of the complete Elkhorn excursion are still unavailable, impeding a detailed correlation with the study section. In this context, the topmost positive shift in the Sigang section would be biostratigraphically correlative to the Elkhorn excursion of North America, but its rather small thickness hinders a full exact determination of the Elkhorn excursion. At present, the identification of the Elkhorn excursion in the Sigang section is tentative and in doubt.
6.c. Cause(s) of mid–late Katian δ13C excursions
δ18O data of both conodont apatite (Trotter et al. Reference Sweet2008; Jin et al. Reference Jin, Zhan and Wu2018) and phosphatic brachiopod (Rasmussen et al. Reference Rasmussen, Ullmann, Jakobsen, Lindskog, Hansen, Hansen, Eriksson, Dronov, Frei, Korte, Nielsen and Harper2016), as well as whole-rock carbon isotope records (e.g. Bergström et al. Reference Bergström, Chen, Gutiérrez-Marco and Dronov2009a, Reference Bergström, Saltzman, Leslie, Ferretti and Young2015; Ainsaar et al. Reference Ainsaar, Kaljo, Martma, Meidla, Mannik, Nolvak and Tinn2010), suggest that the Ordovician glacially influenced climate changes starting in the Darriwilian, lasting through the Sandbian and Katian and peaking in the Hirnantian. This cooling trend has been intimately connected to a series of progressively intense global carbon cycle perturbations, which were recorded by three major carbon isotope events with increasing amplitudes: the middle Darriwilian isotope excursion (MDICE), GICE and HICE (Algeo et al. Reference Algeo, Marenco and Saltzman2016). The three positive carbon-isotope excursions are generally attributed to an increase in primary productivity and organic burial which impounds 12C, leaving the inorganic carbon pool enriched in 13C (Brenchley et al. Reference Brenchley, Marshall, Carden, Robertson, Long, Meidla, Hints and Anderson1994, Reference Brenchley, Carden, Hints, Kaljo, Marshall, Martma, Meidla and Nõlvak2003; Saltzman & Young, Reference Saltzman and Young2005; Gill et al. Reference Gill, Lyons and Saltzman2007; Young et al. Reference Young, Saltzman and Bergström2008, Reference Yang2010; Zhang et al. Reference Zhang, Zhang, Yuan and Xiao2009, Reference Zhang, Shen, Zhan, Shen and Chen2011; Algeo et al. Reference Algeo, Marenco and Saltzman2016). This is known as the ‘productivity’ hypothesis (Gorjan et al. Reference Gorjan, Kaiho, Fike and Chen2012). However, less research has been done on the causal relationships between the mid–late Katian variability of δ13C and oceanic conditions. The present study does not attempt to explain the direct cause(s) for the mid–late Katian carbon-isotope excursions since further information has not been retrieved, but a few remarks to put these excursions in a wider context are necessary.
On the basis of material from the Upper Ordovician Galena Group in Iowa, Fanton & Holmden (Reference Fanton and Holmden2007) concluded that in the Katian, peak δ13C values showed positive correlation with flooding events, and declining values were associated with regressions. However, other studies (Bergström et al. Reference Bergström, Young, Schmitz and Saltzman2007, Reference Bergström, Young and Schmitz2010b; Ainsaar et al. Reference Ainsaar, Kaljo, Martma, Meidla, Mannik, Nolvak and Tinn2010) argued that the Katian carbon-isotope excursions in both North America and Baltoscandia are not directly tied to transgressive or regressive events. In the Sigang section, the Waynesville and Whitewater excursions are associated with sea-level rise intervals, whereas the Kope, Fairview and doubtful Elkhorn excursions occur during episodes of relatively low sea level (Fig. 4). Our δ13Ccarb data reconfirm that the Katian positive δ13Ccarb excursions, to a great extent, were not driven by the sea-level rises. Fan et al. (Reference Fan, Bergström, Lu, Zhang, Zhang, Li and Deng2015) proposed that during cooling time intervals the burial of methane hydrates, which are low-temperature products in the oceans and extremely rich in 12C, resulted in the Katian positive δ13C excursions. However, direct evidence for the occurrence of methane hydrates in the Ordovician is unavailable to support this explanation.
Although the productivity hypothesis is somewhat controversial (Gorjan et al. Reference Gorjan, Kaiho, Fike and Chen2012), it is noteworthy that phytoplankton (e.g. acritarch) did undergo a marked increase in biodiversity during the mid–late Katian time (Servais et al. Reference Servais, Lehnert, Li, Mullins, Munnecke, NC and Vecoli2008; Servais & Harper, Reference Servais and Harper2018), and that black shale deposition was widespread on the continental shelves (Barnes, Reference Barnes, Webby, Paris, Droser and Percival2004; Berry, Reference Berry, Finney and Berry2010; Melchin et al. Reference Melchin, Mitchell, Holmden and Štorch2013; Algeo et al. Reference Algeo, Marenco and Saltzman2016). High biodiversity of phytoplankton probably represents a high marine primary productivity, and extensive black shales indicate an enhanced burial of organic carbon. Therefore, the enhanced deposition of black shales linked to higher marine productivity is considered to play an important role in the development of the mid–late Katian δ13C excursions.
7. Conclusions
The δ13Ccarb data from the Sigang section, Neixiang area of central China, are interpreted to largely reflect primary mid–late Katian sea-water δ13C in the light of the combination of the high degree of textural preservation, the rare diagenetic textures and a good δ13Ccarb correlation with the Cincinnati region.
Five mid–late Katian δ13Ccarb excursions, constrained by the conodont biostratigraphy, are recognized in the Sigang section. In ascending order, the Kope excursion ranges the interval from the middle Belodina confluens – Oulodus ulrichi Biozone to the upper Oulodus robustus Biozone, the Fairview excursion covers the topmost part of the Oulodus robustus Biozone and the lower half of the Aphelognathus grandis Biozone, the Waynesville excursion occurs in the interval including the upper half of the Aphelognathus grandis Biozone and the lowermost part of the Aphelognathus divergens Biozone, the Whitewater excursion occupies the lower and middle parts of the Aphelognathus divergens Biozone, and a doubtful Elkhorn excursion spans the upper part of the Aphelognathus divergens Biozone.
The available evidence suggests that the mid–late Katian positive carbon-isotope excursions are not directly induced by sea-level change. These δ13C excursions are probably due to the enhanced deposition of black shales as a result of a synchronous increased marine productivity, which may be indirectly extrapolated by the radiation of phytoplankton.
Author ORCIDs
Xiuchun Jing 0000-0002-4208-6194
Acknowledgements
This research was supported by the National Natural Science Foundation of China (grant number 41502026); the State Key Laboratory of Biogeology and Environmental Geology, China (grant number GBL21511); and the China Scholarship Council (grant number 201506405017). We express our indebtedness to Xiaoqiao Wan and Wenbo Su from China University of Geosciences (Beijing) for guidance and constant encouragement, without which it would not have been possible to complete this work. Qiang Fang, Zhihua Yang and Ling Ding from China University of Geosciences (Beijing) are sincerely acknowledged for assistance during field trips and sample preparation. The isotope experiments were performed by Xiaoming Chen in the Nanjing Institute of Geology and Palaeontology. Stig M Bergström and Rongchang Wu are gratefully acknowledged for critical comments and suggestions, which improved the manuscript significantly. This paper is a contribution to International Geoscience Programme (IGCP) Project 653 ‘The onset of the Great Ordovician Biodiversification Event’.