I. Introduction
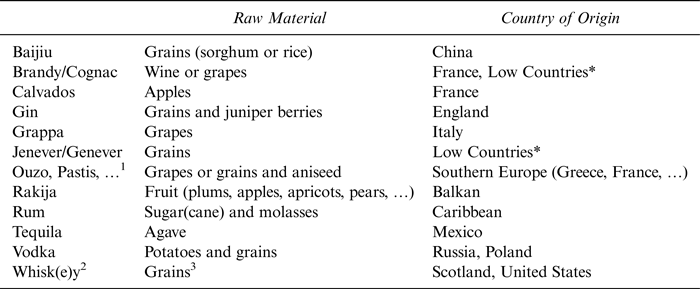
Around half of the total alcohol consumption in the world is in the form of spirits (Anderson and Pinilla, Reference Anderson and Pinilla2020). Spirits are high-alcohol beverages whose alcohol content has been increased by distillation. They include products such as vodka, rum, tequila, cognac, whisk(e)y,Footnote 1 baijiu, etc.Footnote 2 Spirits can be produced from a variety of raw materials. For example, gin and baijiu are primarily distilled from grains, vodka from potatoes or grains, brandy and grappa from grapes or wine, and rum from sugar(cane) and molasses (see Table 1).
Types of Spirits, Their Raw Material and “Country of Origin”
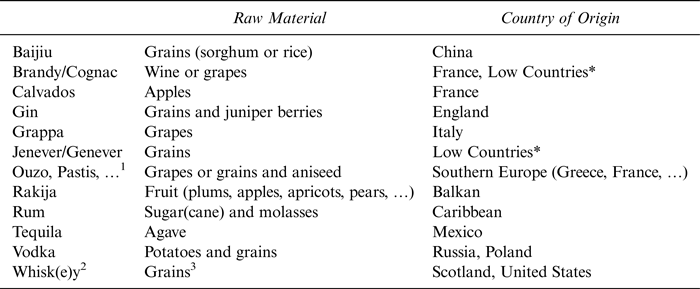
* Today's Belgium and the Netherlands.
1 Similar anis-based spirits include oghi (Armenia), mastika from Bulgaria and North Macedonia, rakı from Turkey, pastis (France), and arak (the Levant). Its aniseed flavor is also similar to the anise-flavored liqueurs of sambuca (Italy) and anís (Spain), and the stronger spirits of absinthe (France and Switzerland). Aguardiente (Colombia), made from sugar cane, is also similar.
2 “Whiskey,” for example, in the United States and Ireland; “Whisky,” for example, in Scotland, Canada, and Japan.
3 The whisk(i)e(y)s produced in different countries/regions have specific names because of differences in the method of production but also because of differences in the type of grains used (such as barley, corn, rye, and wheat). For instance, in the United States, whiskeys are named for the grains predominating in the mash, with at least 51% of their names grains—such as “Bourbon” whiskey (mashes contain at least 51% corn/maize) or “Rye” whiskey (mashes contain at least 51% rye).
Sources: Phillips (Reference Phillips2014), Thomas and Shipman (Reference Thomas and Shipman2016), and The Editors of Encyclopaedia Britannica (2020).
Studies trace the roots of spirits production back to around 3,000 years ago, thousands of years later than wine and beer that were first produced around 7,000 years ago (Nelson, Reference Nelson2005; McGovern, Reference McGovern2009). The production of spirits started later because the technology to produce spirits is more complex. The production process involves distillation, that is, heating a fermented liquid to a temperature between 79°C (at which alcohol boils) and 99°C (after which water boils) and then cooling the vapor. The resulting liquid will contain less water and more alcohol.
While there exists extensive literature of wine marketsFootnote 3 and the literature on the economics of beer and brewingFootnote 4 is rapidly growing, there are hardly any studies on the economics of spirits. This represents an important gap in the literature, especially given the fact that spirits are the most important type of alcoholic beverage in terms of volume of alcohol consumption. In this paper, we, therefore, aim to contribute to the literature by presenting an economic history of spirits, combining qualitative analysis with quantitative data.
Our analysis is constrained by data. There are data on the volume of spirits consumption for many countries since 1961. Longer time series are available only for a few Western countries. In addition, global datasets have less information on spirits consumption in lower-income countries; and data are often only available for aggregate spirits consumption and not for different types of spirits. Finally, data often differ between sources. In our analysis and interpretations, we use consistent data and complement these with information from other sources where available and useful.
The paper is organized as follows. Sections II and III explain the emergence of distillation technologies, how innovations spread over time and regions, and how spirits transformed from medicine to drink. Section IV explains how distilled spirits became a globally traded commercial drink for the masses and the colonies, and Section V discusses how governments have intervened in spirits markets to reduce excessive consumption and to raise taxes. Section VI documents changes in spirits consumption and trade, and Section VII documents changes in the industry structure from the 19th to the 21st century. The last section analyzes recent developments in the spirits industry.
II. Distillation and Alchemists’ Search for Gold, Perfumes, and Eternal Life
Anthropological studies document that spirits were distilled from rice beer in China since at least 800 bce (Before the Common Era). In the East Indies, the ancient Greek and Egyptian empires and other Arab countries people produced spirits more than 2,000 years ago. In Western Europe, spirits production was limited until the 8th century, when contact with the Arabs improved knowledge of distillation and the spread of more advanced technologies.
The distillation technology to produce alcohol was preceded by so-called “hydraulic” (non-alcoholic) distillation technologies developed by alchemists in their search for gold and perfumes. In ancient times, alchemy was practiced in places such as China, India, Greece, and Egypt. Alchemists in Alexandria (in today's Egypt)Footnote 5 discovered and developed the “alembic still” sometime in the 1st or 2nd century ce (Common Era) (Thorpe, Reference Thorpe1909).Footnote 6 The earliest stills consisted of two vessels connected by a tube: a heated closed container containing the liquid to be distilled, a condenser, and a container to receive the condensed liquid. These evolved into the pot still, which is still in use—see Section VII (Forbes, Reference Forbes1948).
This distillation technology and improved versions of it spread through the Middle East in the following centuries. For example, in the 6th century ce, the Byzantine Greek physician Aëtius of Amida refers to his use of an alembic “distillation still” made of glass. Plouvier (Reference Plouvier2008) writes that the scientific and intellectual center of Gundisabur in Persia (today's Iran) played a role by improving the “cucurbit” (the flask or pot containing the liquid to be distilled) and the “cap” (which is placed over the cucurbit to receive the vapors) of the alembic still.
The purpose of the Greek and Persian alchemists’ (and that of the Arab alchemists’ later) search for distillation techniques was not to produce alcoholic drinks but different products. One objective was to produce perfumes and floral essences.Footnote 7 To produce essential oils, they used plants such as roses and olives as raw material. These plant products contain enough fragrance/oil to derive perfume and “essences” when distilled with the first distillation technologies. Their more ambitious target was to find “gold” and “eternal life.” That is, their ultimate objective was to find a technology that would allow them to transform base metals into precious ones (like gold and silver—the “philosopher's stone”) and to produce the “elixir of life” which would give people immortality (Taylor, Reference Taylor1930; Forbes, Reference Forbes1948).
In the 7th century, the Arabs conquered Alexandria and Persia and acquired knowledge of “hydraulic” distillation. Arab scientists introduced innovations that allowed to distill grapes, wine, and (later) starchy cereals—and thus to produce alcohol. In the 9th century, the Arab chemist Al-Kindi refers to alcoholic distillation in his Book of the Chemistry of Perfume and Distillations (ca. 866): “In the same way one can drive up date-wine (nabldh) using a water-bath (fVl-rutuba), and it comes out the same colour as rose-water” (Needham et al., Reference Needham, Ping-Yu, Gwei-Djen and Sivin1980).Footnote 8
However, the production of substantive amounts of alcohol requires specific cooling technology as the alcohol vapors must be rapidly cooled with cold water. This cooling technology to produce alcohol efficiently through distillation was discovered a century later by the Arab chemist Abulcasis Al-Zahrawi (ca. 936–1013) (Plouvier, Reference Plouvier2008).
The new distillation technology spread through the Arab empire. While the Arab alchemists knew how to distill wine, it was not a major activity since their Muslim religion did not allow them to consume wine. However, this changed with the spread of advanced distillation technology outside the Arab empire.
III. Aqua Vitae: The Water of Life
Much of today's Spain was under the Arab empire. From the 12th century onwards, the distillation technology developed by the Arabs spread to other parts of Europe, first to Southern Europe, where the universities of Salerno (Italy) and Montpellier (France) became centers of knowledge on distillation (Patrick, Reference Patrick1952).Footnote 9 Initially, the alcohol that was produced was used as a medicine rather than a drink. In the south of Europe, wine was a common drink, and raw materials were in ready supply for distillation. Since wine had long been in use as a medicine, distillations from wine were also initially used in medicine, especially for its supposed positive human health effects. Alcohol was used as an antiseptic and disinfectant.
Physicians and alchemists across Europe saw the new technology as a major innovation to enhance life and health and joined the quest for the “water of life” (aqua vitae in Latin) (Fairley, Reference Fairley1907). Their experiments with distilled spirits of wine (aqua vitae) are written down in various Latin texts from the 12th and 13th centuries. The most famous is a technical treatise, known as Mappa Clavicula and two medical works developed by the famous Medical School of Salerno (the Compendium Magistri Salerni and The Practice of Surgery) (Multhauf, Reference Multhauf1956; Partington, Reference Partington1937).Footnote 10
As the technique of alcoholic distillation spread north in Europe, other products were used as raw materials for distillation (still for medicinal purposes). In northern France, Germany, and the Low Countries (today's Belgium and the Netherlands), “medicinal juniper” was used to treat stomach, kidney, and liver diseases. Juniper (the alcohol that later became genièvre in France, jenever or genever in Holland, and gin in England) was distilled from a grain mash with the juniper berry as flavoring ingredient. In the 14th century, the Black Death spread across Europe and with it the use of juniper elixirs as a medicine (Barnett, Reference Barnett2011).
Alcohol remained in use as an important medicine in the following centuries. The first printed book on alcoholic distillation was written in 1500 by the German physician Hieronymus Brunschwig (ca. 1450–1512) (Liber de Arte Distillandi: De Simplicibus or “The Virtuous Art of Distilling”), and claimed that distilled alcohol could cure a wide range of diseases: from fever, baldness, lethargy, deafness, bad digestion to the bites of a mad dog:
“It eases the diseases coming of cold. It comforts the heart. It heals all old and new sores on the head. It causes a good colour in a person. It heals baldness and causes the hair well to grow, and kills lice and fleas. It cures lethargy. Cotton wet in the same time and a little wrung out again and so put in the ears at night going to bed, and a little drunk thereof, is of good against all deafness. It eases the pain in the teeth, and causes sweet breath. It heals the canker in the mouth, in the teeth, in the lips, and in the tongue. It causes the heavy tongue to become light and well-speaking. It heals the short breath. It causes good digestion and appetite for to eat, and takes away all belching. It draws the wind out of the body. It eases the yellow jaundice, the dropsy, the gout, the pain in the breasts when they be swollen, and heals all diseases in the bladder, and breaks the stone. It withdraws venom that has been taken in meat or in drink, when a little treacle is put thereto. It heals all shrunken sinews, and causes them to become soft and right. It heals the fevers tertian and quartan. It heals the bites of a mad dog, and all stinking wounds, when they be washed therewith. It gives also young courage in a person, and causes him to have a good memory. It purifies the five wits of melancholy and of all uncleanness.” (Roueché, Reference Roueché and Salvatore1963, pp. 172–173)
The association of spirits with health as embedded in aqua vitae as a name for spirits was in wide use in the Middle Ages and the Renaissance. This association lived on for centuries, as reflected in many writings, including the following from a famous French writer:
“Cognac: … Excellent for certain diseases. A good swig of cognac never hurt anybody. Taken before breakfast, kills intestinal worms.” (Flaubert, Reference Flaubert1913, p. 24)Footnote 11
Today aqua vitae lives on in many spirits names, such as, for example, eau-de-vie in France, acquavite in Italy, akvavit in Scandinavia, okowita in Poland, yakovita in parts of Russia. Etymologists explain that whisky also derives its name from aqua vitae, from the old Gaelic expression uisce beatha or usquebaugh (literally water of life), which in the 1700s became usky, uiskie, and whiskie (Phillips, Reference Phillips2014).
IV. From Medicine to Drink for the Masses and the Colonies
“The revolution in Europe was the appearance of brandy and spirits made from grain. The sixteenth century created it; the seventeenth century consolidated it; the eighteenth century popularized it.” Braudel (Reference Braudel and Reynolds1981, p. 241)
From the 16th century onwards, Europeans became accustomed to the growing use of distilled alcohol as a drink and not (only) a medicine. Until then, distillation was still expensive (due to the high cost of the stills), and the recipes and technologies were not widely known (confined to physicians and monks in monasteries, which were centers of knowledge at the time). However, in the following two centuries, alcoholic distillation transformed from its “medical” purposes, mostly produced in monasteries, to a globally traded commercially produced drink.Footnote 12
Knowledge about distillation spread with book printing. By the mid-1600s, several texts on distillation had been published. The Art of Distillation by John French, printed in 1651, describes distillation from wine, vegetable seeds, and grains.Footnote 13 The spread of knowledge and the growing demand for alcoholic distillation for drinking purposes stimulated private investments in distillation by wealthy individuals and alcohol production outside monasteries.Footnote 14
As already mentioned, in Europe, the distillation of alcohol started in the south and used wine or grapes as raw material. Distillation spread north as other ingredients were used as raw material. The demand for distilled alcoholic drinks may have been higher in the north of Europe because it was not possible to produce wine there, and importing wine was expensive. In addition, the preservation of beer, the local alcoholic drink, was difficult with the technology of the time. The introduction of hops in beer production enhanced the preservation of beer, and thus trade, and the growth of commercial brewing from the 16th century onwards, but only over limited distances. Spirits had advantages for trade as its alcohol content was much higher (eight or nine times the alcohol content of wine and even more for beer) and thus easier to preserve and cheaper to trade (less bulky) than wine or beer.
The spirits markets grew rapidly. The growth and regional spread of different spirits were obviously affected by the raw materials that were used. There is a wide variety of spirits in the world, and it is not possible to cover the economic history of all in detail within the constraints of this paper. Data on different types of spirits are also limited. The most consumed spirit in the world is probably baijiu, a drink made from grains (mostly sorghum) but almost only consumed in China. Although it is known that baijiu was distilled several centuries ago, information on the history and development of the industry is limited.
Yet to understand the economic history of spirits, it is important to provide some more specific insights on different spirits and show the crucial role played by their raw materials and geography in their economic history. In our discussion, we focus on some key spirits for which more information is available: brandy, gin, rum, whisk(e)y, and vodka.Footnote 15
A. From Brandewijn to Brandy and Cognac
Several authors point at the important role that the Dutch played in the growth of spirits markets in Europe (Huetz de Lemps and Roudié, Reference Huetz de Lemps and Roudié1985). After the Dutch became independent from Spain in 1648, they soon became the largest market of spirits distilled from wine—which became known among the Dutch as brandewijn (literally meaning “burnt wine”) from which “brandy” later derived (Hanson, Reference Hanson1995). The Dutch not only liked brandewijn for consumption in Holland but, as it was easy to transport and preserve, also to feed their growing fleet of ships and sailors. Their saying was that it gave extra courage to the sailors—hence the expression “Dutch courage” (Gough, Reference Gough1998).
An important factor why the Dutch preferred to import brandewijn rather than produce spirits based on local raw materials, such as jenever from grain, was that grain used for alcohol competed with grain for bread. The government discouraged the use of spirits distilled from grain, in order to have sufficient grain supply for producing bread (Faith, Reference Faith1986). Interestingly, earlier in the 17th century, during the 80-year Independence War of Holland with Spain, it was the Spanish Government that banned the production of jenever (in 1601) in the Southern Low Countries (today's Belgium) because of concerns about a food shortage caused by wars with Holland and the use of grains for jenever production. A result of this ban was the migration of Flemish distillers to Holland (and to other regions) (Stephenson, Reference Stephenson2016).
As the Dutch became the most important spirits merchants in the 17th century, they were continuously looking for new sources of supply. Initially, they sourced wine as raw material from the French wine regions of Bordeaux, La Rochelle, and the Loire region. However, since it was cheaper and easier to ship spirits (brandewijn) than its raw material (wine), the Dutch established distilling stills in the French wine-producing regions to reduce transport costs. The brandewijn production region later expanded towards the Charente region in southwestern France (north of Bordeaux and south of Loire). The brandewijn from this region later developed into the famous “Cognac” (Braudel, Reference Braudel and Reynolds1981).Footnote 16 The growing demand in Holland for brandewijn thus stimulated the French Cognac industry in the 17th century (e.g., Enjalbert, Reference Enjalbert, Huetz de Lemps and Roudié1985; Phillips, Reference Phillips2016).
B. From Jenever to the Gin Craze
As explained earlier, besides brandewijn/brandy, distillers in Western Europe (France and the Low Countries) had been producing an alcoholic beverage from grain, often flavored with juniper berries (jenever in Dutch) since the 14th century. The distilled jenever was popular and the industry grew significantly in the 16th and 17th centuries.
Jenever also became popular in Britain in the 18th century. In the 17th century, Britain was massively importing wines and spirits from France—cheap wines for the masses and expensive clarets for the elites—as well as Cognac and other brandies. This changed after William of Orange, a Dutch Protestant prince, became King of England in 1688. First, with the arrival of William of Orange also Dutch jenever became popular in England. Second, Britain, now under Protestant rule, soon went to war with (Catholic) France, ruled by King Louis XIV. The war with France lasted 25 years (until 1713) and had a major impact on the British alcohol market and spirits consumption (Unwin, Reference Unwin1991). The war effectively halted much of British imports of French wines and Cognac. In addition, Britain increased tariffs on French wines from 1692 onwards. The war and the changed tariff structure transformed the British wine, beer, and spirits market and trade. One result was the rapid growth of the beer industry around London (Nye, Reference Nye2007). Another result was the shift from (“unpatriotic” and expensive) French wines and spirits (Cognac and other French brandies) to “patriotic” Portuguese wines,Footnote 17 Irish and Scottish whisk(e)y and Dutch jenever (Francis, Reference Francis1972; Ludington, Reference Ludington2013).
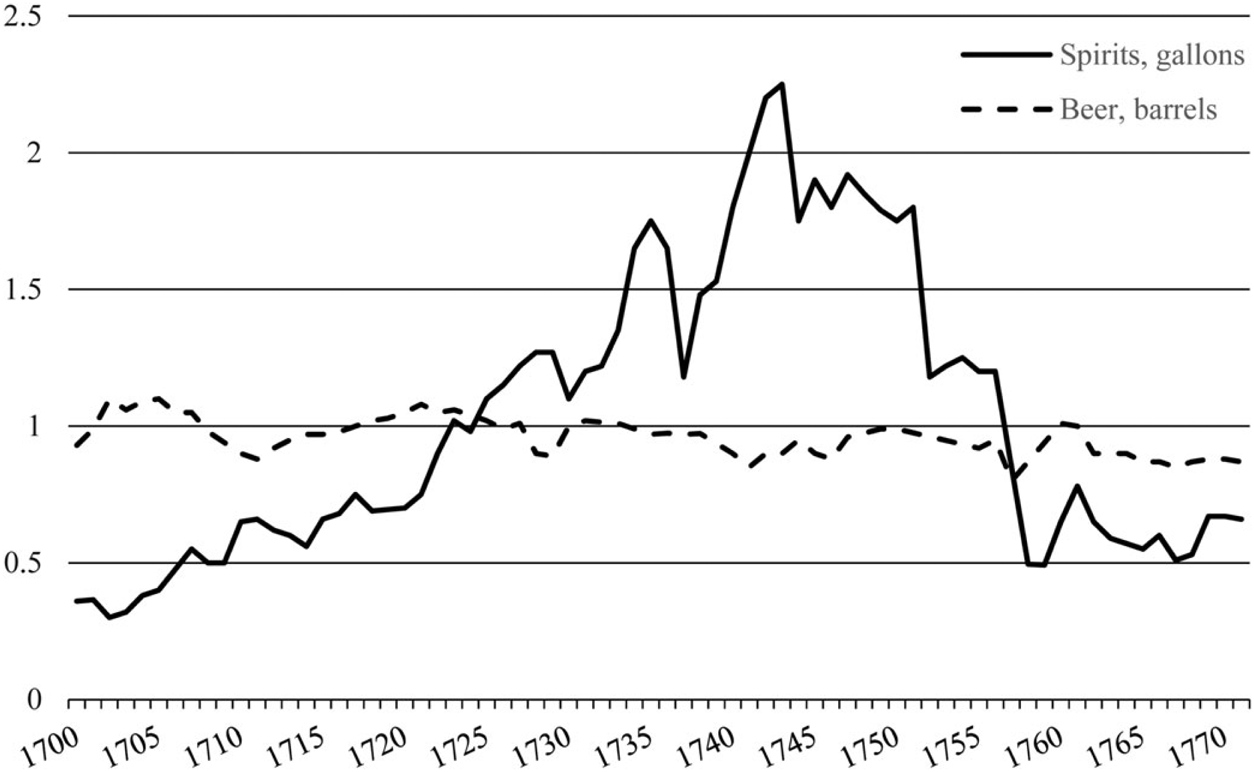
Initially, jenever was imported from Holland, but between 1690 and 1720, the British parliament started encouraging the production of spirits in Britain.Footnote 18 British distillers were soon producing a British version of jenever, “gin,” in large quantities, and consumption grew rapidly (Phillips, Reference Phillips2014).Footnote 19 Figure 1 illustrates how spirits consumption (mostly gin) grew from 0.36 gallons per capita in 1700 to 2.2 gallons per capita in 1745—a six-fold increase. During the first half of the 18th century, gin became so popular that it was referred to as a “Gin Craze” with major negative health and social impacts. In response, the British government introduced taxes and regulations to reduce spirits consumption around 1750. As Figure 1 illustrates, spirits consumption fell strongly afterward (see Section V).
Per Capita Consumption of Spirits and Beer, Britain, 1700–1771
Source: Warner et al. (Reference Warner, Her, Gmel and Rehm2001).

C. From Kill-Devil to Rum
By the 17th century, brandy and gin were widely produced and commercialized in Europe. Soon these spirits would spread around the world, accompanying European conquests in the Americas, Africa, and Asia. While the Dutch, the British, and the French were setting up colonies, they took their drinks and their technical knowledge of distillation with them. Trade costs and spoilage were lower for spirits than for beer and wine. Therefore, spirits became popular on the ships and in the settler economies of the New World.
However, this globalization of spirits was not one-directional. Soon spirits from the New World became popular and found their way on the ships to the European home markets. The most well-known, and arguably, most important, example of this is rum. While there is no agreement on where rum was first produced,Footnote 20 it is well documented that the West Indies (Caribbean Islands) became a major producer of rum, with Barbados as the largest producer.Footnote 21 From the middle of the 17th century, rum was produced in the Caribbean first under the name of kill-devil then rumbullion—which was shortened to “rum” (Watts, Reference Watts1987).
Initially, the European settlers in the Caribbean (English, French, and Dutch) consumed imported spirits and (often spoiled) wine and beer. In the 17th century, with a glutted tobacco market and rising demand for sugar, the Caribbean planters turned to cultivate sugar cane and producing sugar. Molasses, a by-product or residue of sugar extraction from sugarcane, was initially, considered waste and some of it was dumped in the sea to get rid of it. This changed when it was discovered that the remaining sugar in molasses was an excellent (and cheap) raw material for distillation into an alcoholic drink.
Rum was born, and the distillation of molasses became a highly profitable enterprise. The immense sugar profits allowed planters to invest in distillation technologies, and soon the profits from rum paid for the investments. Adam Smith (Reference Smith and Cannan1776, p. 158) wrote in The Wealth of Nations that “a sugar planter expects that the rum and the molasses would defray the whole expense of cultivation”—hence sugar sales were pure profit.
The rum industry in the Caribbean colonies was very successful, and profits grew with increasing exports. The international interest in rum grew as rum became the favorite drink of Caribbean pirates, the English Navy, and the British colonies.Footnote 22 During the 17th century, rum became a basic drink of the English Navy. In 1655, the ration of beer given to the British Royal Navy's sailors was converted to a ration of rum. Rum remained an official part of the British sailor's daily ration until 1970 (Phillips, Reference Phillips2014).
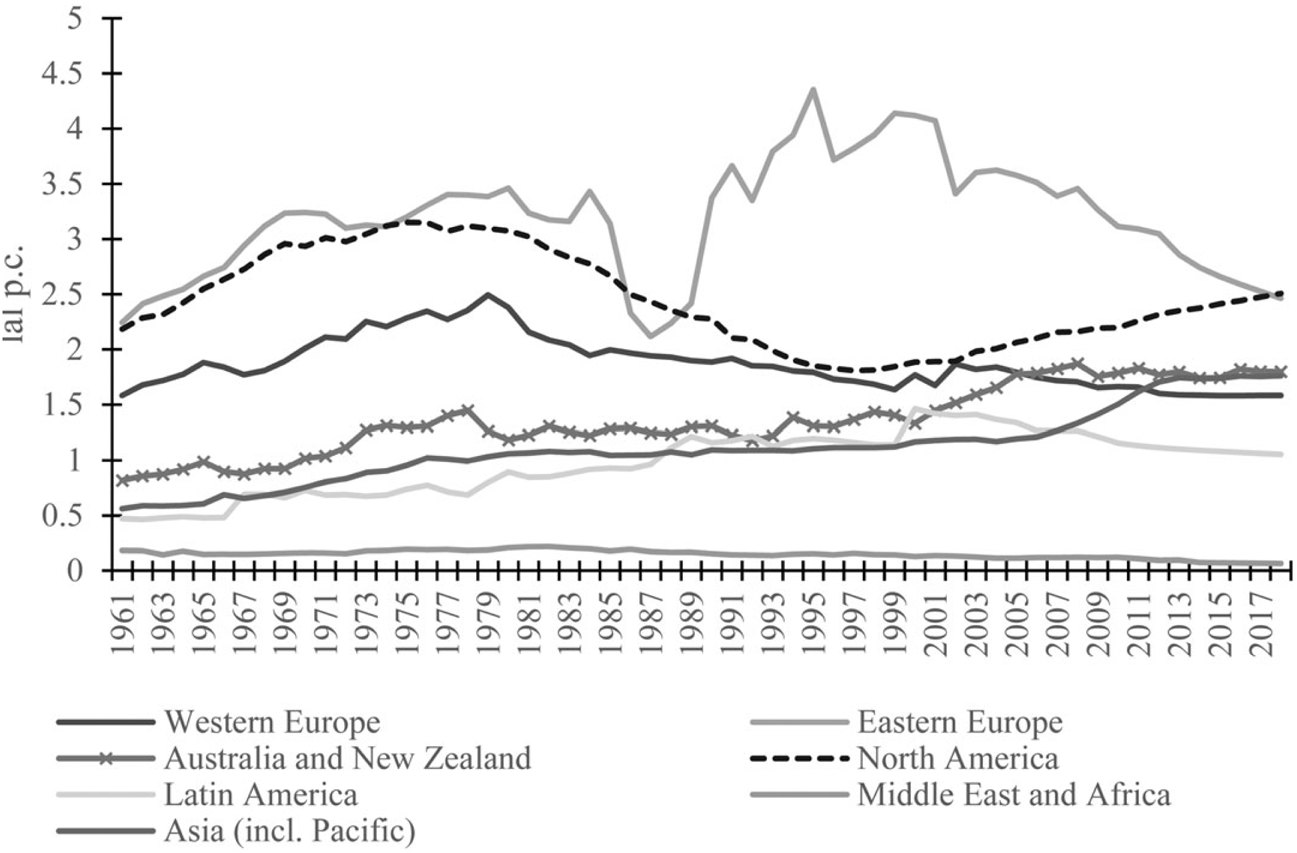
British colonies in Australia and America became “rum states.” Anderson (Reference Anderson2020b) documents how rum consumption grew rapidly, and by 1850 spirits, mostly rum, made up around 80% of all alcohol consumption in Australia (see Figure 2). Rum consumption in the North American colonies also grew rapidly. In the West Indies, profitable sugar plantations covered the entire islands. Other products, such as timber, livestock, fish, etc., had to be imported, often from the British colonies in North America. When the ships returned from Barbados and the West Indies, they were filled with rum.
Spirits Consumption by Region, 1961–2018
Source: Authors’ calculations based on Anderson and Pinilla (Reference Anderson and Pinilla2020).

While rum was initially imported by the British North American colonies, soon these colonies started to produce their own rum. From 1700 onwards, ships from the West Indies to British North America were increasingly filled with molasses rather than rum, and rum production grew rapidly there. The first distillery was established in what is now Staten Island (Roueché, Reference Roueché and Salvatore1963). During the 18th century, the number of distilleries grew rapidly, especially in New England,Footnote 23 and the import of cheap molasses did accordingly. In the second part of the 18th century (time of the American Revolution, 1775–1783), rum distilling had become the second most important industry in North America, after shipbuilding.
In their search for cheap molasses, the New England distilleries increasingly passed Barbados and the British Caribbean colonies and started importing molasses from French islands, especially from Haiti. This upset the sugar barons in the British West Indies, and they lobbied the British government to intervene—arguing that the exports of French colonial molasses were helping the French (enemy) finance their military and undermining their own revenues and also British tax revenue. The British Parliament passed the Molasses Act of 1733 that imposed heavy taxes on molasses exports from France (Haiti) to Britain (North America).
The Molasses Act was not well enforced and was circumvented with corruption. Later Britain replaced the Molasses Act with the Sugar Act of 1764 and sent ships and administrators to the colonies to effectively enforce the tariffs. This triggered strong political reactions from the North American colonies. They joined in political action and succeeded in inducing the English Parliament to reduce the tariffs. Several authors have argued that this was a crucial step in the American Revolution as it was the first time that the colonies had joined together in collective action. As such, this is believed to have contributed to the North American colonies’ political and military response to the tea and stamp taxes, introduced in part to replace the lower sugar (molasses) taxes (Carrington, Reference Carrington1987; O'Shaughnessy, Reference O'Shaughnessy2000; Williams, Reference Williams2005).
D. Whisk(e)y: Taxes, Rebellions, and Moonshining
(1) The United States: From Rum to Whiskey in the Late 18th Century
Whiskey production in the United States grew rapidly at the end of the 18th and into the 19th century. Before, in the 17th and much of the 18th century, U.S. whiskey production had been contained by cheap competition (rum) and expensive inputs (valuable grains). While the American Revolution may have been stimulated indirectly by a revolt of rum distillers (noted earlier), it ended up hurting the rum industry in the United States. The Revolutionary War lasted several years in the 1770s–1780s and crippled the rum industry as imports of molasses dried up. Afterward, the rum industry never really recovered. Trade embargoes continued, making imports of molasses expensive. When trade with the West Indies opened again (around 1812), sugar production in the West Indies was on the decline because of deteriorating soil productivity and the emancipation of slaves, making land less productive and labor more expensive.
With rum production suffering, whiskey production benefited from other developments around the same time. U.S. grain production grew with technological innovations and the allocation of farmland to veterans of the American Revolution, contributing to the westward expansion of grain production. In the Revolutionary War, soldiers were never paid sufficiently, and many veterans were given land grants in the “western” frontier (George Washington was the largest landowner in North America as a result). This increased the population in the western frontierFootnote 24 and grain production in this expanding region. However, the trade of grain was difficult with weak transport infrastructure.Footnote 25 Hence, whiskey production (next to tobacco in the southern regions) provided an attractive alternative to ship “processed grain” products to the East Coast cities such as Boston and New York City at a much lower cost per unit of value. Different types of grain were used (such as barley, corn, rye, and wheat), reflected in different names, such as “Bourbon” or “Rye” whiskey (see Table 1).
The rapidly growing whiskey industry became a target when the government in the United States, facing large debts from the American Revolution, wanted to increase and diversify its tax revenue by introducing a tax on distilled alcohol—besides import taxes. Although the tax was on general spirits, the tax became widely known as the “whiskey tax of 1791.”Footnote 26 The opposition to the tax in the western regions was strong and became known as the Whiskey Rebellion (1791–1794). Violence erupted, and ultimately George Washington led an army to subdue it. While the Whiskey Rebellion ultimately dissipated—and the episode is considered an important moment in the establishment of federal authority in U.S. history—enforcement of the whiskey tax remained weak, and it was abolished ten years after its introduction (in 1802).
Discussions over whiskey regulations switched from raising tax revenue to restricting excess consumption. As whiskey production and consumption grew in the 19th century, the Temperance Movement that wanted to constrain whiskey consumption grew stronger, ultimately resulting in the Prohibition legislation introduced in 1920 (see the next section). Prohibition stimulated massive smuggling of whiskey and illegal production—“moonshine” whiskey. Moonshining had also been prevalent during other times to avoid taxation.
(2) Scotch: From Lowland Blends to Highland MaltsFootnote 27
Before it became popular in the United States, whisk(e)y was the spirit of choice in Ireland and Scotland. Production of whisk(e)y in Ireland and Scotland is documented from the 15th century onwards. Initially, monasteries were centers of whisky production, but this shifted to households and farms when monasteries were dissolved by Henry VIII in the 16th century. The first commercial distilleries emerge in the late 17th century in Scotland.
Demand for whisky was initially mostly domestic, but export demand grew with the growth of the British empire—in particular from colonists in Australia and India—and in England where high-end customers searched for substitutes for brandy, with Cognac imports falling.Footnote 28 Cognac imports fell initially with the British-French wars (1688–1713), then with high import tariffs in the after-war period and later in the 19th century as Cognac production in France collapsed with the spread of the devastating bug Phylloxera in the Cognac regions.
Whisky production, both in its process and the use of raw materials, differed by region. In Scotland, whisky of the Highlands used malted barley as its main raw material and was produced by small distilleries, continuing to use old-fashioned technologies (pot stills). In the Lowlands, closer to England and with better infrastructure, grain was often used as input, and larger-scale distilleries developed with new distilling technologies. The Lowland commercial distillers also started blending different whiskies to get a product that was more consistent in terms of quality and taste. These differences continue until today as reflected in a blended whisky and “single malts.” Until recently, blended whisky made up the vast majority of Scottish whisky production and exports.Footnote 29
The history of whisky in Scotland and Ireland is also a history of taxes, regulations, and evasion. In times of poor grain harvests, the government tried to ban whisky distilling. When budgets were needed to finance wars, the government raised taxes on whisky. One of the most well-known taxes was the Malt Tax introduced in Britain in 1725, which caused much upheaval among whisky producers. However, as with all whisky regulations and taxes, small distillers in the northern Scottish Highlands were better positioned to evade whisky taxes and regulations than the larger and registered distilleries in the Lowlands. This resulted in substantial smuggling of illegal whisky from the Highlands to the southern regions.
These regional differences came to a head in the fights over “the definition of whisky.” This fight was triggered by increased competition among whisky distillers (e.g., with cheaper blended whisky sold as “pure Highland malt”) and scientific discoveries of widespread adulteration of food products, including spirits.Footnote 30 One result was regulatory initiatives to resolve this. The Highland pot-still malt distillers sought a legal definition that would exclude grain whisky (which they considered as an industrial alcohol product) and thus also blended whisky from describing itself as “Scotch Whisky.” However, an 1891 House of Commons committee concluded that there was no exact legal definition of whisky and that excluding blended whisky was unnecessary and bad for trade, effectively siding with the Lowland distillers. However, discussions over the definition of whisky continued and were only settled by another government commission report in 1907 that ruled that both malt whisky and grain whisky made in Scotland were Scotch Whisky. One argument raised in the report was that the majority of English whisky drinkers only drank blends anyhow and that another ruling would undermine this flourishing industry and the trust of consumers.
Another impact of the discovery of adulterations of whisky was a shift from casks to bottles and labels in the early 20th century. This addressed two objectives. It turned out that adulteration took place not so much at the distiller plants but at the retail level. By selling in bottles, distillers tried to reduce the dilution of the whisky at the retail level. Labeled bottles gave quality assurances by the distilleries—allowing them to establish and market brands, a development which grew in importance during the 20th century.
E. From Vodka to Baltika
Vodka production was historically concentrated in the north of Europe and Asia (Russia). Vodka has, arguably even more than other spirits, been controlled by the state. Early on, the Russian tsars imposed a state monopoly on sales of vodka, and from the mid 18th century on regulated ownership of vodka distilleries—also using it as an important source of government revenues (Pokhlebkin, Reference Pokhlebkin1992). There was a brief period of liberalization of the vodka market in the late 19th century, ending with the Russian Revolution of 1907. For most of the 20th century, vodka production and consumption were controlled by the Communist regime in the former Soviet Union.
Interestingly, the main attempts to restrict vodka consumption came at the beginning and the end of the Communist regime. Early on, the Soviet leadership tried to regulate alcohol consumption to address what they saw as a major factor weakening the working class. Lenin, the first Soviet leader, banned vodka sales and later prohibited all alcohol in the 1910s but relaxed the restrictions a decade later.Footnote 31
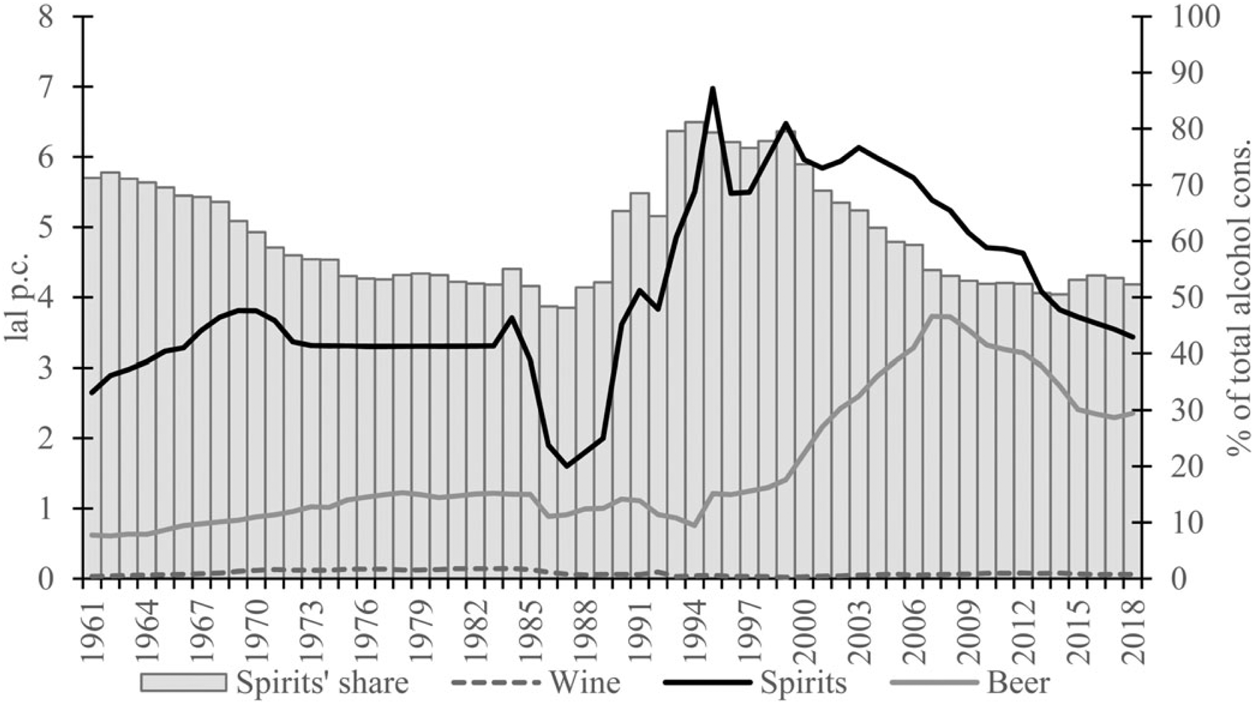
Seventy years later, Soviet leader Gorbachev launched another attempt to restrict vodka consumption and its negative effect on the health of the population and the economy's productivity. His campaign and regulations to reduce alcohol consumption started in 1985 and succeeded in significantly reducing spirits (mostly vodka) consumption (from around 3.5 in the early 1980s to below 2 liters of alcohol per capita after 1985)—see Figure 3. However, the campaign did not last. It was unpopular and costly and was stopped just before the collapse of the Soviet Union in 1990 (Bhattacharya, Gathmann, and Miller, Reference Bhattacharya, Gathmann and Miller2013; Tarschys, Reference Tarschys1993).
Evolution of Alcohol Consumption in Russia, 1961–2018
Source: Anderson and Pinilla (Reference Anderson and Pinilla2020).

In other north European countries, the governments also regulated vodka markets, often restricting production and sales during times of grain shortages. In Poland, from the 17th century onwards, the government granted monopoly rights to vodka production to nobility and clergy. In the early 20th century, the state took over the monopoly itself, coinciding with a global trend of governments trying to reign in excessive alcohol consumption. After WWII, the vodka industry, as most other industries, was controlled by Communist regimes throughout Central and Eastern Europe and the Baltic countries.
The economic and political transformations in Eastern Europe and the former Soviet Union following the fall of the Berlin Wall (in 1989) and the collapse of the Soviet empire had a major impact on the vodka market. The vodka industry was privatized, and much of the food and drinks industry attracted foreign investments, new technology and management, and western-style advertising campaigns (Gow and Swinnen, Reference Gow and Swinnen1998; Swinnen and Van Herck, Reference Swinnen, Van Herck and Swinnen2011).
The impact on the vodka market was most dramatic in Russia. With new leaders unwilling to intervene with unpopular regulations in a newly competitive political environment, vodka consumption in Russia soared in the early 1990s: per capita, spirits consumption jumped from less than two in 1987 to seven liters of alcohol in 1995 (Figure 3). These unprecedented levels of vodka consumption finally triggered government interventions. A series of new alcohol regulations, which included a ban on advertising for spirits, were introduced. The combination of these regulations with other factors, such as Western investments in breweries and targeted mass beer advertising campaigns, caused a major shift of vodka to beer consumption, especially among young people. Deconinck and Swinnen (Reference Deconinck, Swinnen and Swinnen2011, Reference Deconinck and Swinnen2015) document that this dramatic shift “from vodka to Baltika,” with a reduction in spirits (vodka) consumption and growth in beer (especially Baltika), was strongly correlated with age. While the shift was much stronger among younger people, the total effect was significant: in less than a decade, per capita, spirits consumption nearly halved (to 3.8 liters of alcohol), and its share of total alcohol consumption fell to 46%. Bhattacharya, Gathmann, and Miller (Reference Bhattacharya, Gathmann and Miller2013) show that the changes in spirits consumption had strong effects on the health of the Russian population and mortality rates in Russia.
V. The Water of Death: Regulations to Reduce Spirits Consumption
As the previous section already documented, with the growth in spirits consumption, problems of alcohol abuse emerged: the water of life became the water of death. These problems have appeared everywhere and continued over time. Today, the World Health Organization (WHO) estimates that alcohol consumption contributes to 3 million deaths each year globally, as well as to disabilities and poor health of many more: harmful use of alcohol, especially hard liquor (spirits), is responsible for 5.1% of the global burden of disease.
As explained previously, historically, spirits were initially considered positive for health, notably as a medicine and an elixir of life (aqua vitae). However, this perspective changed as spirits consumption grew and health and social problems associated could no longer be ignored. The growth of spirits consumption thus triggered important government interventions to affect alcohol consumption in general and of spirits in particular.Footnote 32 Besides consumption taxes, regulations included restrictions on sales, advertising, and consumption of alcohol.
Historical documents report regulations from the 15th century onwards. German towns introduced regulations on where and when one could drink spirits (e.g., citizens could not drink their brandy on the spot, and brandy sales were banned on feast days and during church services) (Forbes, Reference Forbes, Singer, Holmyard, Hall and Williams1956). The Russian tsars imposed a state monopoly on sales of vodka (Pokhlebkin, Reference Pokhlebkin1992). In France, brandy was portrayed as a “bad beverage,” in contrast to “healthy wine.” In 1677 French brandy sellers were forced to close their shops after 4:00 pm (Phillips, Reference Phillips2014). Around the same time, regulations to restrict rum consumption were introduced in the Caribbean. For example, Barbados introduced licenses for “tipping houses” (pubs) in 1652 and regulations to prevent excessive rum consumption in 1668 (Curtis, Reference Curtis2018).
Two major developments reinforced restrictions and regulations on alcohol use from the 18th century onwards. The first was the Industrial Revolution which (a) lowered the production cost and hence the price of spirits (see Section VII), and (b) created a class of industrial workers who became large consumers of spirits. Alcoholic drinks became more-readily available, stronger, and cheaper. Consumption, therefore, grew—as did problems of abuse, especially in the industrializing regions (Gately, Reference Gately2008).
Britain, the most industrialized country, introduced several measures to reduce spirits consumption during the 18th century. Figure 1 illustrates how consumption of spirits (mostly gin) increased dramatically in the first part of the 18th century, the Gin Craze period. The British government implemented several “Gin Acts” between 1729 and 1751 to reduce spirits consumption by taxing retail sales and imposing restrictions on sellers (Nicholls, Reference Nicholls2009; Warner et al., Reference Warner, Her, Gmel and Rehm2001).Footnote 33 With these measures, spirits consumption fell significantly after 1745. From 1760 onwards, spirits consumption was back to the levels of the early 18th century: around 0.6 gallons per capita. Note that over this entire period, with major fluctuations in spirits consumption, beer consumption remained almost constant.
The second important development was the growing availability of non-alcoholic safe drinks. Imports of tea, coffee, and cocoa were growing. By the 1750s, these beverages were widely available in Western Europe and the United States (Grigg, Reference Grigg2002; Wickizer, Reference Wickizer1951). In addition, scientific discoveries during the Industrial Revolution led to the invention of carbonated soft drinks.Footnote 34
The combination of these factors increased the demand for stronger restrictions on alcohol consumption since alcohol was no longer needed for safe drinking and since the social and personal costs of excessive alcohol use had become clearer. This translated into a global “Temperance Movement,” which led to restrictions on alcohol use in various countries. Restrictions took several forms.
A. Prohibition
The best-documented success of the Temperance Movement is probably the Prohibition period in the United States from 1919 to 1933—the subject of many Hollywood movies—but prohibitions on alcohol consumption were imposed in several other countries as well. For example, prohibition was imposed in Russia from 1914 to 1925. Norway banned spirits and beer sales in 1916; Finland banned all beverages with an alcohol level higher than 2% in 1919, and Belgium banned distilled spirits in 1918. Similar restrictions were imposed at times in Mexico, Canada, and India.Footnote 35
B. State Control of Sales
In other cases, alcohol sales were controlled by state monopolies (Phillips, Reference Phillips2014). Some of these restrictions continue today. In several countries, governments still exercise exclusive control over the alcohol market or some aspect of it (import, production, distribution, retail sales). Fifty countries (30% of all) reported the use of control over the alcohol market for at least one level. Monopolies over imports (36 countries) and retail sales (35 countries) were most common for spirits (WHO, 2018)—see Anderson, Meloni, and Swinnen (Reference Anderson, Meloni and Swinnen2018) for a review.
C. Taxes
Taxation of spirits and alcohol taxes more generally can serve the dual purpose of raising government revenue and reducing consumption to limit negative externalities.Footnote 36 Virtually all countries tax domestic consumption of alcoholic beverages. Since the Middle Ages, alcohol taxes have been an important source of government revenue, often making up large shares of town or central government tax income (Unger, Reference Unger2004, Reference Unger and Swinnen2011). In the late 18th century, alcohol taxes made up around 40% of total tax revenue in Britain, with around 10% from taxes on spirits and 25% from beer taxes (O'Brien, Reference O'Brien1988). Deconinck, Poelmans, and Swinnen (Reference Deconinck, Poelmans and Swinnen2016) and Nye (Reference Nye2007) document how the expansion of the Royal Navy and the British Army, as well as the Dutch Revolt against the Spanish empire, drew heavily on alcohol (beer and wine) taxes.
In earlier centuries, it was mostly beer and wine taxes, but as commercial markets of spirits expanded in the 17th century, spirits were increasingly taxed. The Dutch imposed taxes on spirits in the early 1600s, followed by the English (1643) and the Scots (1644). As explained earlier, the first revenue law introduced by the U.S. Congress was a tax on spirits to finance the debt it had incurred during the U.S. American Revolution in 1775–1783 (Hu, Reference Hu1950).
Many historical studies point out the difficulties in enforcing alcohol taxes and how the concentration and industrialization of alcohol industries may either increase or lower taxes. Transaction costs of tax enforcement may be lower with more concentrated industries, but lobby powers of organized industries in opposing taxes (or their implementation) may be stronger. For example, Nye (Reference Nye2007) and Unger (Reference Unger2004) show how tax revenues from alcohol industries only increased significantly when effective enforcement systems were introduced.
From a political economy perspective, it is difficult to distinguish between the tax revenue and health motives of governments in raising alcohol taxes—that is, when taxes are positively associated with both objectives.Footnote 37 In many countries, tax increases on alcohol, and especially spirits, are often justified as instruments to enhance health and constrain negative externalities that alcohol spirits drinking imposes on society. However, increased tax revenues are often welcome for these governments.
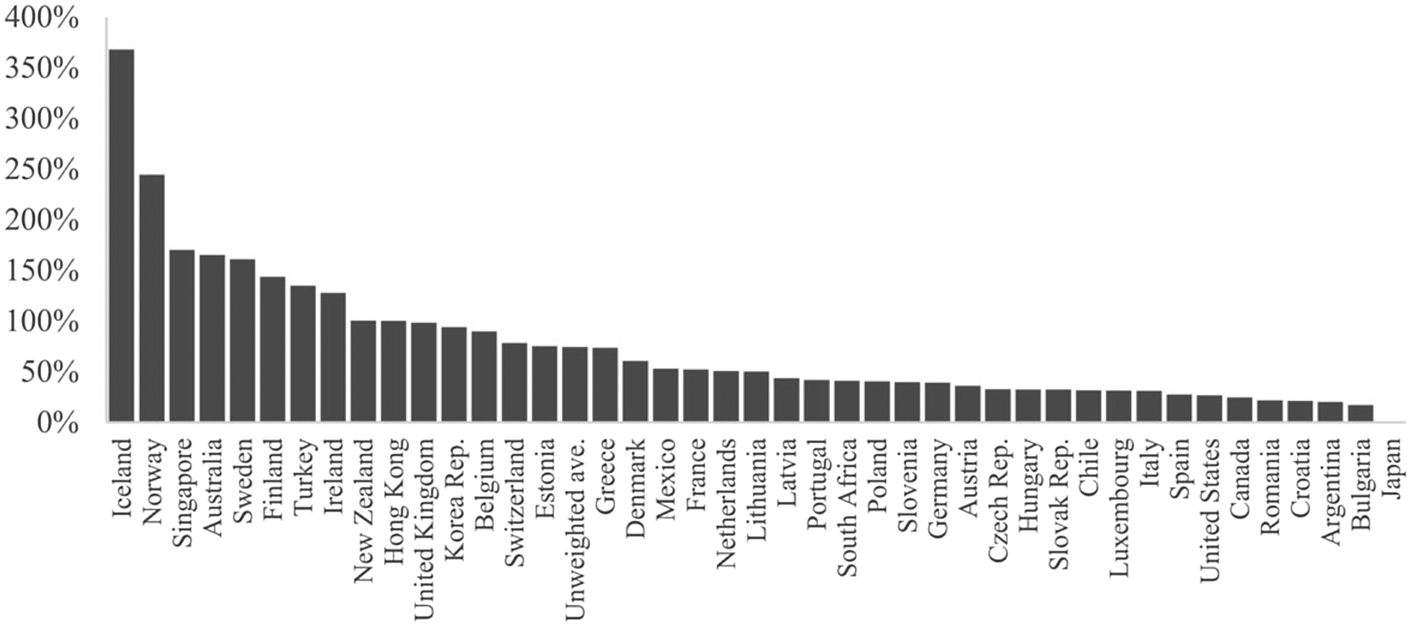
Data do show that taxes on spirits are often higher than taxes on lower alcoholic drinks, albeit with strong variations across countries. Anderson (Reference Anderson2020a) calculates global taxes on alcoholic beverages and finds that excise taxes on spirits are around 75% on average—much higher than for beer (28%) and wine (21%). These taxes vary from around 20% in Argentina and Romania to more than 200% in Iceland and Norway (Figure 4).
Excise Tax* on Spirits (%) in 2018
Notes: *Ad valorem consumer tax equivalent of excise taxes on spirits (wholesale pre-tax price = $15/liter). The United States excise taxes refer to the Federal level only.
Sources: Anderson (Reference Anderson2020a) and Appendix Table A4.

However, tax revenue and health motives do not always reinforce each other in raising alcohol taxes. The importance of alcohol as a source of tax revenue was an important constraint for governments to introduce regulations to reduce alcohol consumption in the 19th and early 20th centuries. For example, in the United States, on the eve of Prohibition (in 1919), alcohol tax revenues represented up to 80% of all federal internal tax collections in the United States (National Research Council, Reference Moore and Gerstein1981). The expected reduction in tax revenue was a major argument to counter the Temperance Movement in its demand for alcohol prohibition. Prohibition was only approved in the United States after a major tax reform introduced income taxation and shifted taxation from consumption to income (Okrent, Reference Okrent2010).
VI. Spirits Markets from the 19th to the 21st Century
There have been profound changes in alcohol consumption and drinking patterns since the 19th century. With technological advances in production and increasing commercial exploitation, spirits had become democratized around the turn of the 19th century. While estimates of consumption are scarce, consumption appears to have been high in some Western countries. Asbury (Reference Asbury1950) estimates per capita spirits consumption ranging between 4 and 10 gallons for the United States in the 1820s.Footnote 38 Anderson and Pinilla (Reference Anderson and Pinilla2020) then again estimate that the population of the United Kingdom consumed 4.8 liters of alcohol in the form of spirits in 1850. Their estimate for Australian spirits intake at this time is as high as 7.8 liters of alcohol.
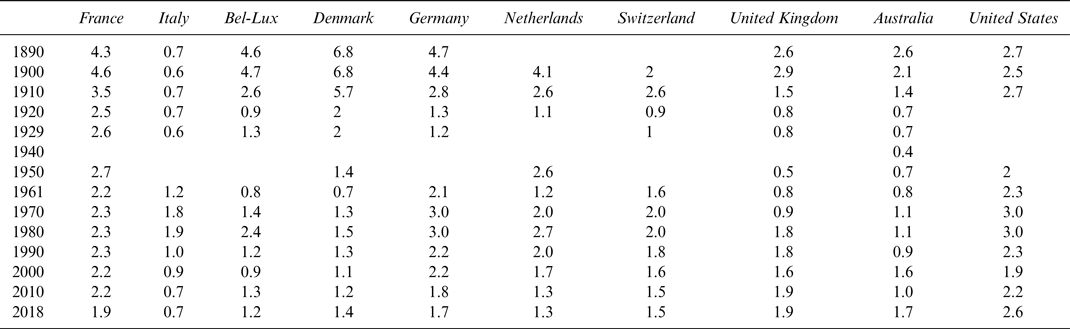
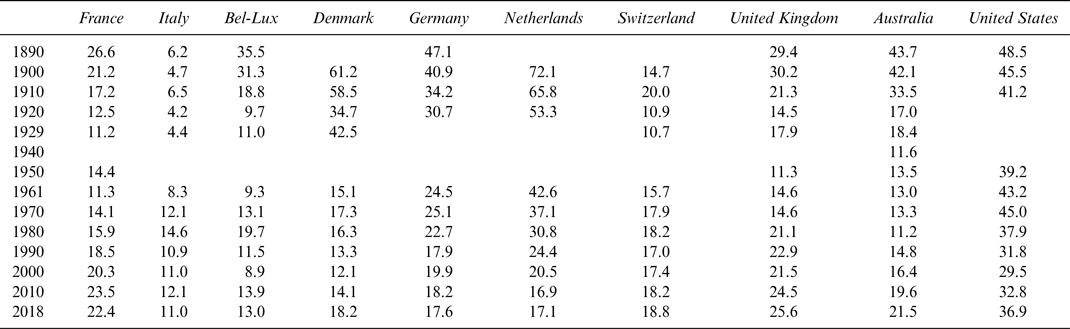
From around the end of the 19th century, information on spirits consumption in several Western countries is available and summarized in Anderson and Pinilla (Reference Anderson and Pinilla2020). Tables 2 and 3 document substantial variations. Whereas per capita consumption was below one liter in Italy in 1890, this was estimated to be nearly seven liters in Denmark (Table 2). Similarly, the share of spirits in the consumption of alcoholic beverages ranged from around 6% in Italy to almost 49% in the United States (Table 3). To some extent, this reflects the fact drinking patterns were still strongly influenced by local production of specific alcohol types, reflecting local climatic conditions and resources (Anderson, Meloni, and Swinnen, Reference Anderson, Meloni and Swinnen2018).
Spirits Consumption in Liters of Alcohol per Capita since 1890 in Western Countries

Source: Anderson and Pinilla (Reference Anderson and Pinilla2020).
Share of Spirits (%) in Total Alcohol Consumption since 1890 in Western Countries

Source: Anderson and Pinilla (Reference Anderson and Pinilla2020).
Despite these large differences, a common trend in these countries is that spirits consumption declined substantially around the turn of the century. In the Netherlands, Germany, and Belgium-Luxemburg, spirits consumption in 1929 was only a quarter of consumption in 1900. During this period, there was a shift to beer consumption.Footnote 39 This is the period of the rapid growth of lager beer—a product of the industrial revolution (Poelmans and Swinnen, Reference Poelmans and Swinnen2011). The global Temperance Movement was focused on deterring the consumption of spirits in particular (Aaron and Musto, Reference Aaron, Musto, Moore and Gerstein1981). The pamphlet An Enquiry into the Effect of Spirituous Liquors on the Human Body and Mind published in 1785 and commonly recognized as marking the inception of the Temperance Movement in the United States, urged people to drink wine and beer to prevent and cure intemperance (Asbury, Reference Asbury1950).
Information on spirits consumption between 1930 and 1960 is scarce. For the few countries for which Anderson and Pinilla (Reference Anderson and Pinilla2020) report data, it appears that there were no large changes in spirits consumption during these three decades.Footnote 40 Makela et al. (Reference Makela, Room, Single, Sulkunen and Walsh1981), however, point out that the post-war period was characterized by a loosening of alcohol controls in several Western countries that would eventually contribute to rising levels of consumption.
A. Global Trends since 1960
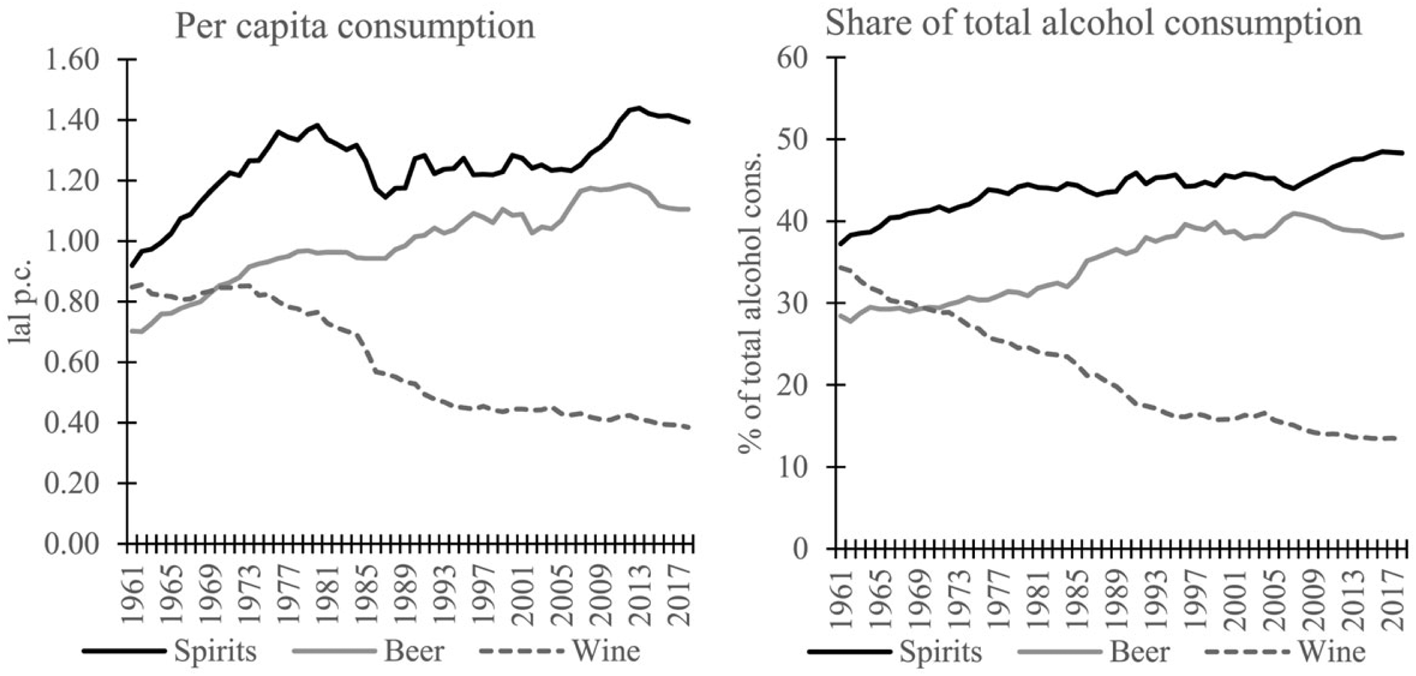
From 1961 onwards, information on alcohol consumption is reported for a much larger sample of countries across the world and allows us to discern global trends. As can be derived from Figure 5, there was a steady increase in global spirits consumption in the 1960s and 1970s. More specifically, per capita consumption rose from 0.9 to 1.4 liter of alcohol per capita between 1961 and 1980. In combination with declining wine consumption, this caused substantial changes in the global shares of the three main types of alcoholic beverages. Figure 5 reveals that beer, wine, and spirits were consumed in relatively equal proportions in 1961. That is, 28% of alcohol intake was consumed in the form of beer, 34% in the form of wine, and 37% in the form of spirits. By 1980, spirits, however, accounted for 44.5% of global alcohol consumption (compared to 30.9% and 24.6% for wine and beer, respectively).
Global Alcohol Consumption, 1961–2018
Source: Anderson and Pinilla (Reference Anderson and Pinilla2020).

The next decade was, however, characterized by a sharp drop in spirits consumption. By 1987 the volume of per capita spirits consumption had again declined to 1.1 liters. The decrease was particularly pronounced in high-income countries where spirits were widely consumed. To some extent, this reflects declining alcohol consumption related to a shift in the cultural climate concerning drinking alcohol with more attention to the adverse health and social effects (Room, Reference Room, Clark and Hilton1991). This especially affected spirits consumption. Kerr et al. (Reference Kerr, Greenfield, Bond, Ye and Rehm2004) estimate that reduced spirits consumption caused most of the reduction in alcohol consumption in the United States from 1979 to 2000. Cohorts born after WWII were found to have significantly lower total alcohol consumption and were much less likely to drink spirits.
Between 1988 and 2005, the volume of global spirits consumption fluctuated around 1.2 liters per capita. The share of spirits during this period remained relatively stable, around 45% as well. After 2005, there was a steady increase in global spirits consumption, which reached 1.4 liters per capita in 2011. While growth in the volume of consumption per person stagnated after 2011, spirits’ share in total alcohol consumption continued to rise. In 2018, more than 48% of global alcohol intake was consumed in the form of spirits.Footnote 41 The average consumption per person was equal to 1.4 liters of alcohol.
B. Rapid Growth in Emerging Countries and Declines in Mature Markets
These general trends mask substantial heterogeneity across countries. Figure 2 depicts regional trends in spirits consumption per capita. To some extent, these simply reflect diverging trends in alcohol use across the globe. Manthey et al. (Reference Manthey, Shield, Rylett, Hasan, Probst and Rehm2019), for example, show that alcohol intake has been declining in many Western countries, with the largest reductions in Eastern Europe, while it has been increasing in several Asian countries. Yet, since the turn of the century, spirits consumption has grown and gained importance in the United States. Similarly, the declining trend appears to have been halted in Europe with growth in the share of spirits in total alcohol consumption in several countries (e.g., France, Spain, Belgium-Luxemburg, Denmark, and the United Kingdom).
Notwithstanding increased consumption in some Western countries, the growth in spirits consumption since 2000 is importantly driven by rising spirits consumption in emerging economies, and especially in India and China. In fact, the aggregate volume of spirits consumed outside of China and India even declined by 2% between 2000 and 2018.
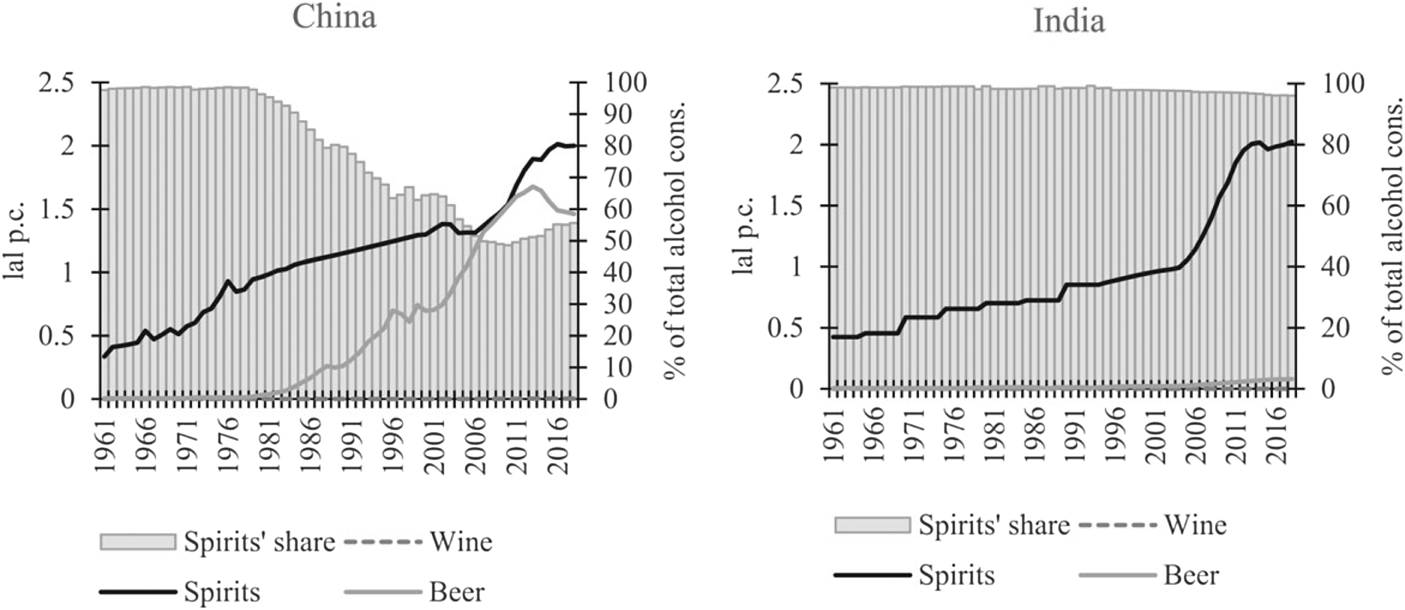
Figure 6 illustrates changes in the consumption of alcohol in China and India. In both countries, nearly all alcohol was consumed in the form of spirits in the 1960s and 1970s. The quantities of spirits consumed were, however, very low during this period, with average annual per capita consumption at 0.6 and 0.5 liters of alcohol for China and India, respectively. Largely, as a result of rising incomes, increased access to imported alcohol, and an expansion of the population above the legal drinking age, the volume of spirits consumption has increased significantly since. In China, consumption of spirits has risen to around two liters per capita since 2015. Consumer expenditures on spirits nearly tripled between 1990 and 2018. Similarly, spirits consumption in India rose to two liters in 2012, and expenditures doubled over the past 28 years (Euromonitor, 2019). In India, spirits still account for more than 96% of total alcohol consumption. The share of spirits in China had decreased 56% by 2018. This is mostly due to strong increases in beer consumption in recent decades (Colen and Swinnen, Reference Colen and Swinnen2016).
Evolution of Spirits Consumption in China and India, 1961–2018
Source: Anderson and Pinilla (Reference Anderson and Pinilla2020).

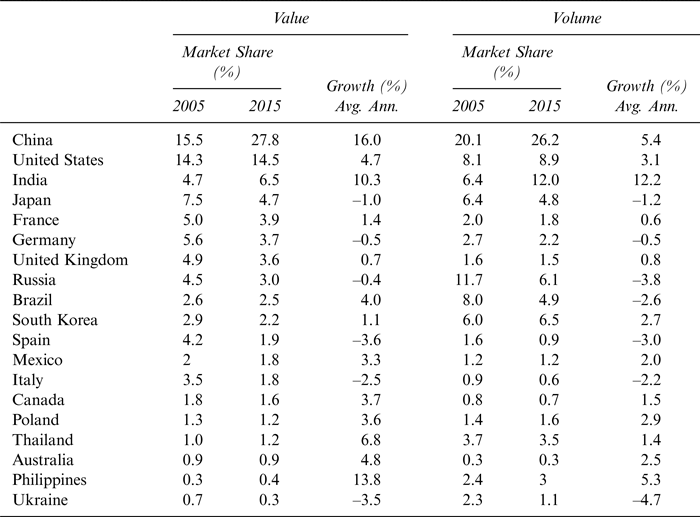
Table 4 summarizes data on global market shares from Holmes and Anderson (Reference Holmes and Anderson2017). The strong growth of spirits consumption in China and India is reflected in their growing global market share. In 2015 China accounted for 28% of the value and 26% of the volume of global spirits—compared to less than 16% and 20% ten years earlier. India's spirits market represented 7% of the global value and 12% of the global volume of spirits by 2015. Interestingly the share of the United States in the global spirits market has also increased in terms of volume and value, albeit very modestly. With significant growth in the three main markets, the value share of the top three (China, the United States, and India) grew from 34.5% in 2005 to 48.8% in 2015. Their volume share was 47.1% in 2015. Hence, these three markets accounted for approximately half of all spirits consumption in the world, both in value and volume.
Market Shares and Growth in Main Spirits Markets, 2005 and 2015

Source: Authors’ calculations based on Holmes and Anderson (Reference Holmes and Anderson2017).
Besides these countries, there was also significant growth in spirits markets in South Korea, Poland, Australia, and the Philippines. The volume of spirits consumption grew by more than 2.5% per year on average between 2005 and 2015 in these countries. In contrast, spirits markets have been shrinking considerably in terms of volume in recent years in countries such as Brazil, Spain, and Italy (average annual decline more than 2%). It is worth noting that the spirits market in Brazil was growing steadily in terms of value (at 4% on average annually) despite the sizeable decline in volume.
C. Convergence in Spirits Consumption
Until WWII, alcohol consumption patterns were strongly affected by local production, increasing globalization and interactions between cultures may give rise to convergence in national alcohol consumption patterns (Colen and Swinnen, Reference Colen and Swinnen2016). In traditional wine-drinking countries (such as Italy and Spain), beer consumption is increasing, and in traditional beer-drinking countries (such as Germany), wine consumption is growing (Swinnen and Briski, Reference Swinnen and Briski2017). However, Hart and Alston (Reference Hart and Alston2020) do not find such convergence among U.S. states.
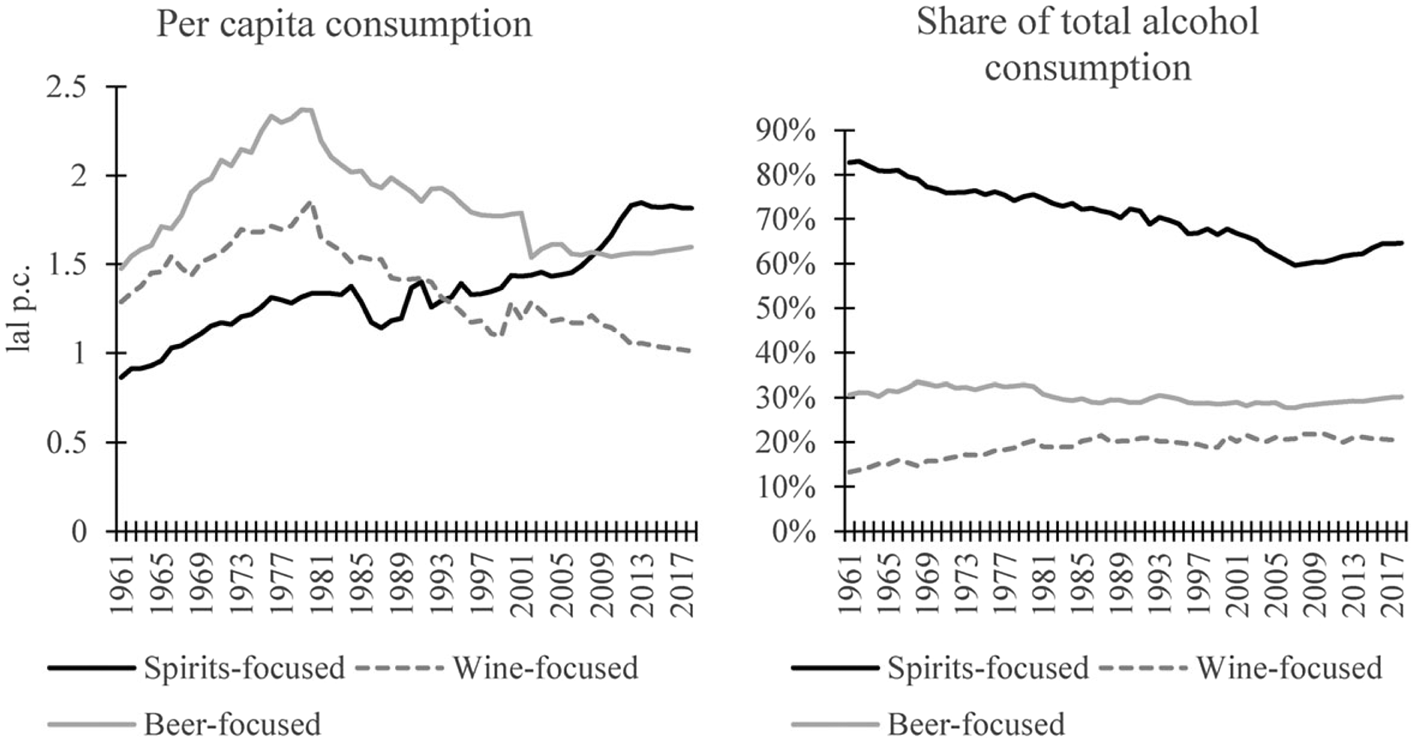
Figure 7 illustrates the evolution of spirits consumption for three groups of countries: (traditionally) spirits-focused, wine-focused, and beer-focused countries (as defined in Holmes and Anderson, Reference Holmes and Anderson2017). This comparison yields mixed conclusions. The share of spirits in total alcohol consumption declined from 1960 to 2005 in spirits-focused countries, but this trend reversed somewhat since. The evolution of the share of spirits in total alcohol consumption in wine- and beer-focused countries shows little signs of convergence. While there is a modest increase in the importance of spirits in wine-focused countries, the share of spirits in total alcohol consumption in beer-focused countries has remained remarkably stable over the period between 1961 and 2018. Data on the volume of spirits consumption more strongly suggests divergence rather than convergence. Spirits consumption has been largely increasing in spirits-focused countries over the past decades. In fact, per capita consumption more than doubled between 1961 and 2018. On the contrary, after sizeable increases between 1960 and 1980, per capita spirits consumption has been declining in beer- and wine-focused countries since 1980.
Spirits Consumption by Initial Focus,* 1961–2018
Note:* The categorization is based on which of the three beverages had the highest share of the volume of alcohol consumption in 1961–1964.
Source: Authors’ calculations based on Anderson and Pinilla (Reference Anderson and Pinilla2020).

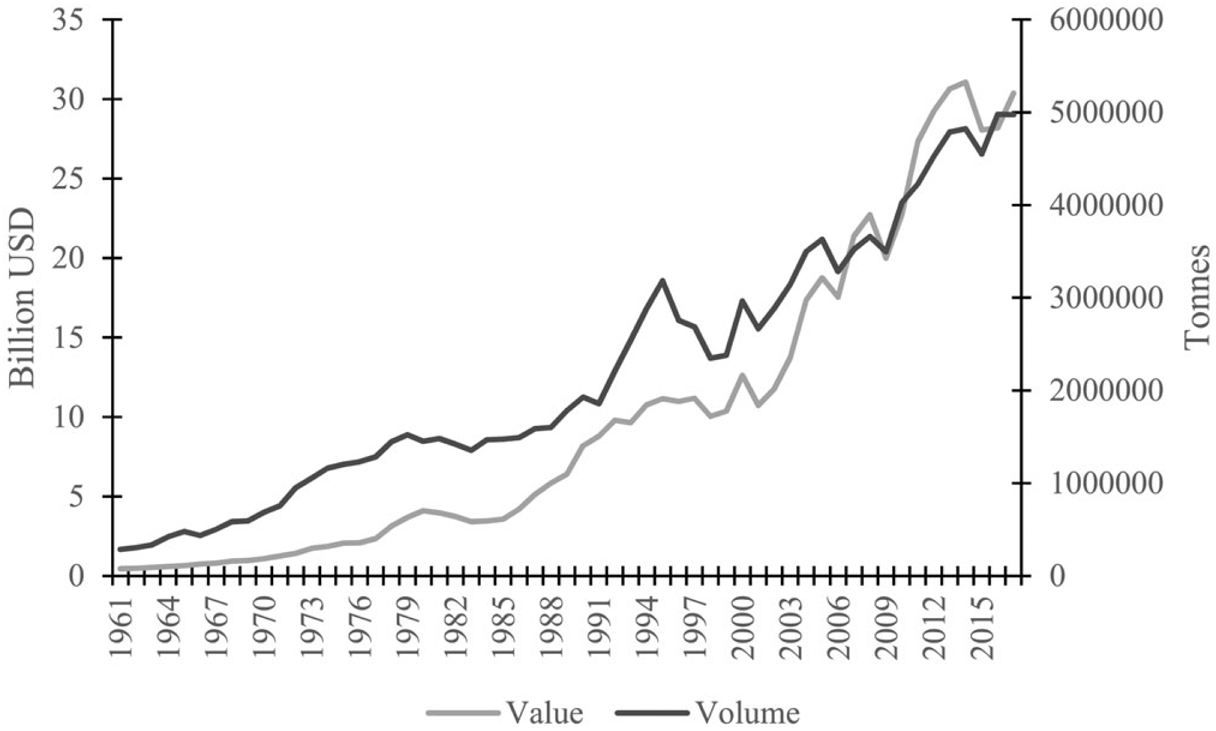
D. Trade in Spirits
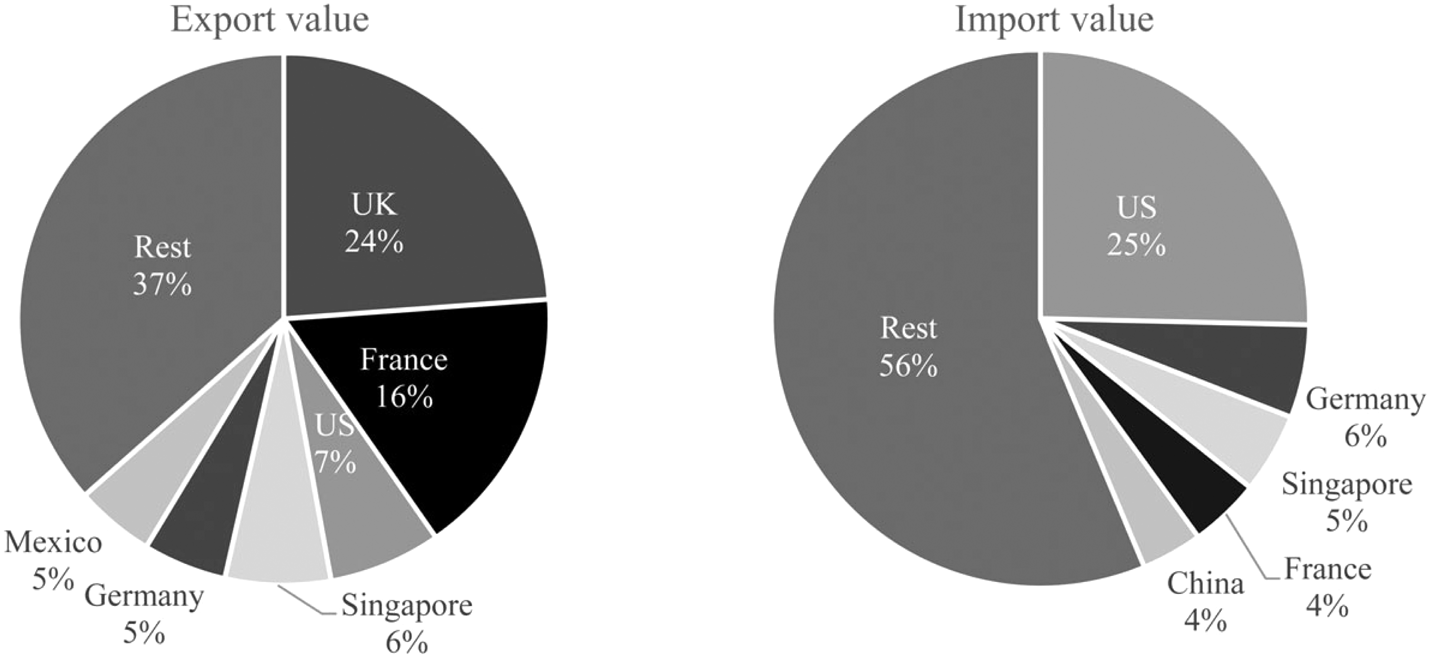
Spirits are widely traded. As explained earlier, historically, spirits proved to be more suitable for long-distance trade compared to beer or wine due to their higher alcohol content. Food and Agriculture Organization (FAO) data reveal that more than 30 billion dollars of distilled spirits were exported around the world in 2017 (see Figure 8). While accounting for only 9% of the total volume of global exports of alcoholic beverages, spirits made up 35% of the value. This share has been relatively stable for the last two decades.

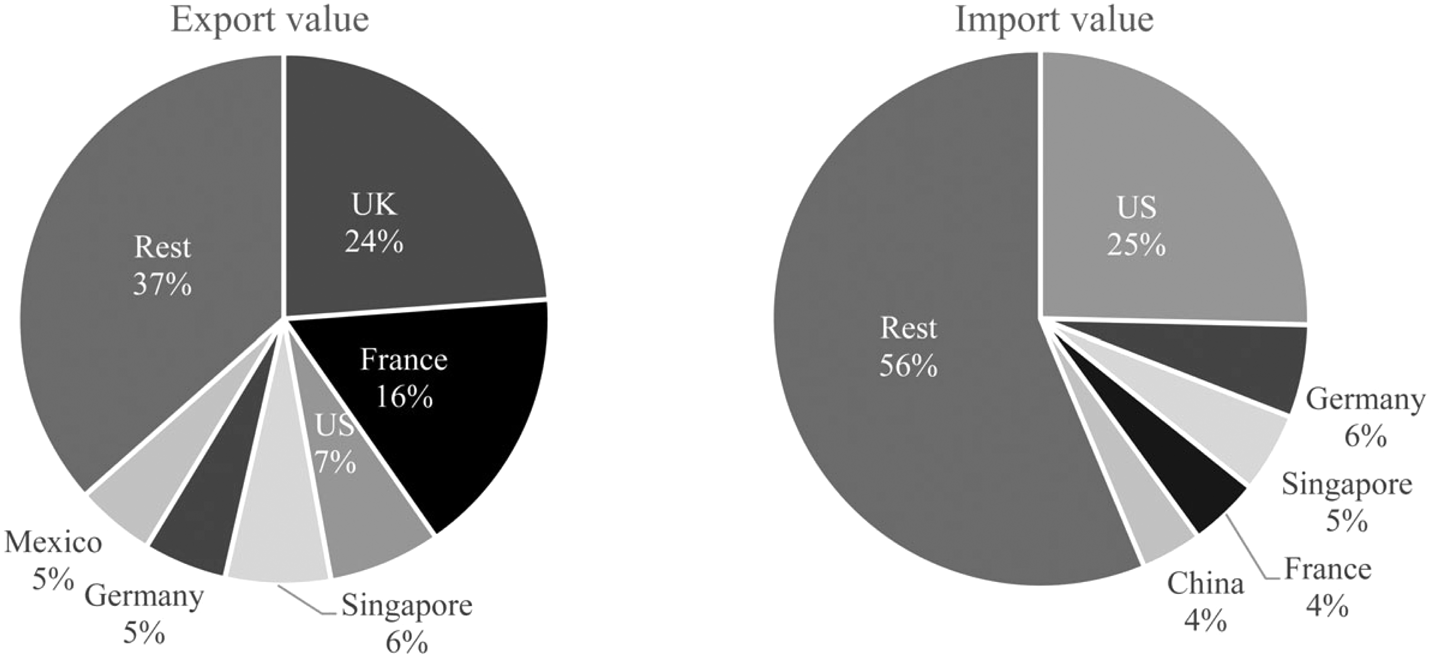
Exports of spirits are dominated by European Union (EU) countries, which represented nearly 20 billion or 65% of global exports in terms of value in 2017. Whisk(i)e(y)s and Cognacs account for most of these EU spirits exports (Spirits Europe, 2018). Roughly a quarter (24%) of global distilled spirits exports originated from the United Kingdom in 2017 (see Figure 9). The second biggest exporters were France (16%) and the United States (7%), respectively. The United States is currently also the biggest destination market for spirits. Other major importers of distilled spirits include Germany (6%) and Singapore (5%).
Country Shares of Global Spirits Trade in 2017
Source: Authors’ calculations based on FAOSTAT (2020).
Consumers’ growing preferences for a wider diversity of spirits (more international and “exotic” spirits) seem to be reflected in trade patterns that are becoming more dispersed over time. For instance, the UK's share of the value of global exports of spirits was 50% in 1965 and has halved over the past four decades. This is likely related to the fact that niche local specialties are starting to reach beyond their respective domestic markets. According to the International Wine and Spirit Research (IWSR) data, the majority of the fastest-growing spirits brands in 2019 were national or regional products including, for example, soju and baiju (IWSR, 2019).
An interesting example of this “local spirits going global” trend is the exponential growth of agave-based spirits in recent years. This was the fastest-growing category of spirits in 2017 (IWSR, 2019) and seemed to be reflected in a rapidly growing share of global spirits exports deriving from Mexico, which accounted for 5% of global exports in 2017.
VII. The Industrial Structure of the Spirits Industry
The industrial organization of distilleries has changed considerably throughout history. In the Middle Ages, spirits production was concentrated in monasteries. In the 16th and 17th centuries, the spread of distillation techniques combined with a growing commercial market for spirits led to a proliferation of small distilleries. Intriguingly, by the 18th century, spirits were still essentially produced with the technology developed by the Greeks and improved by the Arabs, that is, with the traditional “alembic (pot) still,” where the fermented beverage is heated, the alcohol evaporated, and then condensed through a tube into another vessel. At this point, distilling was still mostly a small-scale, often domestic, activity.
The Industrial Revolution changed this and transformed the spirits industry. A fundamental innovation was the introduction of new technology, called “column distilling.” Column distilling was patented in 1830 by Irishman Aeneas Coffey (1780–1852).Footnote 42 In column distilling, the alcohol-containing liquid is heated in a column made up of a series of vaporization chambers (Rothery, Reference Rothery1968). The new technology was more effective and allowed for distilling on a larger scale. From then onwards, the new technology stimulated spirits production to shift to large-scale factory production with continuous stills that could produce higher volumes at a lower cost compared to the traditional pot still (Forbes, Reference Forbes1947).Footnote 43
During the 20th-century mass marketing, improved transportation networks and urbanization contributed to further consolidation (Kinstlick, Reference Kinstlick2018). This was reinforced by the fact that several countries put regulations in place that prohibited or constrained small-scale production in an attempt to control excessive consumption of spirits.
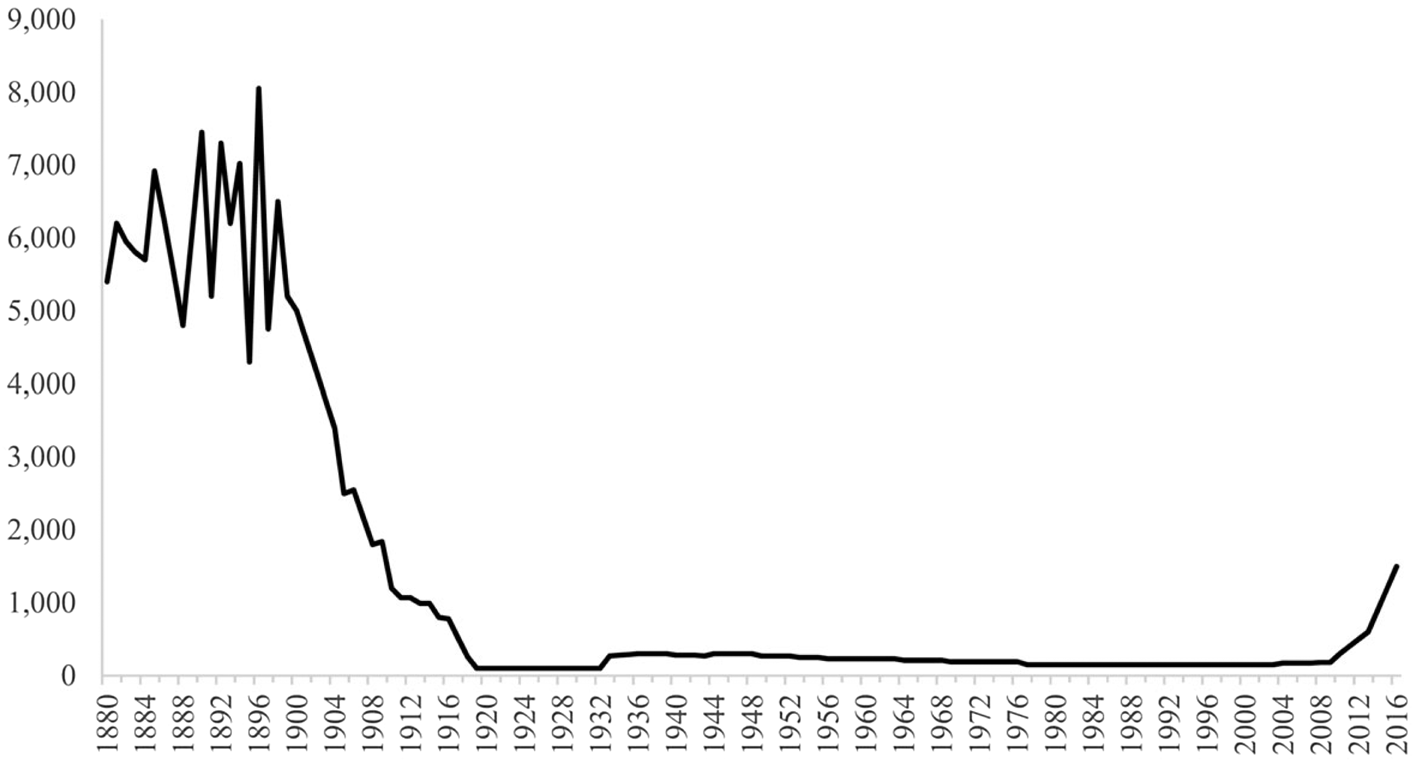
The dramatic consolidation of the spirits industry in the United States is illustrated by Figure 10. While there existed around 6,000 (legal) distilleries in the late 19th century, this number declined rapidly at the beginning of the 20th century. By 1916—before the Prohibition period (1919–1933)—there were only around 500 left. During Prohibition, there were no legal distilleries. After Prohibition, around 300 distilleries were active, a number that declined further to less than 100 by the end of the 20th century.
Licensed Distilleries in the United States, 1880–2016
Source: Kinstlick (Reference Kinstlick2018).

In recent decades, the spirits industry has experienced further consolidation across borders as a result of international mergers and acquisitions (M&As). Today, the global spirits market is much less concentrated than the global beer industry but more concentrated than the global wine industry. Small local spirits producers still account for the large majority of the market (80%), but two multinational companies have 15% of the global spirits markets; British Diageo with 10% and French Pernod Ricard with 5% (IAS, 2018).Footnote 44
While these major spirits companies have their historic markets in Western countries, they are increasingly focusing on emerging markets, and especially on Asia. The two main global spirits companies (Diageo and Pernod Ricard) actively sought to expand sales outside traditional spirits markets in high-income countries. Europe's share of Pernod Ricard's net sales fell from 43% in 2007 to 29% in 2018. The group benefited from its early presence in Asia, starting with the establishment of Pernod Ricard Japan in 1988. By 2010 Pernod Ricard's subsidiaries already covered 13 major Asian markets, from the Gulf countries to Japan (Pernod Ricard, 2008–2019).
Diageo has been slower to adjust, with North America and Western Europe still accounting for 65% of its spirits volumes in 2011 (Euromonitor, 2012). However, after stagnating sales there, Diageo increased its presence in emerging markets through acquisitions. In 2011, the company acquired the leading spirits producer and distributor in Turkey, Mey Icki. One year later, Diageo took control of Shui Jing Fang, a premium Chinese baijiu brand, Hanoi Liquor Joint Stock Company, the largest producer of branded spirits in Vietnam, and became the majority shareholder in India's leading spirits company, United Spirits Limited, in 2014 (Diageo, 2019). The company is also investing heavily in Africa, which—largely as a result of the rapidly increasing population at legal drinking age and rising incomes—is expected to become the next big growth region for the spirits industry (IWSR, 2019). By 2018, Africa, Latin America, and Asia Pacific accounted for 42% of net sales (Diageo, 2018).
VIII. Recent Developments: Premiumization, Craft, and Terroir
A. Premiumization
Although growth in the volume of consumption in mature spirits markets has halted, consumers in those markets do seem to spend more on higher-priced or premium spirits. Hence, despite declining volumes of consumption, “premiumization” continues to fuel the growth of spirits sales in at least some of the traditionally spirits-focused countries. This premiumization trend can be observed from global data. According to the Pernod Ricard Market View, the volume of consumption of “standard” spirits (i.e., price per 75 cl bottle between $10 and $17) rose by only 1% per year between 2007 and 2017, the annual growth for “premium” (i.e., price per 75 cl bottle between $17 and $26) and “super-premium” (i.e., price per 75 cl bottle between $26 and $42) spirits was much higher: 2.6% and 3.3%, respectively (Pernod Ricard, 2008–2019).
Interestingly, part of the premiumization appears to be due to a sort of “convergence in the consumption patterns of different types of spirits.” That is, the dominance of traditional or local spirits tends to decline over time, with consumers looking for more variety and more international drinks. In Russia, for example, consumers have moved away from vodka not just to beer but also to other spirits. Cognac and whisk(e)y are gaining terrain as they are viewed as more fashionable. Similarly, in France, a disaffection for traditional pastis and digestives such as Cognac, Armagnac, and Calvados has coincided with strong growth in the sales of rum, gin, and whisk(e)y. In the United States, the strongest growth in spirits sales between 2012 and 2017 was for tequila (Euromonitor, 2018a).
B. The Growth of Craft Spirits
Following earlier consolidation, the industry is experiencing a “craft” revolution. Craft spirits are becoming increasingly widespread across more mature markets including North America and Western Europe. Gin, vodka, and whisk(i)e(y)s are the biggest categories within craft spirits, as well as country-specific liqueurs. It is worth noting that although common elements involve restrictions on the quantity of production and independent ownership, there is no consensus on how to define craft spirits (Euromonitor, 2018b).
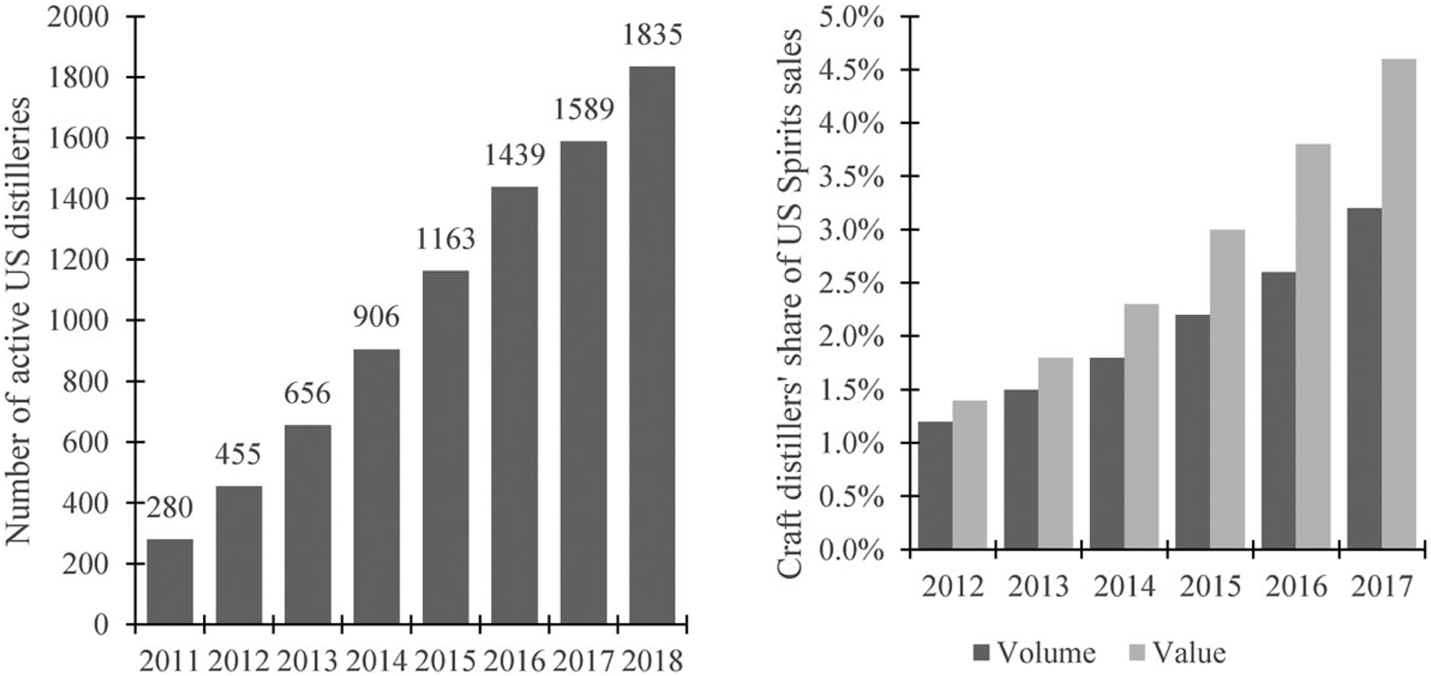
In the United States, the number of active craft distilleries grew from 204 in 2011 to 1,835 in 2018 (see Figure 11).Footnote 45 Their market share grew from 0.8% of value in 2010 to 4.6% in 2017 (see Figure 11). Investments in crafts spirits production in the United States have more than tripled in the past years, from $189 million in 2014 to $593 million in 2017 (ACSA, 2018). These trends are likely to be further amplified by recent tax reforms (i.e., Craft Beverage Modernization Act), resulting in a reduction in federal excise tax on distilled spirits for the first 100,000 gallons produced or imported annually. While, of course, beneficial for all producers, this tax cut will have the largest impact on smaller distillers.

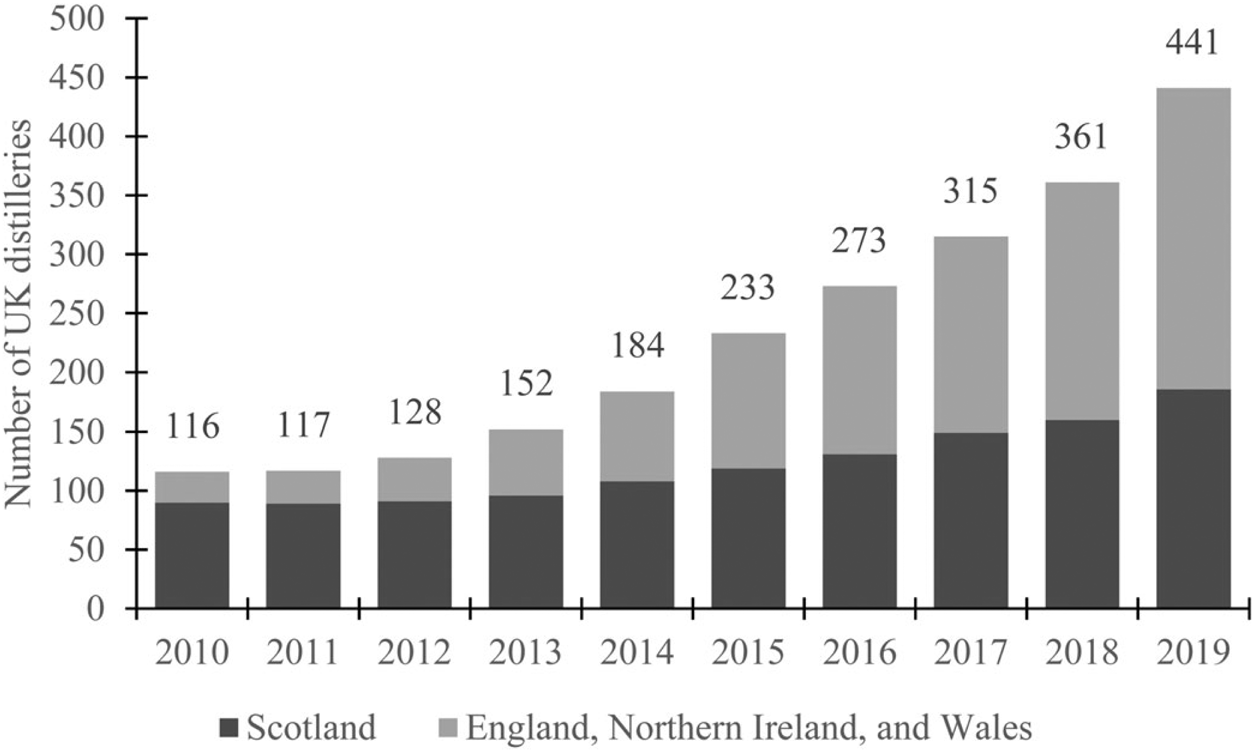
The rise of craft distilleries has also been strong in the United Kingdom and Australia. A milestone moment for the UK craft distilling movement was the repeal of a 1751 regulation in 2009 (HMRC, 2020).Footnote 46 The Gin Act of 1751 outlawed distilleries using a still with a capacity below 18 hectoliters—to contain the Gin Craze (as William of Orange had adopted an act in 1690 that allowed anyone to start distilling of spirits from corn) (Dillon, Reference Dillon2002). After 2009, the number of distilleries soared: from 116 registered distilleries in 2010 to 441 in 2019 (see Figure 12). Between 2016 and 2018, on average, two new distilleries were licensed every week (HRMC, 2020). Much of this growth is driven by gin: the number of gin brands in the United Kingdom grew from around 40 to 95 between 2010 and 2017 (WSTA, 2018).

Australia also appears to be amid a craft spirits boom. Following a complete ban of all distillation activities, the Distillation Act from 1901 prevented distilleries from using a still with a capacity below 27 hectoliters to obtain a license. This law was overturned in Tasmania in 1989, and the first new licensed distillery since 1839 was set up in 1992 (Australian Business Review, 2014). Soon after, other states followed. Today, approximately 210 craft distilleries are active in Australia, and the government has committed to supporting this growing industry (Australian Craft Distillery Directory, 2020). Since 2017, Australian craft distilleries can, for example, access a refund of excise paid. This measure extended the excise refund scheme that was already in place for craft brewers (Australian Government, 2017).
Ireland has witnessed impressive growth in whiskey distilleries: the number of Irish Whiskey distilleries grew from 4 to 20 in 2017, with at least 26 more at the planning or construction stage (ABFI, 2017). Craft spirits are also expected to gain momentum in South Africa, where 53 craft spirit producers were active in 2016, with another 47 in the pipeline (SACDI, 2016).
Whereas the big brands’ response to the craft beer movement was relatively slow,Footnote 47 the large players in the spirits industry now try to avoid losing market share by actively investing in craft distilleries. There has already been a host of acquisitions of small craft distillers by leading multinationals. Diaego, for example, partnered with Distill Ventures that invests in start-ups (Distill Ventures, 2019). Beam-Suntory acquired craft spirits brands such as Sipsmith (Beam Suntory, 2019).
The big brands are also adapting their marketing messages and products to adjust to changing consumer preferences. They are increasingly creating interesting stories around their brands and producing spirits with complex taste profiles and more crafty-sounding names and appearances (Euromonitor, 2018b). Moreover, since a clear legal definition of craft, as well as associated concepts, is lacking in most countries, big brands often resort to marketing their (mass-produced) products as “craft” (Johnnie Walker), “handcrafted” (Jim Beam), “handmade” (Tito's vodka), and so on. While several class-action lawsuits have been brought forward stating that this terminology is misleading the consumer, the rulings so far have mostly been in favor of the big brands.Footnote 48
Craft distilleries have been accused of misleading consumers as well. One of the challenges of starting a distillery is that the product is often not immediately available for sale since several types of spirits require time to age. It has been argued that a lot of craft distilleries, therefore, rely on large “third-party distillers” for their base spirit. Craft whiskey distilleries in the United States, in particular, have come under scrutiny for their lack of transparency on the origins of their products (Olmsted, Reference Olmsted2013).
C. Spirits and Terroir
Quality concerns and asymmetric information on alcohol have existed as long as products have been produced and traded. The addition of water to wine, the use of cheap starches to produce beer, and home production of cheap spirits have been documented throughout history and across the globe. Authorities and producer organizations have tried to limit these problems through regulations (Swinnen, Reference Swinnen2016, Reference Swinnen2017). Regulations that refer to “quality” often relate to certain inputs that can(not) be used. They also often refer to the “terroir,” that is, the location where production takes place or the raw material has to be sourced from.
Not surprisingly, France, where Geographical Indications (GIs) are widespread in wine and food production (see Meloni and Swinnen, Reference Meloni and Swinnen2013, Reference Meloni and Swinnen2014), has introduced some of the terroir regulations also in the spirits sector. French regulations define several spirits by law and impose production and labeling rules. For example, “Cognac” and “Armagnac” brandies must be made in specific geographic regions and follow strict sets of production rules.
Economic and political upheavals in the French wine markets in the late 19th and early 20th centuries led to the introduction of a series of regulations in the French wine sector. It was the birth of the GI system in France (a system that later expanded to the rest of Europe and the world)—see Meloni and Swinnen (Reference Meloni and Swinnen2018). At the beginning of the 20th century, in 1909, along with “Bordeaux” (1911) and “Champagne” (1908), Cognac and Armagnac were protected as “Appellations of Origin” (Appellations d'Origine–AO) products (Enjalbet, 1953; Huetz de Lemps, Reference Huetz de Lemps, Huetz de Lemps and Roudié1985). These regulations included the guaranteed sourcing of raw materials for Cognac and Armagnac from local producers and local distillation.
Similar regulations have also been introduced by other countries such as Scotland (for Scotch), South Africa (for certain brandies), the United States (e.g., Tennessee whiskey), and Mexico (tequila). Scotch or Scotch Whisky is made exclusively in Scotland subject to very strict regulations (such as the type of grain used, the minimum aging in oak barrels, or minimum alcoholic strength). In the United States, bourbon or Tennessee whiskeys also need to comply with certain raw materials (see Table 1). In Mexico, tequila, a distilled alcoholic beverage made from the fermented juice of Mexican agave plants, can only be produced in certain regions of Mexico and exclusively uses blue agave plants. Similar spirits produced with other agave plants and grown in other regions in Mexico (e.g., the Oaxaca region) are labeled “Mezcal.”
IX. Summary and Conclusions
This paper is the first to analyze the global development of spirits technology, its markets, and the industry. Around 50% of total alcohol intake in the world is consumed in the form of spirits, high-alcohol beverages whose alcohol content has been increased by distillation. This includes products such as vodka, rum, tequila, cognac, whisk(e)y, baijiu, etc. These different spirits are produced from different raw materials such as wine and grapes (brandy and grappa), grains (gin and baijiu), potatoes (vodka), sugar or molasses (rum), etc.
The production of spirits started later in history than beer and wine because the technology to produce spirits is more complex. The production process involves distillation and cooling technologies. Anthropological studies document distillation in China, the East Indies, the ancient Greek and Egyptian empires more than 2,000 years ago. However, it took innovations by the Arabs to produce alcoholic spirits as we know them today. In Europe, spirits production was limited until the 8th century, when contact with the Arabs improved knowledge of distillation and the spread of more advanced technologies.
Distillation was initially used to search for better perfumes, for cheaper ways to produce gold, and for eternal life (aqua vitae). In the Middle Ages, spirits were used mostly for medical purposes. Only from the 15th and 16th centuries onwards was distillation increasingly used to produce drinks such as brandy, whisk(e)y, gin, vodka, etc.
The growth in spirits production and consumption accompanied European conquests across the world. Spirits were more suitable for long ocean voyages than wine or beer because their high alcohol content meant they took up less space, did not spoil as fast, and leftovers could be sold at the destination. Soon new spirits, in particular rum, were also produced in the colonies and exported throughout the, especially British, colonial empires.
The Industrial Revolution transformed the production and consumption of spirits. Technological innovations and the associated scale economies in production reduced spirits’ prices. Scale economies in production and, later in marketing, contributed to significant consolidation in some of the spirits industries in the 20th century.
The Industrial Revolution also stimulated demand in growing urban areas among industrial workers. The combination of lower prices and growing demand contributed to widespread alcoholism and associated health and social problems. Growing alcohol-related problems in industrial areas and the potential for raising tax revenue led to a series of regulations on spirits and consumption tax increases from the 18th century onwards. Some countries prohibited the sales and consumption of spirits.
Still, over time global consumption of spirits has increased, and spirits are now dominating global alcohol markets. Over the past 50 years, the share of spirits in global alcohol consumption increased from around 30% to around 50%. The past decades have seen strong growth in emerging markets, including in China and India. At the same time, consumption has stagnated in mature markets in terms of volume. Growth in these markets has taken the form of higher-priced and specialty spirits. In the 21st century, craft spirits are also gaining importance, especially in high-income markets.