1. Introduction
Philosophers of science have used formal models to argue that the structure of communication and collaboration networks matters in science (see, e.g., Zollman Reference Zollman2007, Reference Zollman2010; Mayo-Wilson, Zollman, and Danks Reference Mayo-Wilson, Zollman and Danks2013; Grim et al. Reference Grim, Singer, Reade and Fisher2015; Holman and Bruner Reference Holman and Bruner2015; Rosenstock, O’Connor, and Bruner Reference Rosenstock, O’Connor and Bruner2017). One finding from this literature is that diversity of beliefs within an epistemic community is key to ensuring that the group eventually arrives at true beliefs about the world and that network structure can be crucial to preserving this diversity (Zollman Reference Zollman2010). At the same time, feminist philosophers of science have argued that personal diversity, that is, diversity with respect to personal identity markers such as gender, race, and cultural origin, is an important source of such epistemic diversity.Footnote 1
Given this work, we ask, What factors influence the diversity of epistemic collaboration networks? And, in particular, might discrimination affect these networks? We start by looking at the emergence of discriminatory norms in fixed collaboration networks. Such norms commonly evolve, and in particular we find support for previous work showing that minority status alone can make it more likely for a social group to be disadvantaged by bargaining norms (Bruner Reference Bruner2017; O’Connor Reference O’Connor2017a). Next, we explore the endogenous emergence of collaboration networks in a population that already has discriminatory norms, finding that such networks tend to become segregated to the point where there are no collaborative interactions across groups. Finally, we examine the simultaneous coevolution of discrimination and collaboration, where we see partially segregated networks evolve with some actors upholding the discriminatory norm. Overall these results suggest that discrimination in academia may decrease the personal diversity of collaborative networks. As described above, this may have negative impacts on the ability of epistemic communities to arrive at successful beliefs.
The article will proceed as follows. In section 2 we describe the Nash demand game, which will be the base model employed here to capture discrimination in academic collaboration. We will justify the use of the model for epistemic communities in particular. In section 3 we present our main body of results. We conclude by discussing the relevance of these results to epistemic communities and to epistemic progress.
2. Academic Bargaining and Discrimination
As stated, our aim is to analyze the dynamics that surround discrimination and collaboration networks in academia. This analysis is inspired, in part, by two sets of empirical results. The first suggests that in epistemic communities, women may get less credit than men for joint work. Sugimoto et al. (Reference Sugimoto, Lariviere, Ni, Gingras and Cronin2013) and West et al. (Reference West, Jacquet, King, Correll and Bergstrom2013), for example, find that women are less likely in many disciplines to hold prestigious author positions. Feldon et al. (Reference Feldon, Peugh, Maher, Roksa and Tofel-Grehl2017) found that among early PhD students in the biological sciences, women put in significantly more work but are significantly less likely to be granted authorship on the papers produced. Another set of results suggests that women are less likely to collaborate than men are and are more likely to collaborate with other women (Ferber and Teiman Reference Ferber and Teiman1980; McDowell and Smith Reference McDowell and Smith1992; Boschini and Sjögren Reference Boschini and Sjögren2007; West et al. Reference West, Jacquet, King, Correll and Bergstrom2013). Some findings suggest a similar pattern for black academics, with black criminologists less likely to coauthor (Del Carmen and Bing Reference Del Carmen and Bing2000). Botts et al. (Reference Botts, Bright, Cherry, Mallarangeng and Spencer2014) also find that black philosophers tend to cluster in subfields.
Part of our question is, Are these sets of results related? Does inequity in academic collaboration lead members of certain groups to self-segregate and thus decrease the effective diversity of collaborative teams? It is notoriously difficult to generate empirical data testing cultural evolutionary pathways. To explore these questions, we instead employ game theoretic models. Such models start with a game, or a simplified representation of a strategic interaction. To represent division of labor and credit between academic collaborators we use the Nash demand game (Nash Reference Nash1950).
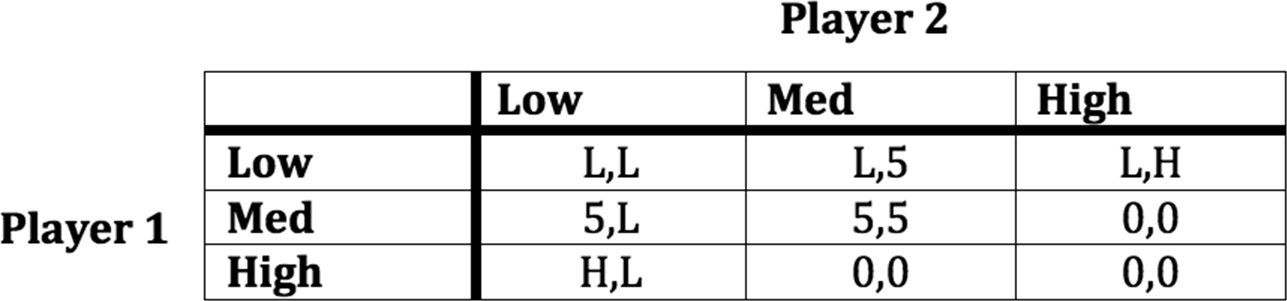
This game involves two agents who divide a resource by each demanding some portion of it.Footnote 2 If the demands are compatible, each agent gets what she requested. If the demands exceed the total resource, the agents get poor payoffs on the assumption that they cannot peaceably agree on a division. Figure 1 shows a payoff table for a “mini” version of this game in which actors have three demands—Low, Med, and High.Footnote 3 For simplicity’s sake, we assume that the total resource is 10, the Med demand is 5,  , and
 . This yields, for example, demands of 3, 5, and 7, or 1, 5, and 9. Strategies for player 1 are displayed in the rows of the table and strategies for player 2 in the columns. Each entry shows payoffs to each player for some combination of demands, with player 1 listed first. The poor payoff when actors overdemand the resource is assumed to be 0.Footnote 4
Payoff table for a mini Nash demand game.

It will be useful to take a minute to explain why this is a good representation of academic collaboration. Academic collaboration involves joint action, which creates a surplus of a credit compared to solo work.Footnote 5 However, this joint action necessitates two types of bargaining. First, actors must decide who will do how much work on the project. Second, actors must determine author order as a proxy for credit. The demands in the game, then, are best understood as requests for author position relative to the amount of work done. An actor who does the lion’s share of the work and requests first authorship makes a Med demand. One who does more work and requests second authorship makes a Low demand.Footnote 6
Suppose we have a population with two social groups—women and men, for example, or black and white people. Suppose further that actors can condition their choice of strategy on the group membership of an interactive partner. In a cultural evolutionary scenario, this induces a situation in which separate norms can emerge within and between groups.Footnote 7 For the Nash demand game, under most reasonable evolutionary dynamics, in-group members will most often evolve to all make fair demands of each other.Footnote 8 One of three things will happen between groups. Either the groups will come to demand Med of each other or else one group will learn to always demand High and the other to always demand Low when meeting out-group members. Axtell et al. (Reference Axtell, Epstein and Young2001) take these two latter sorts of outcomes to represent ‘discriminatory norms’: actors treat in- and out-group members differently, to the detriment of one out-group. We follow them in using these outcomes as representations of discriminatory norms of collaboration.
There is one further preliminary we will introduce before describing our models and results. Bruner (Reference Bruner2017) outlines the cultural Red King effect: that minority groups can be more likely than majority groups to end up disadvantaged in the emergence of bargaining conventions. This occurs as a result of differential reactivity on the part of the groups. While majority members rarely meet minority types, the reverse is not true, meaning that minority members learn much more quickly how to interact with the majority type. Since it is often best to make safe, low demands in the Nash demand game, these minority types can then end up quickly learning a behavior that ultimately disadvantages them.Footnote 9
In these minority-majority models, it is not always the case that small groups end up disadvantaged as a result of their quick learning. As Bruner (Reference Bruner2017) illustrates, under the right conditions bargaining payoffs are such that making high demands is worthwhile despite the risk, meaning that minority groups quickly learn to do so. This complementary effect is the cultural Red Queen. For the minigames just introduced, a cultural Red King is observed when L > 3, and a Red Queen otherwise. Below we will draw a connection between our results on the impact of minority status on norms of collaboration and this body of literature.
3. Networks and Bargaining
Now we use the framework sketched in the last section to build an explicit model of academic collaboration networks. In our model, agents in the academic community are represented by a collection of nodes. The presence of an edge, or link, between two nodes means that a collaboration exists between the two individuals, whereas the absence of an edge means that they do not collaborate. There are within-group links, connecting two nodes in the same social identity group, and between-group links, connecting two nodes in different social identity groups. The set of nodes and edges forms what we call the collaboration network.
In what follows, actors belong to one of two social identity groups, where one social identity group constitutes a minority of the total population. We will be particularly interested in results in which the majority discriminates by demanding High when interacting with minority group members who in turn demand Low. We will also take note of the norm in which the minority discriminates, demanding High against majority group members, and the norm of fair division, where both groups demand Med against each other. Our models assume that actors condition their behavior on the social identity of their collaborative partners, so our results will be relevant to understanding discrimination and lack of diversity only when the groups of interest are divided according to a feature real people would actually condition their behavior on, for example, race or gender but not eye color.Footnote 10
Our exploration of discriminatory norms and collaboration will proceed in three parts. First, we show that when agents are on a network, the minority group can be disadvantaged solely due their relative proportion in the population. Second, we will show that when there are preexisting discriminatory norms in the community, networks tend to become completely segregated. Third, we show how these two parts of the story relate to each other by providing a model in which agents’ bargaining strategies coevolve with the structure of the collaboration network. We will see that discriminatory behavior tends to arise between many members of the community. Further, as this behavior arises, the collaboration networks tend to become partially segregated, with agents mostly interacting with others in their own social identity group.
3.1. Part A: The Evolution of Discrimination on Fixed Networks
First, we examine the effects of network structure on the evolution of discriminatory norms. Poza et al. (Reference Poza, Galán, Santos and López-Paredes2010) use a similar framework to show that discriminatory norms do commonly arise on networks with agents of different types playing the Nash demand game. In looking at these models with minority/majority statuses for the two groups, we find that the minority group can be disadvantaged, in that they are more likely to be discriminated against. Further, we investigate whether homophily, the tendency to preferentially form links with members of your own social identity group (Lazarsfeld and Merton Reference Lazarsfeld, Merton, Berger, Abel and Page1954; Jackson Reference Jackson2010), exacerbates the effect.
3.1.1. Model
We use multitype random graphs, networks that are used to model populations with multiple social identity groups (Golub and Jackson Reference Golub and Jackson2012). In this setup, agents are classified according to which type they are (in this case, whether they are a minority or majority group member). Each agent has some probability of forming a link with an agent of the same type, p in, and some probability of forming a link with an agent of a different type, p out. If  , we say that the agents exhibit homophily.
Once the network is formed, agents update their strategies based on the payoffs they receive by interacting with their collaborators—those they are connected to on the collaboration network. Each agent’s strategy consists of two parts: a demand when interacting with an in-group member and a demand when interacting with an out-group member. These strategies are initially randomly assigned. Each round, agents interact with all of their collaborators and, with a small probability, will decide to update their strategy. Strategies are updated using myopic best response: in the next round, the strategy agents will use is the one that would have gotten them the best payoff in the current round, given the strategies of their collaborators. This captures the fact that agents are trying to choose a strategy that is likely to result in their getting the most out of a successful collaboration while avoiding the poor payoff from a failed collaboration.
3.1.2. Results
We look at the frequencies with which populations converged to different bargaining norms. Cases in which two or fewer agents were playing strategies outside the equilibrium expectation were counted as converged since, on the basis of the probabilistic nature of the model, these agents may not have had a chance to update their strategies. The probability of updating a strategy in any given round was .1. Simulations were run for 1,000 rounds over networks ranging from 20 to 100 agents (in intervals of 20), where the high demand (H) ranged from 6 to 9 and the minority group constituted 10%–50% of the population. While for all simulations the probability of a within-group link was held fixed at  , the probability of an out-group link p out ranged from .2 to .8. (That is, we look at a range of cases, from cases in which the minority was twice as likely to collaborate with in-group members to cases in which the minority is twice as likely to collaborate with out-group members.) Each combination of parameter values was run 100 times.
Within each group, populations nearly always evolved to the norm of equal division. Between groups, populations most often evolved to the norm of fair division, but a significant amount of the time they also evolved to a discriminatory norm, as in Poza et al. (Reference Poza, Galán, Santos and López-Paredes2010).
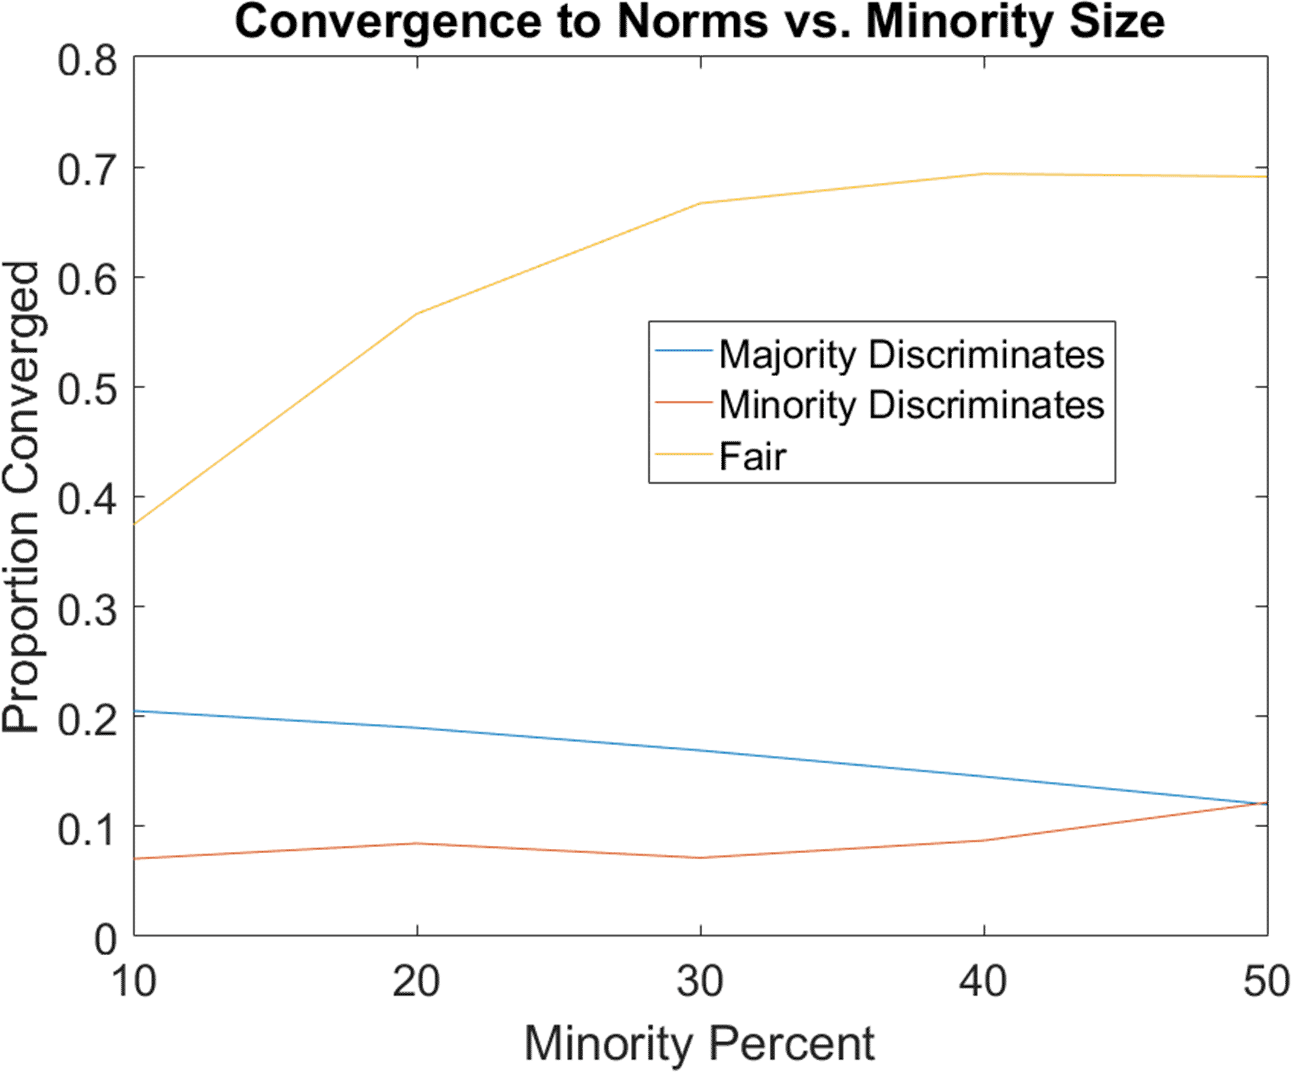
We now look at whether minority status has any effect on the likelihood of being discriminated against. Figure 2 shows results for high demand, H = 6. For a small minority group, it is more likely that the majority group will end up demanding High against the minority. As the size of the minority group increases, the fair division becomes more likely and both groups become equally likely to discriminate.
Convergence to different norms over size of minority group for  .

This effect results from an asymmetry in the average number of links for each group. Consider a simple demonstrative example. If there are 10 majority group members, five minority group members, and 10 total between-group links, on average, majority group members will have one between-group link and minority group members will have two. If a minority group member has two links, both of these collaborators would have to be demanding 4 in order for their best response to be 6. At least initially, this would happen with only probability 1/9. On the other hand, only one of these collaborators would have to be demanding 6 in order for the best response to be demand 4, and, at least initially, this happens with probability 5/9.Footnote 11 In contrast, a majority group member having one link to the minority would have a 1/3 chance of each of the strategies being a best response (she demands the complement of whatever her collaborator demands). So, at the start, a minority group member is much more likely than a majority group member to demand 4 and much less likely to demand 6. This asymmetry drives populations toward the outcome in which the majority demands 6.
Our findings are somewhat similar to previous results on the cultural Red King/Queen effect described above. However, minority disadvantage does not arise here due to an increased speed of learning in the minority group, but rather due to differences in the best responses of the group. Furthermore, while we observe minority disadvantage, which is analogous to the cultural Red King effect when H = 6, we do not observe an analogue of the Red Queen for higher levels of H.
To understand why nothing similar to the Red Queen occurs, consider the same simplified example as above, but now with H = 9. Again, majority group members having one link to the minority would have a 1/3 chance of each of the strategies being a best response, as they still care only about demanding the complement of their collaborator. Now, though, the minority group members are very unlikely to make the Low demand of 1; it is a best response only with probability 1/9 when both of their collaborators demand 9. They are just as likely as the majority to demand 9 (doing so with probability 1/3, whenever both their collaborators demand 1 or one collaborator demands 1 while the other demands 9). More importantly, though, it is most likely that the minority group member’s best response will be to demand 5. This will be the best response whenever at least one of their collaborators demands 5, which happens with probability 5/9. So the evolution of strategies is again affected by the minority group’s initial best responses; but in this case it is likely that the frequency of the Med demand in the minority will increase, followed by the majority learning to also make Med demands.
We also found that varying levels of homophily did not influence whether the majority or minority group is more likely to discriminate.Footnote 12 Since agents are updating their in-group and out-group strategies separately, how the within-group linking probability compares to the out-group linking probability does not have an effect on how often the network converges to a discriminatory norm. So the existence of majority group advantage does not depend on the existence of homophily.
3.2. Part B: Existing Discriminatory Norms Affect Network Formation
We now examine how the collaboration network will evolve when there is already a discriminatory norm in place. Agents’ bargaining strategy is held fixed, while their choice of whom to collaborate with evolves over time. Bruner and O’Connor (Reference Bruner and O’Connor2017) find that in epistemic communities, discriminatory norms can disincentivize collaboration between social groups. They look at a model in which there is an option to work alone and actors are not arrayed on a network, and they find that minorities will learn to do solo work more often when discriminated against. As will become clear, our results complement this finding.
3.2.1. Model
We employ a model similar to that of Watts (Reference Watts, Dutta and Jackson2003) in which agents can choose to form or break links with other agents in the community based on their payoffs from bargaining with those other agents. Each link represents a collaboration and therefore a payoff from the Nash demand game. Since we are investigating the effect of a preexisting discriminatory norm, majority group members receive a payoff of 6 from a between-group link while minority members receive a payoff of 4.Footnote 13 Agents receive a payoff of 5 from within-group links, where there is a norm of fair division. Agents have a maximum number of links, capturing the fact that there are a limited number of projects academics can work on. A player can unilaterally sever a link, but both players must consent to a new link being formed. This represents the fact that all the researchers involved in a collaboration must consent to be part of the collaboration. If one person no longer wishes to collaborate, the collaboration fails and the link is broken.Footnote 14
The evolution of the collaboration network proceeds as follows. We begin with an empty network (there are no links between any nodes). At each time step, two nodes are chosen at random. One of these is an agent who will update her links and the other is a potential or current collaborator of the agent.
If we have chosen a potential collaborator, we determine whether both researchers will consent to form a new link. If neither player has reached the maximum number of links, they will both consent. (Getting some payoff is better than none.) If either, or both, of them already have the maximum number of links, we check whether they will break any of their existing links to form the new link. If players can increase their payoff by breaking their link with the lowest payoff in order to form this new link, they will consent to the new link. If both players consent to the link forming, this new link will form, and agents will break links to the collaborator with which they receive their lowest payoff.Footnote 15 If at least one of them does not consent, no links are formed or broken.
By contrast, if we have chosen a current collaborator, the agent has an option to break the link and form a new one. A potential collaborator is chosen at random from the community. Then, if the agent would get a higher payoff from linking to this new potential collaborator, she tries to form a link. If the potential collaborator would also like to form a link with the agent, the link is formed. The agent breaks the link with the old collaborator (and the agent’s new collaborator breaks her link with the lowest payoff collaborator if she already had the maximum number of links).
3.2.2. Results
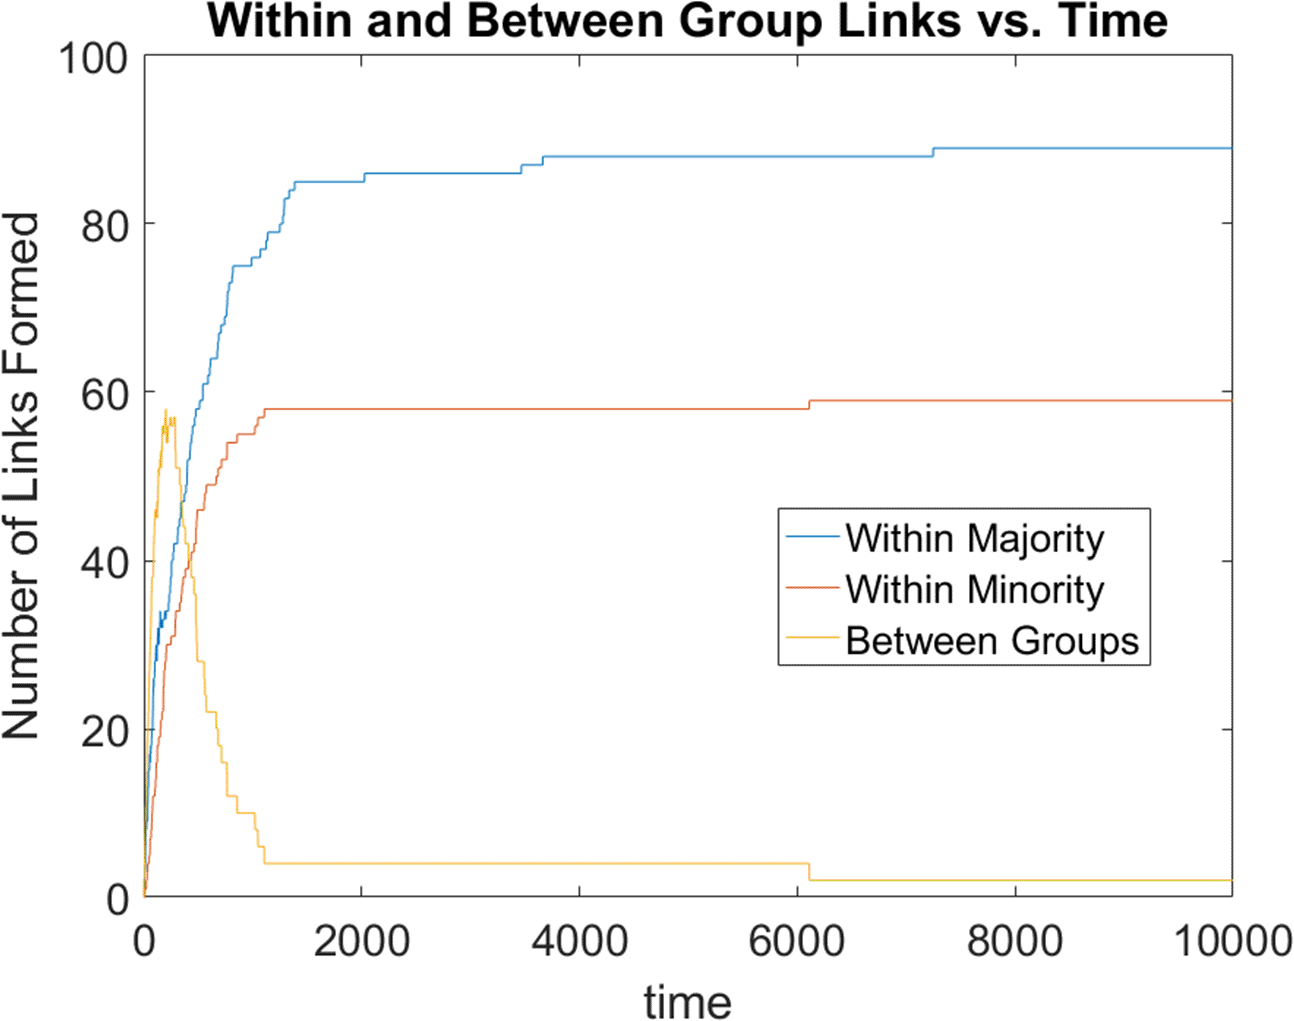
Across a wide range of parameters, the network reliably converges to the point where researchers collaborate only within their own group.Footnote 16 Figure 3 provides an example of how this occurs. Initially, links form steadily within each group and also between groups, as researchers have not yet formed the maximum number of links. Once minority group members have reached the maximum number of links, they begin to break their links with majority group members whenever they have the opportunity to form a new link with another minority group member, which yields them a payoff of 5 rather than a payoff of 4. So between-group links decline and links within the minority group increase.
Example of the evolution of a network with discriminatory norms, with 100 researchers, the minority group making up 40% of the population,  , and the maximum number of links set to 3.

Simultaneously, links within the majority group increase. The reason is that as minority group members break their links with majority group members, the majority group members look to form new links. Minority group members will refuse to form new links with them, but other majority group members (if they also have less than the maximum number of links) will agree to form the link. Note that in figure 3, fewer links exist within the minority than within the majority simply because there are fewer minority group members and so fewer possible links. The important trend is that links between groups decrease over time until they are essentially nonexistent.Footnote 17
To this point, we have interpreted credit in the models here as resulting from purposeful division among collaborators, but it is worthwhile pointing out that academics do not fully control how credit is divvied out. There is evidence, in particular, that members of traditionally disadvantaged groups do not receive as much credit for collaborative work, even when author order is determined fairly. Sarsons (Reference Sarsons2017) finds that in economics, where author order is alphabetical, coauthoring does not decrease men’s chances of getting tenure, but women who coauthor are less likely to be tenured. This effect is not as strong when women coauthor with other women. The implication is that the effects we have been describing might occur even when collaborators attempt a fair division. If the payoff to minority types for between-group collaboration is, in fact, lower nonetheless, they still might learn to avoid such collaborations.
3.2.3. Bigger Academics, Bigger Pies
In the model we have just presented, the communal norm determines credit share for all agents, and this predictably affects the network structure. As we have pointed out, those who are being discriminated against will want to avoid this discrimination. One assumption of this model, though, is that agents of both sorts generate the same amount of credit, which may not apply in certain cases.
There are (at least) two plausible scenarios in which members of one social group will produce more credit than those of another. The first is an interpretation of these models in which the groups are stages of the academic hierarchy—graduate students, postdocs, early professors, established professors, and so forth. In such a case, established academics have the experience and social standing to publish better papers in better journals and to expect that their results will be more widely read and cited. The second plausible scenario of this sort is one in which members from a traditionally excluded social group are first moving into a discipline. We can expect members from such small minority groups to have less access to the sorts of experience and prestige just described and so to produce less credit on average.Footnote 18
Importantly, such considerations can change the outcome of the models just discussed. Assume that the different types of collaborative pairings—in-group collaborations among established academics, between-group collaborations, and in-group collaborations between less established academics—generate descending amounts of credit for the reasons just described. Perhaps the total credit generated in the three cases is 15, 12, and 10. Demands in the game are then for proportions of these resources, say .4, .5, and .6.
Varying these parameters, maintaining our assumption that discriminatory norms hold, and always assuming that those who produce more credit are the discriminators, we can yield three different sorts of outcomes. The first are those we have described in section 3.2.2. Second, there are parameters in which members of both types are incentivized to engage in only out-group collaboration. Suppose the three pie sizes are 15, 14, and 10. The established group will get 7.5 for within-group collaboration, and the less established will get 5. For between-group collaboration, the payoffs will be 8.4 and 5.6, respectively. In other words, the less established group is willing to do more work and get a smaller proportion of the credit in order to share in the larger pie. The more established group is willing to produce a smaller pie as long as the members receive a larger portion of it. Such a situation seems to correspond well with what we see when professors and graduate students collaborate, for example.
There is a third outcome in which we again see complete segregation, but for a different reason. In this case, the established group produces such an excess of credit that its members are unwilling to collaborate with the out-group even when they can take advantage of out-group members. For instance, if our pie sizes are 18, 13, and 10, the in-group payoffs are then 9 and 5, while the between-group payoffs are 7.8 and 5.2. Here the members of the less established group would like to collaborate, even if they do more work and receive a smaller proportion of credit. But the established group is unwilling to do so.
3.2.4. Diversity and Credit
In the introduction we discussed the idea that diversity might be important to scientific progress. If so, we might expect that the credit generated by diverse collaborative groups will sometimes be greater than that generated by homogeneous ones. Some empirical findings back this up. Freeman and Huang (Reference Freeman and Huang2015), for example, show that cross-cultural collaborations generate more credit in the form of citations. Campbell et al. (Reference Campbell, Mehtani, Dozier and Rinehart2013) find the same thing for gender diverse collaborations in ecology. And Barjak and Robinson (Reference Barjak and Robinson2008) find that culturally diverse academic teams are more productive.
To capture such a possibility, we can alter the model so that while in-group collaborations generate 10 units of credit, between-group collaborations generate more. Whether or not homophily emerges will then depend on the level of discrimination and the size of the credit boost from diversity. For instance, if between-group collaborations generate a pie of size 12 and the minority group gets 40% of the credit generated, their expected payoffs are 5 with their in-group and 4.8 with the out-group, meaning we should still expect segregation despite the extra payoff diversity generates. If we increase this number to 14, the minority group now gets 5.6, and we expect individuals to form only between-group collaborations. If we suppose more serious discrimination has emerged, so that minority types get only 30% of the credit, say, it will take a between-group pie of 17 to prevent segregation. Still, for any level of discrimination, if there is enough of a credit boost for diverse collaborations, we should not expect homophily to emerge.
Schneider et al. (Reference Schneider, Rubin and O’Connor2017) use models like those presented here to discuss possibilities for promoting diverse collaborations, despite natural tendencies toward homophily. One such possibility is for funding bodies to give more grants to diverse collaborative teams, increasing their average credit generated. This yields a model like the one just described: between-group collaborations split a bigger pie than within-group collaborations. As they point out, this does decrease homophily in network formation models. There is a downside, though. In the models we describe in section 3.2.2, while there is complete homophily, there is no active discrimination occurring because no one maintains a collaborative bond where they receive the Low demand. In models in which between-group collaboration is incentivized, by either funding agencies or the natural benefits of diversity, minority groups will be willing to accept inequitable arrangements with out-group members. These arrangements provide a net benefit over in-group collaboration but provide a much more significant benefit for those in the majority. What we see in such a case is a tension between a social good (diverse collaborations that improve the progress of science) and equity between individuals.Footnote 19
The general takeaway here is that the collaboration network we expect to evolve will vary on the basis of both the structural situation for academics (i.e., who is poised to create credit) and the existing norms of bargaining. In particular, there are multiple, realistic configurations of these features that yield segregated coauthorship networks.
3.3. Part C: The Coevolution of Bargaining with Networks
So far, we have seen the effects of the collaboration network’s structure on the evolution of discriminatory norms and, conversely, the effect of discriminatory norms on the evolution of the collaboration network’s structure. In this section we explore what happens when we allow both agents’ strategies and their choices of collaborators to coevolve.
3.3.1. Model
We start with an empty network, with each agent’s strategy randomly determined. In each round, there is some small probability that each agent will take an action. There are two types of possible actions: updating your bargaining strategy and updating your set of collaborators. So if agents take an action in the round, there is a chance they will update their set of collaborators and a chance they will update their strategy (agents do not update both at once). Updating sets of collaborators is done via breaking and reforming links, as described in section 3.2. Strategies are updated via best response, as described in section 3.1.
3.3.2. Results
We look at results for a network of 100 researchers where H = 6. We ran simulations for 20,000 rounds, varying the size of the minority group from 10% of the population to 50%, in intervals of 5%, and varying the maximum number of links (either 3 or 9). Each combination of parameter values was run 100 times. In each round, agents take actions with probability .1. If they act, there is a 20% chance they will update their set of collaborators and an 80% chance they will update their strategy. (The particular probabilities are not important; similar results can be obtained for a variety of values.)
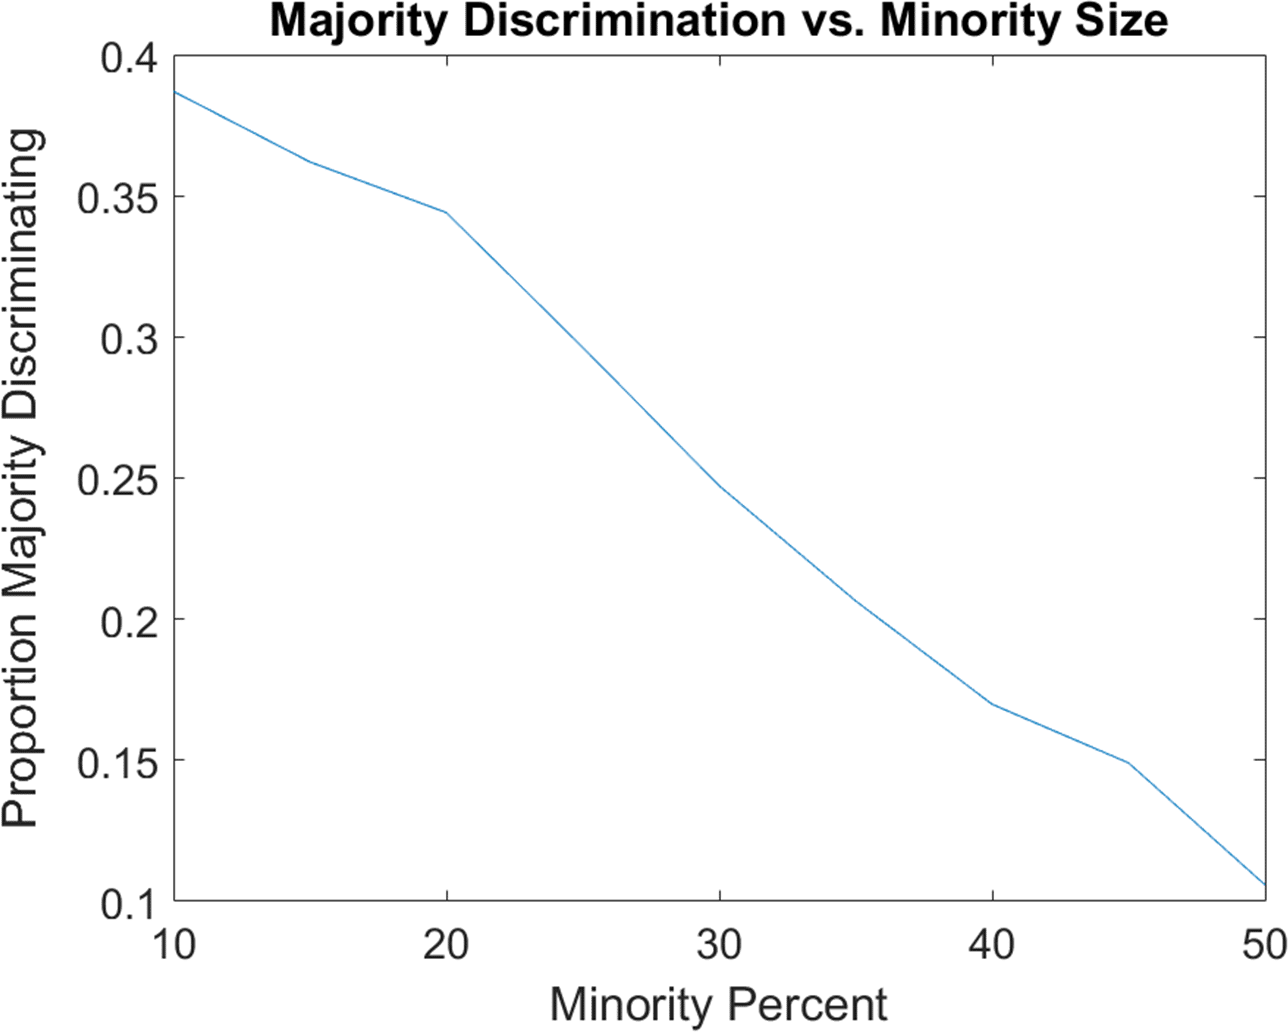
As in section 3.1, within groups, the likely outcome was fair division, so we will focus on between-group strategies. We are particularly interested in the likelihood of majority discrimination and the effect it has on the collaboration network. As figure 4 shows, the larger the minority group is, the less likely it is that majority group members will discriminate against them, just as in section 3.1.
Level of majority discrimination, given by the percentage of the majority group whose out-group strategy is to demand High, with different sizes of minority groups.

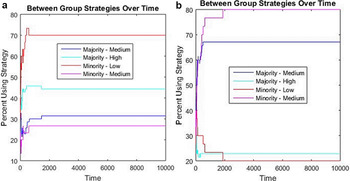
However, the patterns of discrimination in these models are different from those in previous models. Groups do not end up at consistent norms where all members make the same demand of the out-group. Instead we see outcomes in which some discrimination and some fair treatment emerge between groups. Figure 5 shows the evolution of between-group strategies for two different runs of the same simulation.Footnote 20 In panel a we see an outcome in which more majority group members demand High and minority members Low. Panel b shows a run in which both sides tend to demand Med. Note that in both cases, as mentioned, the network does not fully settle into either norm. To understand why this is the case, let us look at the evolution of the collaboration network.
Evolution of between-group strategies over time. Data for the majority demanding Low and the minority demanding High are omitted for simplicity. Panel a shows an outcome in which the high demand quickly spreads in the majority population. Panel b shows an outcome in which the medium demand quickly spreads in the majority population.

As in section 3.2, both within- and between-group links increase initially, and then between-group links decrease. In particular, discriminatory between-group links tend to be dropped, while fair ones remain. Once an agent has no more links to the other group, she stops updating her between-group strategy. This explains why the network never fully settles on one norm or another. Discriminators who have lost their minority group links retain latent discriminatory strategies that are never updated.
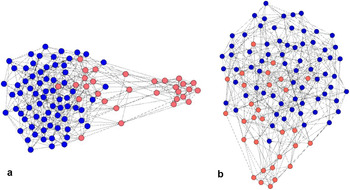
Figure 6 shows the network structure of the two runs shown in figure 5. As is easy to see, this process leads to collaboration networks that are homophilic but not fully segregated. In fact, there is a continuum of possible outcomes, ranging from everyone in the network reaching the norm of fair division (with no homophily in the network) to all majority members discriminating (with a totally segregated network having no links between social identity groups). Nearly all outcomes are somewhere between these two extremes: partially segregated networks with some members of the majority group upholding the discriminatory norm.
Possible collaboration network outcomes. Pink nodes represent minority group members and blue nodes represent majority group members. Panel a shows an outcome in which demanding High is common in the majority population and homophily is .4921. Panel b shows an outcome in which demanding Med is common in the majority population and homophily is .1005.

In order to quantify how the level of discrimination in a network affects homophily, we use the following measure of inbreeding homophily (which we will denote Ii) from Currarini, Jackson, and Pin (Reference Currarini, Jackson and Pin2009):

where Hi is the proportion of a group i’s links that are within-group links and wi is the fraction of the population that group makes up. Thus, inbreeding homophily measures how homophilic groups are (by calculating the proportion of their links that are within-group) compared to how homophilic they could be (the 1 in the denominator represents 100% of links being within-group), while controlling for the possibility that groups could make up different proportions of the total population (by subtracting wi in both the numerator and denominator).
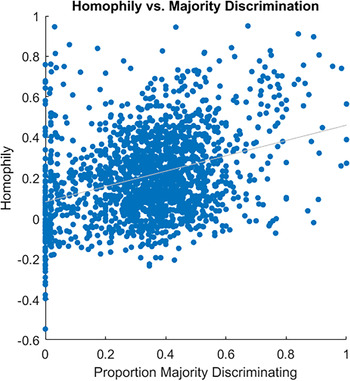
As figure 7 shows, more discrimination means more homophily. This is a very stochastic process, as one can see from the wide spread of possible levels of homophily for each level of majority discrimination. However, if we look at the regression line, we see an overall trend where as more of the majority group discriminates, homophily is stronger.Footnote 21
Level of homophily, measured using inbreeding homophily, with changes in majority discrimination, given by the percentage of the majority group whose out-group strategy is to demand High.

4. Discussion
We can now return to the empirical results mentioned in the beginning of section 2. As is evident from parts B and C of the last section, our models suggest a connection between evidence that women receive less credit in collaboration and evidence that women tend to collaborate less and more often with other women. Furthermore, our models provide a potential mechanism for in-group clustering in academia. Those who get less by dint of discriminatory social norms may take steps to protect themselves from discrimination.Footnote 22
What is the upshot for epistemic communities and epistemic progress? As mentioned in the introduction, diversity has been championed as an important feature of successful academic communities both by those in feminist epistemology/philosophy of science and by those doing formal work in social epistemology. Does the type of homophily we attempt to explain actually impede epistemic progress?
There might be reason to think not. As long as diverse ideas are present somewhere in a community, why should it matter whether collaborations happen between groups or not? For example, suppose a researcher from one social identity group is likely to figure out A and a researcher from another group B. If they collaborate, then they might also together conclude C, which follows from A & B. However, the community has another route to knowing C: A and B are published separately; then the community as a whole has access to these ideas and concludes C for themselves.Footnote 23 Okruhlik (Reference Okruhlik1994) seems to have a picture somewhat like this in mind: diverse researchers will generate and test diverse hypotheses, which will then be assessed by the usual scientific methods.
There are few reasons why we think diversity within collaborations might be important. First, it is possible that A and B independently are not interesting enough to warrant publication and that they are valuable realizations only insofar as they jointly imply C. If this is the case, it is reasonable to think that A and B would never be published on their own. This might be especially likely if members of one group struggle to publish in top journals due to reputational effects. There is reason, as well, to think that the actual process of collaborating with those unlike ourselves might influence deliberation and discovery. For example, Sommers (Reference Sommers2006) finds that deliberation processes proceed differently on racially diverse juries in that members share more information. And Phillips et al. (Reference Phillips, Northcraft and Neale2006) find improved problem solving in small, racially diverse groups.
Finally, even if collaborations with diverse authorship do not tend to be of higher quality, homophily alone can impede epistemic progress. Information spreads more slowly through homophilic networks (Golub and Jackson Reference Golub and Jackson2012), so a homophilic epistemic network will be less efficient in that it will take longer for the community to reach various conclusions.Footnote 24 Under certain assumptions, such homophilic networks can also prevent the spreading of new and better scientific practices throughout the community as a whole (Schneider Reference Schneider2017).
Our models suggest a process by which academic communities can spontaneously undiversify in the face of discriminatory bargaining norms. Furthermore, they suggest that such norms can emerge in academic communities under many conditions and are more likely to affect minority groups. As we note above, this may help explain patterns observed in real communities where minority groups receive less credit and tend to collaborate less. Those interested in intervening on epistemic communities may find these results useful in that they generate a theoretically well-grounded hypothesis for why we see such patterns.
 H=6
 H=6