1. Introduction
Platinum-group elements (PGEs) are highly siderophile elements that prefer metallic phases and as a result were almost entirely sequestered in the Earth's core during its formation. Albeit very low (at the parts per billion level), the PGE abundances of the mantle are considered to be too high, at variance with the core/mantle equilibrium model. This has led many to postulate a late veneer hypothesis, where extraterrestrial material was added to the Earth's upper mantle after the core formation (Chou, Reference Chou1978; Morgan et al. Reference Morgan, Walker, Brandon and Horan2001). Mantle-derived rocks may bear important information about the behaviour of PGEs during mantle melting, and, consequently, understanding this may aid in deciphering the planetary differentiation processes.
In the mantle and crust where free metal phases are essentially absent, sulphides exert the dominant control on the distribution of PGEs, owing to the chalcophile affinities of these elements. Understanding the geochemistry of mantle-derived rocks then becomes important regarding potential insights for exploration of precious metal and sulphide deposits on Earth's surface. Indeed, many earlier studies of PGEs in magmatic systems were inspired by the metal potentials of mineralized large igneous provinces (LIPs), such as the Permo-Triassic Siberian LIP (e.g. Brügmann et al. Reference Brügmann, Naldrett, Asif, Lightfoot, Gorbachev and Fedorenko1993).
Studies of PGEs in basaltic systems are much less abundant than those on ultramafic rocks, presumably reflecting an analytical challenge in quantifying the ultra-low PGE concentrations in basalts. With advances in analytical techniques, for example using improved Carius tubes at high temperatures and pressures combined with isotope dilution (Qi, Zhou & Wang, Reference Qi, Zhou and Wang2004; Qi et al. Reference Qi, Zhou, Wang and Sun2007), routine analysis of PGEs has become possible for a variety of rock types and concentrations in recent years. This has provided increased PGE data from mafic systems, especially from the Siberian, Deccan and Emeishan LIPs, and Hawaii (e.g. Lightfoot & Keays, Reference Lightfoot and Keays2005; Wang, Zhou & Qi, Reference Wang, Zhou and Qi2007, Reference Wang, Zhou and Qi2011; Crocket & Paul, Reference Crocket and Paul2008; Qi, Wang & Zhou, Reference Qi, Wang and Zhou2008; Qi & Zhou, Reference Qi and Zhou2008; Ireland, Walker & Garcia, Reference Ireland, Walker and Garcia2009). In spite of this improvement, most published data for basalts were obtained from tholeiitic and picritic basalts from LIPs, and few (e.g. Vogel & Keays, Reference Vogel and Keays1997; Crocket, Reference Crocket2002) have addressed the PGE systematics in alkaline/transitional basalts from smaller-volume intraplate volcanic fields, which are the subjects of this study. An additional incentive behind this study is that alkaline basalts are generally thought to have been S-saturated at the source and to contain extremely low PGE contents (e.g. Hamlyn & Keays, Reference Hamlyn and Keays1986; Vogel & Keays, Reference Vogel and Keays1997). However Mungall et al. (Reference Mungall, Hanley, Arndt and Debecdelievre2006) showed that this is not always the case and reported high-PGE meimechites, which are considered alkaline picritic lavas, with near-chondritic PGE ratios from the Siberian LIP. Although such extremely rare alkaline picritic rocks are unlikely to be the parental magmas of the more common alkali olivine basalts, their high-PGE nature raises the question of what controls the PGE budgets of alkaline magmas. In the subsequent sections we show that the alkaline/transitional basalts from NW Syria exhibit extremely low concentrations of PGEs, comparable with alkali basalts from Hawaii and mid-ocean ridge basalts (MORBs). These values are attributed to retention of sulphides in the mantle during partial melting and melt extraction, and/or to a source feature by virtue of the presence of PGE-poor mafic lithologies in the mantle. We have also observed suprachondritic Pd/Pt in some of the basalts, and consider this to be a metasomatic feature inherited from the source.
2. Geological background
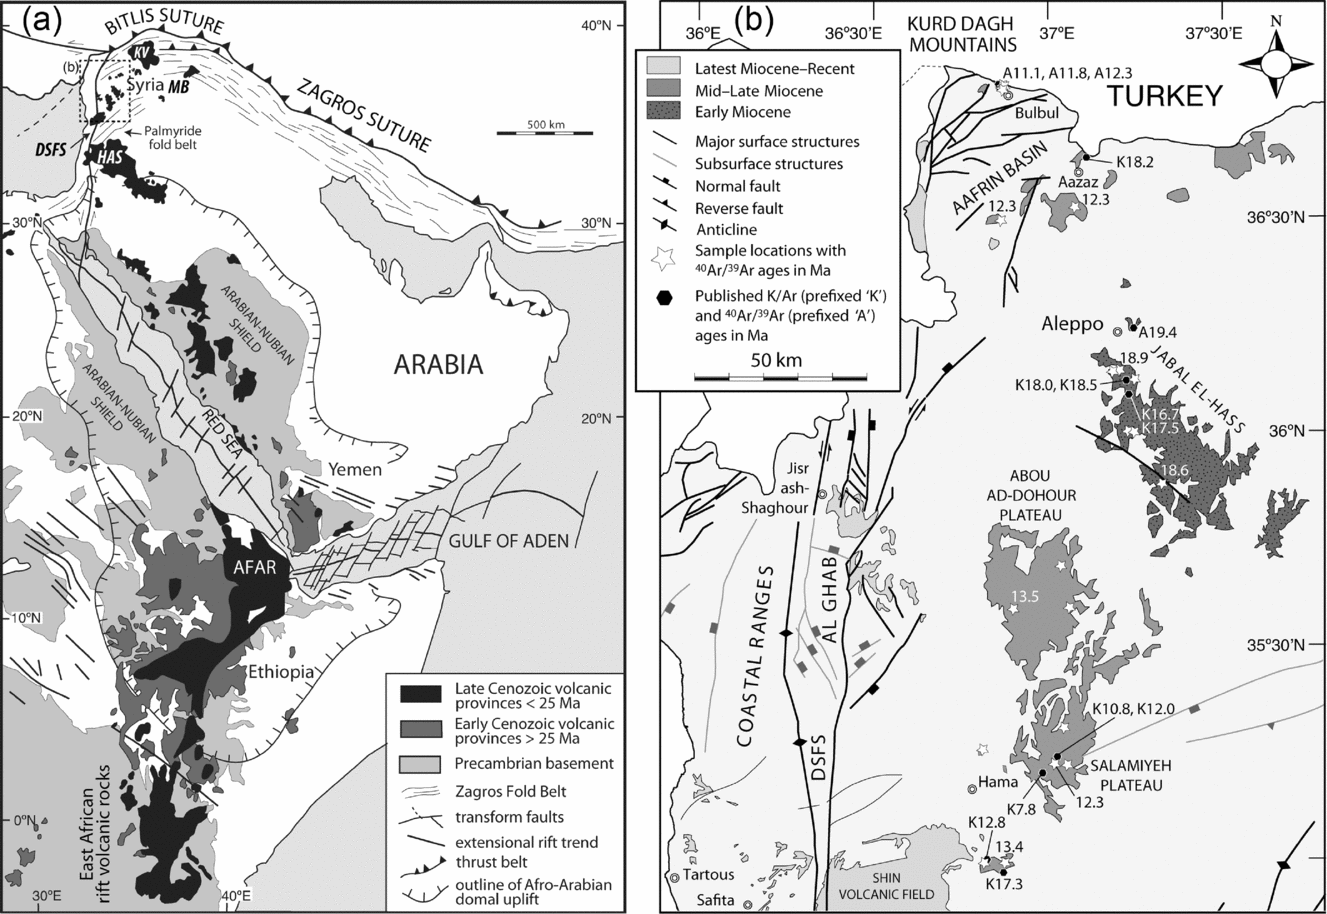
Arabia comprises a number of Mesozoic to Cenozoic volcanic fields with associated intrusions along the Rea Sea and Mediterranean coasts (e.g. Lustrino & Wilson, Reference Lustrino and Wilson2007; Ma et al. Reference Ma, Malpas, Xenophontos, Suzuki and Lo2011b ). Where occurring on the carbonate platform, outcrops of the Cenozoic volcanic rocks, mainly basaltic, are much more abundant than the Mesozoic ones. They include the Oligocene Afar volcanic province in southwestern Arabia–eastern Africa and a plethora of Miocene–Recent smaller-volume volcanic fields (harrats) in Saudi Arabia, Israel, Jordan and Syria (Fig. 1). The Miocene Aleppo Plateau volcanic fields in western Syria (the present study and Ma et al. in press) pre-date the nearby Syrian segment of the Dead Sea Fault System and its associated Al Ghab–Homs volcanic field (~ 6–1 Ma) (Ma et al. Reference Ma, Malpas, Xenophontos and Chan2011a ), as well as the nearby Mt Karacadağ shield volcano in southeastern Turkey (~ 11 Ma to Recent) (Lustrino et al. Reference Lustrino, Keskin, Mattioli, Lebedev, Chugaev, Sharkov and Kavak2010).
Geographic locations of Cenozoic volcanism in (a) Arabia and northeastern Africa (modified after Davidson et al. Reference Davidson, Al-Kadasi, Al-Khirbash, Al-Subbary, Baker, Blakey, Bosence, Dart, Heaton, McClay, Menzies, Nichols, Owen and Yelland1994), and (b) northwestern Syria (Ma et al. in press and references therein). Dashed box in (a) marks the area shown in (b). Sampling locations are shown by star symbols in (b). Numbers adjacent to the stars are 40Ar–39Ar dates in Ma determined by Ma et al. (in press), and black hexagonal symbols published K–Ar (Mouty et al. Reference Mouty, Delaloye, Fontignie, Piskin and Wagner1992; Sharkov et al. Reference Sharkov, Chernyshev, Devyatkin, Dodonov, Ivanenko, Karpenko, Leonov, Novikov, Hanna and Khatib1994; Trifonov et al. Reference Trifonov, Dodonov, Sharkov, Golovin, Chernyshev, Lebedev, Ivanova, Bachmanov, Rukieh, Ammar, Minini, Kafri and Ali2011) and 40Ar–39Ar (Krienitz et al. Reference Krienitz, Haase, Mezger, van den Bogaard, Thiemann and Shaikh-Mashail2009) dates in Ma. DSFS – Dead Sea Fault System; HAS – Harrat Ash Shamah; KV – Karacadağ volcano; MB – Mesopotamian Basin.

The Aleppo Plateau basalts were erupted at ~ 19–11 Ma, according to recent 40Ar–39Ar dating by Krienitz et al. (Reference Krienitz, Haase, Mezger, van den Bogaard, Thiemann and Shaikh-Mashail2009) and Ma et al. (in press). The oldest activity (Phase 1: ~ 19–18 Ma) appears to have been centred on Jabal El-Hass to the south of Aleppo, and younger activity (Phase 2: ~ 13–11 Ma) appears to have migrated to the north around the Aafrin basin and to the south on the Abou Ad-Dohour and Salamiyeh Plateau. The basalts are invariably olivine-phyric with more evolved basalts also being clinopyroxene- and plagioclase-phyric. Despite their similar petrography, the Phase 1 basalts in general are SiO2 richer and mainly tholeiitic basalts and basaltic andesites whereas the Phase 2 basalts are SiO2 poorer and mainly alkali basalts and tholeiitic basalts (Ma et al. in press). The mantle sources, especially that of the lower-silica Phase 2 basalts, are considered to contain a mafic component, most plausibly amphibole-rich metasomatic veins (Ma et al. in press).
The basalts of this study belong to a subset of those samples investigated by Ma et al. (in press). In addition to the Phase 1 and Phase 2 grouping, the latter has further been divided into two subgroups on the basis of Si-saturation, namely the nepheline-normative subgroup and hypersthene-normative subgroup. For the sake of simplicity, this subdivision is not used in this study, following the observations that these two subgroups do not show any significant differences in their PGEs, in terms of abundances, ratios and variations with other chalcophile and lithophile elements. However, there are noticeable differences in PGEs between the Phase 1 and Phase 2 basalts, as will be shown and discussed below.
3. Analytical methods
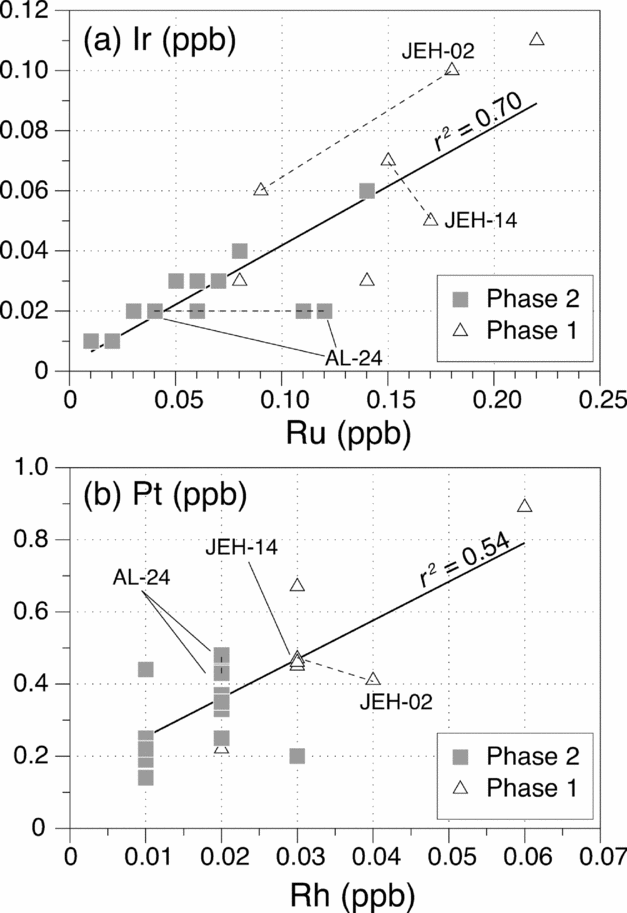
The freshest samples were pulverized to < 10 μm in a tungsten carbide mill, which is thought to introduce negligible PGE contamination except Au and potentially traces of Rh and Ir (Evans et al. Reference Evans, Davis, Byrne and French2003). Contamination of these elements from tungsten carbide was estimated to be up to 0.18 ppb Au, 0.03 ppb Rh and 0.01 ppb Ir in the experiments of Evans et al. (Reference Evans, Davis, Byrne and French2003). As a result, Au is not reported in this study. The estimated ‘introduced’ Rh and Ir levels are of the same order of magnitude as some of the low-PGE Syrian Aleppo Plateau basalts; however, the generally good correlations of Rh (r 2 = 0.54) and Ir (r 2 = 0.70) with Pt and Ru, respectively, which are considered to be uncontaminated, as well as the absence of noticeable positive Rh and Ir anomalies in primitive mantle normalized PGE diagrams suggest minimal PGE contamination during sample processing. Contamination of W from the tungsten carbide mill may be significant, and potentially interferes with 198Pt through excess 182W16O. This, nevertheless, was overcome by using a 194Pt spike during sample digestion.
Concentrations of Ir, Ru, Rh, Pt and Pd were obtained by isotope dilution inductively coupled plasma mass spectrometry (ID-ICP-MS) after digestion of samples using an improved Carius tube technique (Qi & Zhou, Reference Qi and Zhou2008). The instrument was an ELAN DRC-e ICP-MS in the State Key Laboratory of Ore Deposit Geochemistry, Institute of Geochemistry, Chinese Academy of Sciences, Guiyang, and the operating parameters were similar to those outlined in Qi & Zhou (Reference Qi and Zhou2008). For each rock sample, 8 g of rock powder were spiked with 193Ir, 101Ru, 194Pt and 105Pd and were placed in a 120 ml Carius tube, which was cooled in an ice bath. After addition of 30 ml aqua regia, the Carius tube was sealed and put in a custom-made stainless steel high-pressure autoclave, which was filled with water to prevent explosion. The autoclave was further sealed and heated to 300°C for 12 hours. After cooling, the content in the Carius tube was centrifuged and evaporated to dryness. The residual HNO3 was removed by drying twice with 6 ml of concentrated HCl. Following this, the residue was dissolved with an additional 50 ml of 3 mol l−1 HCl and centrifuged to obtain the ‘upper solution’, which was taken for pre-concentration of PGEs by Te co-precipitation. For the latter technique, aqua regia was used to dissolve the Te-precipitate. The resulting solution was then transferred to a mixed ion-exchange system that contained a Dowex 50 WX 8 cation exchange resin and a P507 extraction chromatograph resin in order to remove elements such as Cu, Ni, Zr and Hf, which might interfere with the PGEs during subsequent measurements (Qi, Zhou & Wang, Reference Qi, Zhou and Wang2004). The eluted solution was collected and evaporated to approximately 3 ml for measurement by ICP-MS. The concentrations of Ir, Ru, Pt and Pd were measured by isotope dilution, and that of Rh was determined by calibration with the internal standard 194Pt. All data were blank-corrected (0.025 ppb Ir, 0.017 ppb Ru, 0.026 ppb Rh, 0.18 ppb Pt and 0.37 ppb Pd).
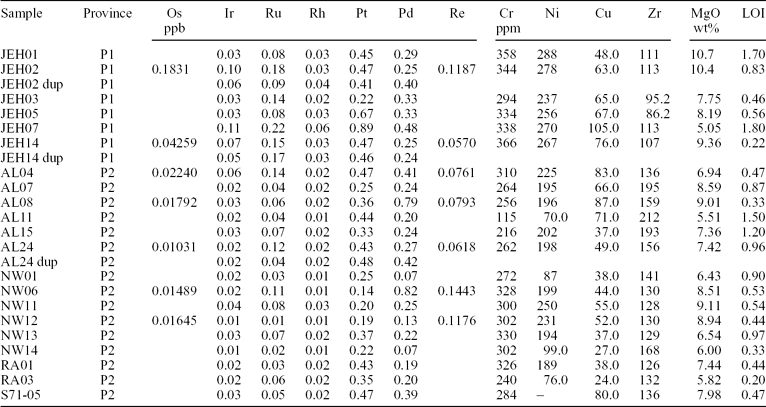
The blank, detection limits and analytical results of standard materials WGB-1, TDB-1 and WPR-1 are provided in Table 1 along with their published and certified values. Our measured Ir, Ru and Rh for WGB-1 and TDB-1 are lower than the certified values (Govindaraju, Reference Govindaraju1994), but in a good agreement with more recently published values of Meisel & Moser (Reference Meisel and Moser2004). Results for WPR-1 agree very well with the certified values. The precision of the technique as monitored by these reference materials is mostly better than 10% for most PGEs and 13% for Ir. However, duplicate analysis of our own samples (Table 2), which have considerably lower PGE contents, reveal much poorer precision, ranging from ± 2 to ± 48% (RSD) for Ir, Rh, Pt and Pd, and up to ± 108% for Ru. The larger discrepancy between the duplicate runs may reflect small-scale heterogeneity in the distribution of the PGEs within aliquots of ultra-low PGE sample powder, commonly known as the ‘nugget effect’. Nevertheless, the primitive mantle normalized PGE patterns are similar between duplicate analyses, indicating that the nugget effect exerted only a minimal influence on the conclusions reached, which are based on elemental and ratio variations in orders of magnitude. In addition, there are reasonable correlations between similarly behaved PGEs, such as Ir versus Ru and Pt versus Rh (Fig. 2), suggesting that there is at least some internal consistency among our PGE analyses. One exception is that the duplicate analysis of AL-24 shows a prominent Ru spike on the primitive mantle normalized spider diagram while the other AL-24 does not, and this discrepancy gives rise to the 108% poor precision of Ru. Although this may also be a result of the sample inhomogeneity, the Ru data are used with caution in this study. In the following, for the samples with two analyses the averaged values are used, unless otherwise stated.
Blank, detection limits and analytical results (ppb) of reference materials WGB-1, TDB-1 and WPR-1

*Govindaraju (Reference Govindaraju1994); †Meisel & Moser (Reference Meisel and Moser2004).
PGE, Re, MgO, LOI and selected trace-element analyses of the Aleppo Plateau basalts, NW Syria

Os, Re, Ni, Cr, Cu, MgO and LOI data are from Ma et al. (in press). LOI – loss on ignition; P1 – Phase 1 volcanism; P2 – Phase 2 volcanism; dup – duplicate analysis.
(a) Ir v. Ru and (b) Pt v. Rh for the Miocene Aleppo Plateau basalts, NW Syria. Bold solid lines show the least-squares linear correlations for all of the samples. The reasonable correlations demonstrate internal consistency among the PGE analyses to some degree. Note that duplicate analyses (connected by dashed lines) are also shown in this case. r 2 – coefficient of determination.

4. Results
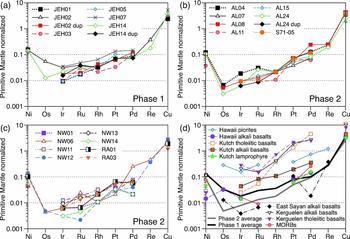
Ni (58–264 ppm), Cr (115–366 ppm) and MgO (5.3–11 wt%) of the Aleppo Plateau basalts are positively correlated (Ma et al. in press). Their relationships, using Cr as a representative, with the PGEs are shown in Figure 3. Additional data for Re and Os in seven samples from Ma et al. (in press) are also plotted. Exhibiting very low abundances, Ir (0.01–0.11 ppb), Ru (0.01–0.22 ppb) and Rh (0.01–0.06 ppb) roughly decrease with decreasing Cr for the entire sample suite but show no pronounced correlation with Cr within individual groups. No salient trends are observed for Pt, Pd, Os and Re with Cr. The scatter of Os and Re may be biased by the small dataset for these elements. Abundances of Pt (0.14–0.89) and Pd (0.07–0.82 ppb) are higher than Ir, Ru and Rh for a given sample, resulting in fractionated Pt/Ir and Pd/Ir of 5.4–25.9 and 3.9–39.1, respectively. Within individual groups, these ratios and Pd/Pt vary from 5.4 to 19.7, 3.9 to 12.3 and 0.5 to 1.5, respectively for the Phase 1 basalts, and 5.4 to 25.9, 4.1 to 39.1 and 0.3 to 5.7, respectively for the Phase 2 basalts. Abundances of all the PGEs are substantially lower than those of the estimated primitive upper mantle (e.g. Palme & O'Neill, Reference Palme, O'Neill and Carlson2003) by approximately two orders of magnitude for the iridium-subgroup PGEs (IPGE: Os, Ir and Ru) and one order for the platinum-subgroup PGEs (PPGE: Rh, Pt and Pd). These relationships are clearer on primitive mantle normalized spider diagrams for chalcophile elements. The PGE-poor characteristics of the Aleppo Plateau basalts translate as prominent enrichment in Ni, Cu and to a lesser extent Re, giving overall ‘tick-shaped’ patterns that bottom out at Os or Ir (Fig. 4). The patterns for the averages of Phase 1 and Phase 2 samples resemble each other at comparable Pd and Re, but the former average shows less-fractionated IPGEs relative to PPGEs. Overall, these patterns and abundances are more akin to alkali basalts from Hawaii and the Late Cenozoic East Sayan volcanic field (Siberia; except Pd, which is anomalously lower in the Siberian alkali basalts), a lamprophyre from the Kutch rift basin (NW India), MORBs and, to a lesser extent, alkali basalts from the Kutch rift basin than to picrites from Hawaii, tholeiitic basalts from the Kutch rift basin, and alkali and tholeiitic basalts from Kerguelen (Fig. 4d; Crocket, Reference Crocket2002; Bézos et al. Reference Bézos, Lorand, Humler and Gros2005; Chazey & Neal, Reference Chazey and Neal2005; Crocket & Paul, Reference Crocket and Paul2008; Ivanov et al. Reference Ivanov, Palesskii, Demonterova, Nikolaeva, Ashchepkov and Rasskazov2008; Ireland, Walker & Garcia, Reference Ireland, Walker and Garcia2009).
Ni, PGEs and Re v. Cr for the Miocene Aleppo Plateau basalts, NW Syria. Also shown are the vectors for fractionation of olivine and spinel in a ratio of 92 to 8, calculated using partition coefficients list in Table 3. Each increment denotes 2% fractionation.

Chalcophile-element spider diagrams normalized to primitive mantle (values of Palme & O'Neill, Reference Palme, O'Neill and Carlson2003) for the (a) Phase 1 and (b, c) Phase 2 basalts, and (d) averages of the two phases compared with those of alkali basalts (Crocket, Reference Crocket2002) and picrites (Ireland, Walker & Garcia, Reference Ireland, Walker and Garcia2009; picrites potentially altered are not averaged) from Hawaii, alkali basalts from the East Sayan volcanic field, Siberia (Ivanov et al. Reference Ivanov, Palesskii, Demonterova, Nikolaeva, Ashchepkov and Rasskazov2008), alkali basalts, tholeiitic basalts and a lamprophyre from the Kutch rift basin, NW India (Crocket & Paul, Reference Crocket and Paul2008), alkali and tholeiitic basalts from Kerguelen (Chazey & Neal, Reference Chazey and Neal2005), and MORBs (Bézos et al. Reference Bézos, Lorand, Humler and Gros2005).

5. Discussion
5.a. Fractionation of chalcophile elements by sulphides
Positive correlations between Ni and Cr (and MgO) in the Aleppo Plateau basalts are consistent with fractionation of olivine and spinel. Although spinels are thought to be compatible with IPGEs (e.g. Pagé et al. Reference Pagé, Barnes, Bédard and Zientek2012) and perhaps also PPGEs (Puchtel & Humayun, Reference Puchtel and Humayun2001), the wide ranges of PGEs in conjunction with their poor or absent correlation with Cr, Ni and MgO within the Syrian suite are at variance with the fractionation model. A vector of olivine + spinel fractionation is shown in Figure 3, computed using partition coefficients listed in Table 3. It readily reproduces the Ni–Cr trend but not the PGE–Cr trends, suggesting a more important influence on PGEs by other factors.
Partition coefficients used in the crystal fractionation and partial melting modelling

Sources: *Puchtel & Humayun (Reference Puchtel and Humayun2001); †Chazey & Neal (Reference Chazey and Neal2005); ‡Righter et al. (Reference Righter, Campbell, Humayun and Hervig2004); §assumed; ∥Ballhaus et al. (Reference Ballhaus, Bockrath, Wohlgemuth-Ueberwasser, Laurenz and Berndt2006); ¶Barnes & Maier (Reference Barnes, Maier, Keays, Lesher, Lightfoot and Farrow1999).
In both natural and experimental systems, PGEs have been shown to partition strongly into sulphide phases, and fractionation of sulphides from silicate magmas will deplete the magmas in PGEs relative to Ni and Cu, greatly increasing Ni/Ir and Cu/Pd (Barnes & Maier, Reference Barnes, Maier, Keays, Lesher, Lightfoot and Farrow1999 and references therein). The high primitive mantle normalized (Ni/Ir)N (4–23) and (Cu/Pd)N (9–84) in the Aleppo Plateau basalts may therefore suggest that the magmas were S-saturated. Further constraints may be gleaned from high-field-strength element/PPGE ratios (e.g. Y/Pd). In a basaltic system, S-undersaturated melts are canonically assumed to have primitive mantle normalized (Y/Pd)N close to 1, owing to the similar partition coefficients for Y and Pd in silicates (Brügmann et al. Reference Brügmann, Naldrett, Asif, Lightfoot, Gorbachev and Fedorenko1993). However, because of the high partition coefficients for PGEs in sulphides, separation of any sulphide phase from a basaltic magma will result in superchondritic Y/Pd in the remaining silicate melts (Brügmann et al. Reference Brügmann, Naldrett, Asif, Lightfoot, Gorbachev and Fedorenko1993). In this sense, Y/Pd is a good indicator of sulphide saturation in silicate magmas. The Aleppo Plateau basalts possess (Y/Pd)N = 16–212, strongly suggestive of sulphide fractionation, which occurred either in the mantle where sulphides are retained or during the evolution of the magmas (Fig. 5a). In agreement with the sulphide fractionation, the basalts have low Cu/Zr (< 1) and PGE abundances (Fig. 5a, b). The low Cu/Zr ratios are considered a result of removal of Cu, but not Zr, via sulphide segregation in the crust (Lightfoot et al. Reference Lightfoot, Hawkesworth, Hergt, Naldrett, Gorbachev, Fedorenko, Doherty, Lightfoot and Naldrett1994; Kerr, Reference Kerr2003) or retention in the mantle. It is interesting to note that very extensive chalcophile metal depletion, such as that in the case of the Nadezhdinsky Formation in Noril'sk, Permo-Triassic Siberian LIP, can be caused by as little as 0.1% sulphide segregation (Brügmann et al. Reference Brügmann, Naldrett, Asif, Lightfoot, Gorbachev and Fedorenko1993), although diverse opinions exist (e.g. Ivanov, Reference Ivanov, Foulger and Jurdy2007). A rough estimation of the amount of sulphide segregation/retention in the Aleppo Plateau rocks can be made by measuring how much primitive mantle normalized ratios, for instance (Cu/Pd)N, deviate from unity, assuming a source mantle with primitive mantle ratios. A plot of (Cu/Pd)N versus PdN (Fig. 5c) suggests that fractionation of no more than ~ 160 ppm sulphide is sufficient to account for the Cu/Pd variations of the samples, if DPd sulphide liq./silicate liq. = 30000 and DCu sulphide liq./silicate liq. = 1400. Of note, from the arguments made in this section, it is as yet uncertain whether the PGE-depleted nature of the Aleppo Plateau basalts reflects scavenging by segregating immiscible sulphide liquid at crustal levels or retention of sulphides in the mantle during partial melting and melt extraction, or even other processes. It then becomes interesting to explore the role of partial melting in controlling the PGE budgets of the basalts.
(a) (Cu/Zr)N v. (Y/Pd)N, (b) (Cu/Zr)N v. Cu and (c) (Cu/Pd)N v. PdN. Primitive mantle normalized values are from Palme & O'Neill (Reference Palme, O'Neill and Carlson2003). The vector and estimated amounts of sulphide fractionation are calculated using DPd sulphide liq./silicate liq. = 30000 and DCu sulphide liq./silicate liq. = 1400. Pd of the hypothetical initial magma is estimated from regression (power law) of the data trend and from assuming that this magma has (Cu/Pd)N = 1.

5.b. Partial melting
It is commonly considered that when silicate partial melts are extracted from a sulphide-bearing mantle, sulphide phases, occurring as Fe–Ni–Cu sulphide liquid in the residual mantle, sequester PGEs until the extent of partial melting exceeds ~ 20–25% when all the mantle sulphides are consumed and dissolved in the silicate melts (e.g. Hamlyn et al. Reference Hamlyn, Keays, Cameron, Crawford and Waldron1985; Keays, Reference Keays1995; Rehkämper et al. Reference Rehkämper, Halliday, Fitton, Lee, Wieneke and Arndt1999). Low-fraction melts, such as most alkaline basaltic magmas and perhaps also MORBs, therefore tend to be S-saturated, resulting in incomplete dissolution of sulphides in the mantle source, giving rise to low-PGE magmas. In this scenario, the PGE budget of a basaltic magma is controlled by sulphide–silicate partitioning during melting.
A contrasting view, as argued by Bockrath, Ballhaus & Holzheid (Reference Bockrath, Ballhaus and Holzheid2004) and Ballhaus et al. (Reference Ballhaus, Bockrath, Wohlgemuth-Ueberwasser, Laurenz and Berndt2006), is that during mantle melting, IPGE-rich monosulphide solid solutions (mss) coexist with PPGE- and Cu-rich sulphide liquid. The mss tend to stay in the residual mantle, whereas the sulphide liquid occurs as suspended droplets to be drained from the silicate melts during silicate melt extraction if the silicate melts are at the point of sulphide saturation. In this model, the PGE budget of a silicate melt is controlled mainly by metal partitioning between mss and sulphide liquid.
A vigorous evaluation of the two models is beyond the scope of this study, but both models suggest an important role for mantle melting in controlling the PGE budgets in basaltic magmas, and thus the Aleppo Plateau basalts. The Aleppo Plateau basalts are characterized by low IPGE/PPGE and low absolute abundances of PGEs. Some insights into the origin of such characteristics may be gained from partial melting modelling.
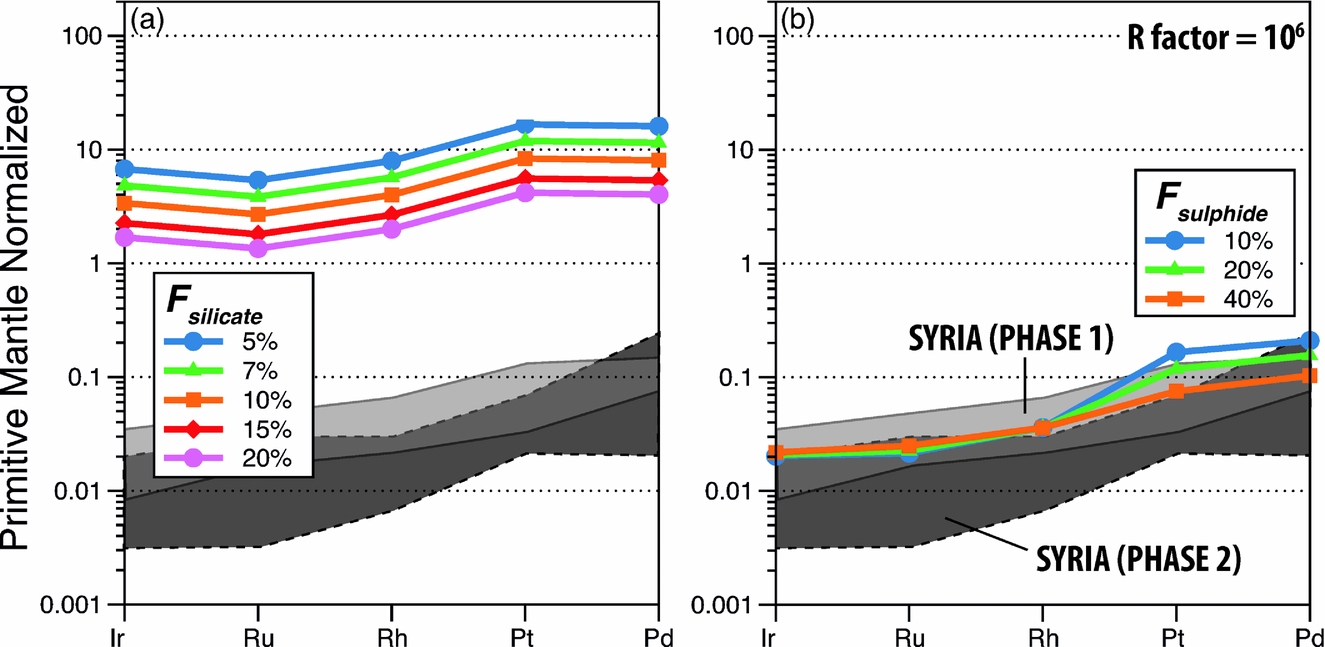
In Figure 6, we show the compositional ranges of the Phase 1 and Phase 2 lavas along with the results of models incorporating the effects of sulphide draining and sulphide/silicate melt equilibrium. Calculations were performed assuming a batch melting process for a given primitive mantle composition, with reasonable choices for partition coefficients (Table 3) and degree of partial melting as input. Details of the modelling are provided in the online Supplementary Material at http://journals.cambridge.org/geo and only the important results are summarized and discussed here.
Distribution of PGEs as a function of partial melting. (a) Calculated compositions of basaltic melts as a function of degrees of silicate partial melting after complete incorporation of sulphide droplets derived from 40% of sulphide partial melting. (b) Calculated compositions of silicate melts in partial equilibrium, determined by the silicate/sulphide mass ratio (R factor; Campbell & Naldrett, Reference Campbell and Naldrett1979), with sulphide droplets derived from varying degrees of sulphide partial melting. See text and online Supplementary Material at http://journals.cambridge.org/geo for explanations. Also shown as shaded areas are the PGE ranges of Phase 1 (light grey) and Phase 2 (dark grey) basalts. All melting was assumed to be batch, and partition coefficients among silicate melt, mss and sulphide melt were those listed in Table 3. The starting sulphide composition in (a) was calculated assuming that the mantle contains PGEs in primitive mantle abundances (Palme & O'Neill, Reference Palme, O'Neill and Carlson2003) and 280 ppm sulphides which host all the PGEs. Fsulphide – degree of sulphide melting; Fsilicate – degree of silicate melting.
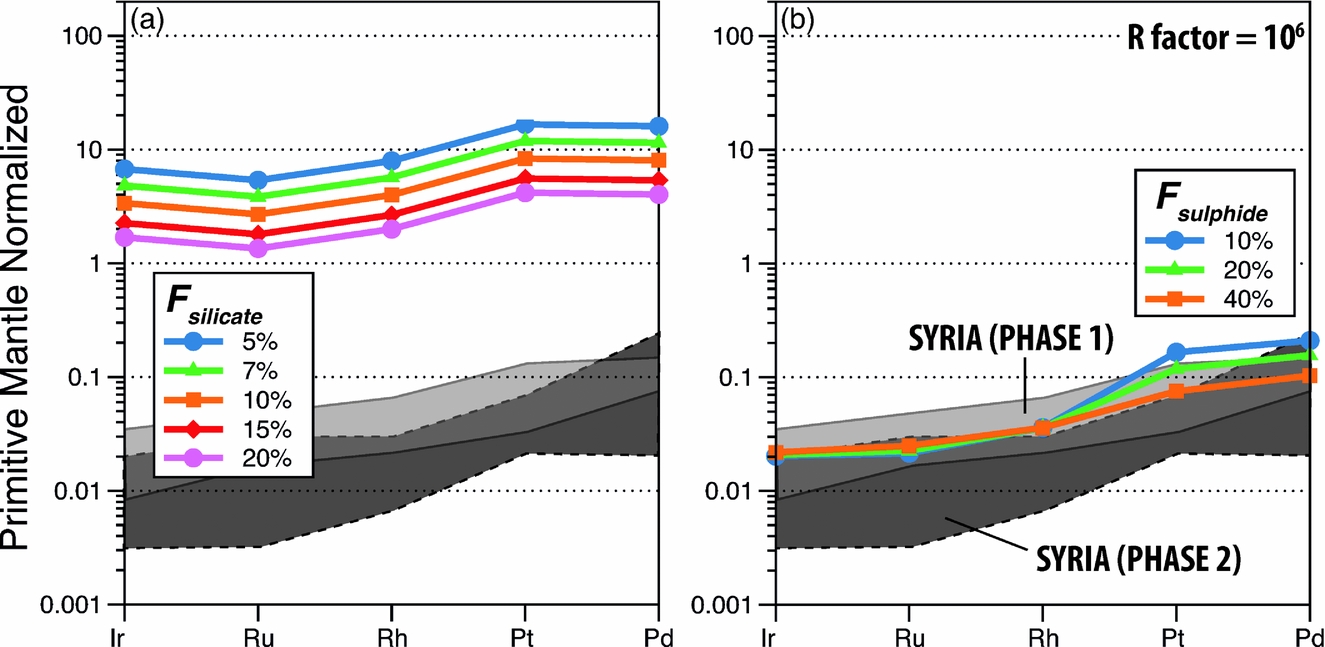
Our calculations suggest that the sulphide-draining model predicts too high absolute abundances of PGEs in the model basalts compared to those of the Aleppo Plateau basalts (Fig. 6a and Fig. S1b, c in the online Supplementary Material at http://journals.cambridge.org/geo) whereas the sulphide-retention model yields more satisfactory fits to the Aleppo Plateau basalts (Fig. 6b and Fig. S1e, f in the online Supplementary Material at http://journals.cambridge.org/geo). For instance, the PGE fractionation patterns and absolute abundances of some higher-PGE Aleppo Plateau basalts (those of the Phase 1 lavas) can be reproduced by a model in which melting produces 40% sulphide melt and 60% mss, and the silicate/sulphide-liquid mass ratio (R factor of Campbell & Naldrett, Reference Campbell and Naldrett1979) is high, ~ 106 (Fig. 6b). An important note, however, is that the sulphide-retention model, regardless of the R factors used, cannot reproduce the very low PGE abundances of some of the Aleppo Plateau basalts (those of the Phase 2 lavas), and warrant one or a combination of the following explanations:
(1) Post-genesis sulphide segregation at shallower depths. In many flood basalt provinces, sulphide segregation is thought to be triggered by crustal contamination that drives the magmas to sulphide saturation (Brügmann et al. Reference Brügmann, Naldrett, Asif, Lightfoot, Gorbachev and Fedorenko1993; Lightfoot & Keays, Reference Lightfoot and Keays2005; Wang, Zhou & Qi, Reference Wang, Zhou and Qi2007; Qi, Wang & Zhou, Reference Qi, Wang and Zhou2008; Song et al. Reference Song, Keays, Xiao, Qi and Ihlenfeld2009). In Syria, however, there is no evidence that the more PGE-depleted Phase 2 lavas are more crustally contaminated and likewise, the more crustally contaminated lavas (Hy-normative group of Ma et al. in press) do not seem to have lower PGEs compared to the more primitive ones (Ne-normative group of Ma et al. in press) within the Phase 2 suite.
(2) Variable oxidation conditions during partial melting. For instance, Mungall et al. (Reference Mungall, Hanley, Arndt and Debecdelievre2006) demonstrated that partial melting under oxidizing conditions may generate higher PGEs in basalts with relatively unfractionated PGE ratios owing to formation of sulphate (which reduces the amount of sulphide available) and destabilization of residual mss. However, the applicability of this model to the Aleppo Plateau basalts requires knowledge of the oxidation state of the Syrian mantle during partial melting, which is not constrained yet.
(3) More likely, the more PGE-depleted nature of the Phase 2 lavas is a source feature. Ma et al. (in press) argued, on the basis of major and lithophile trace elements, that the source mantle of the Phase 1 lavas is largely peridotitic whereas that of the Phase 2 is a mix of peridotite and mafic materials. If this interpretation is correct, and on the basis of the observation that mafic lithologies generally have much lower PGE contents than fertile peridotite (e.g. Lee, Reference Lee2002), the source mantle of the Phase 2 lavas likely had a lower PGE budget. While Ma et al. (in press) suggested that such mafic materials in the source of the Phase 2 Aleppo Plateau basalts are more likely amphibole-rich metasomatic cumulates that resided in the lithospheric mantle, direct studies of such metasomatic materials for PGEs are lacking. Nevertheless, from a study of the ultramafic Alto Condoto Complex, NW Colombia, Tistl (Reference Tistl1994) showed that amphibole-rich cumulates are considerably depleted in IPGEs, with high PPGE/IPGE ratios, compared to the related dunitic and wehrlitic cumulates. It is therefore very likely that the differences in PGE contents and ratios between the Phase 1 and Phase 2 basalts reflect a fundamental difference in their source regions.
5.c. Suprachondritic Pd/Pt
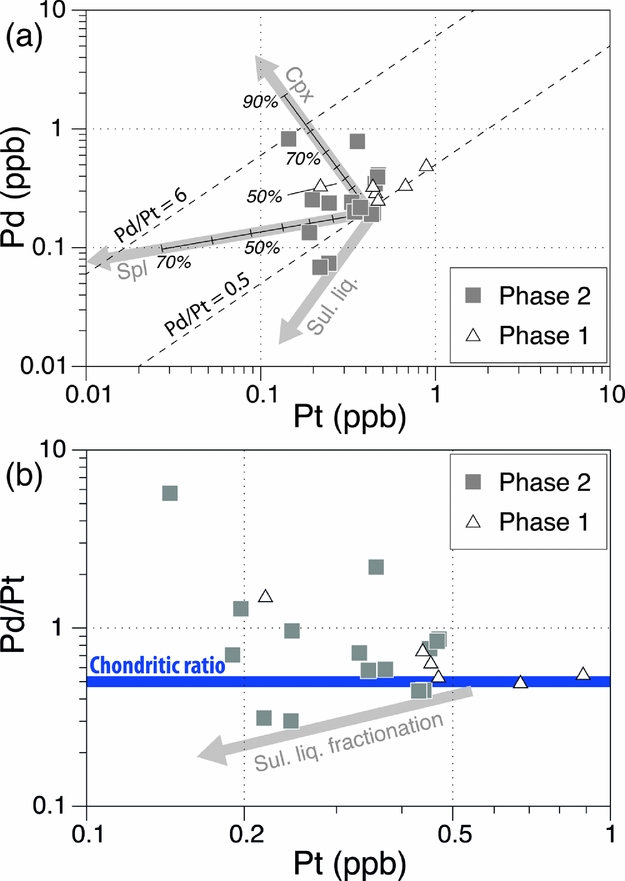
The previous sections have addressed the fractionation of IPGEs from PPGEs, and PGEs from other chalcophile elements in the Aleppo Plateau basalts. We now explore inter-fractionation of PPGEs. The Aleppo Plateau basalts show a substantial range of Pd/Pt (0.5–5.7; Fig. 7), many higher than the primitive mantle value of ~ 0.6. This wide range does not seem to be an artefact of analytical error or the nugget effect, judging from the three duplicate analyses that suggest nugget effects affect concentrations and ratios generally no more than two fold, whilst there is an order of magnitude variation in Pd/Pt for the basalts. There is also no convincing evidence of low-temperature alteration to affect Pd/Pt in the basalts, although on the basis of thermodynamic calculations, Wood (Reference Wood1987) suggested that Pd may be mobile in the form of Pd–chloride complexes in aqueous fluids. The Aleppo Plateau basalts show no correlation between Pd/Pt and loss on ignition (LOI), and the two samples (NW-06 and AL-08) with the highest Pd/Pt are characterized by relatively low LOI (< 1 wt%; Table 2). Their freshness is also confirmed by petrographic examination.
(a) Pd v. Pt and (b) Pd/Pt v. Pt for the Miocene Aleppo Plateau basalts, NW Syria. Rayleigh fractionation vectors of clinopyroxene and spinel (partition coefficients of Table 3) are shown, in (a) indicating unrealistic amounts of clinopyroxene fractionation are required to explain the entire range of Pd/Pt. Each mark along the vectors denotes 10% fractionation. Also shown in (a, b) are the approximate vectors for sulphide fractionation and in (b) the chondritic ratio of ~ 0.5 by a bold horizontal line.
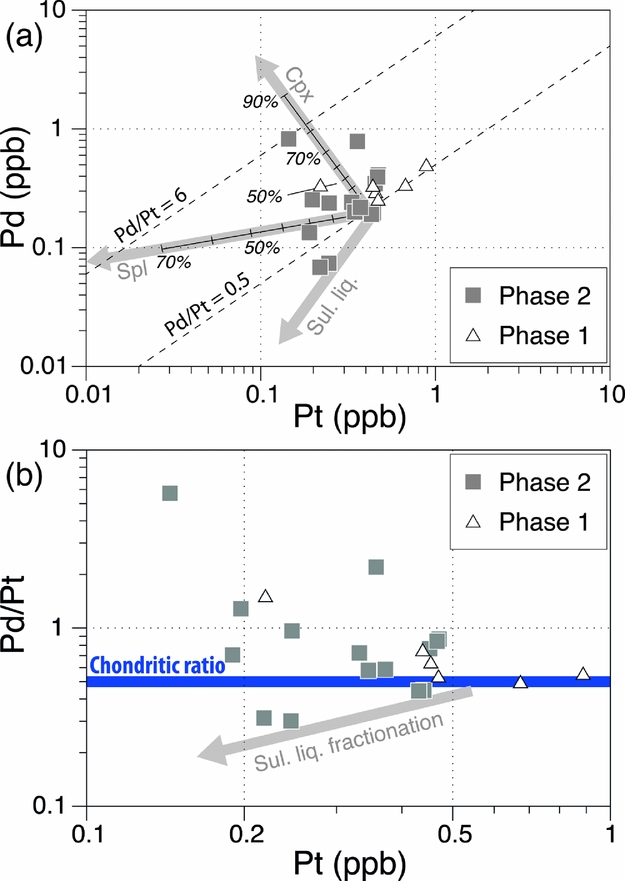
High Pd/Pt is not consistent with sulphide segregation or partial melting to leave a mss-bearing restite, which should have lowered Pd/Pt in the resulting silicate magma, because Pd has a greater Dsulphide liq./silicate liq. and Dmss/sulphide liq. than Pt (Fleet, Stone & Crocket, Reference Fleet, Stone and Crocket1991; Peach et al. Reference Peach, Mathez, Keays and Reeves1994; Vogel & Keays, Reference Vogel and Keays1997; Ballhaus et al. Reference Ballhaus, Bockrath, Wohlgemuth-Ueberwasser, Laurenz and Berndt2006). This makes the decoupling between Pd and Pt either a result of mineral/alloy fractionation during magmatic evolution at crustal levels or a source feature.
5.c.1. Mineral and alloy fractionation
Upon leaving the source mantle, S-saturated magmas may at some stage, though not necessarily, become S-undersaturated during their evolution at shallow depths, owing to earlier sulphide segregation or pressure drop that increases the S-capacity (Mavrogenes & O'Neill, Reference Mavrogenes and O'Neill1999). Under S-undersaturated conditions, crystallization of mafic minerals becomes a potential major control of PGE variations. Whether the observed Pd/Pt range in the Aleppo Plateau basalts can be a result of S-undersaturated crystal fractionation can be tested by considering partition coefficients of typical mafic minerals. One potential cause of increased Pd/Pt is to preferentially remove Pt through fractionation of spinel and/or clinopyroxene (D = 1.6–3.3 and 1.5, respectively; Puchtel & Humayun, Reference Puchtel and Humayun2001; Righter et al. Reference Righter, Campbell, Humayun and Hervig2004), regardless of whether the origin of the apparent compatible behaviour of Pt in these minerals is by lattice substitution or co-precipitation of Pt-bearing alloys. We computed Rayleigh fractional crystallization of clinopyroxene and spinel using partition coefficients listed in Table 3 (Fig. 7a). The results suggest that up 80% of clinopyroxene fractionation is required to account for the entire range of Pd/Pt, which, considering also a lack of Pd/Pt–Cr correlation, is difficult to reconcile. Fractionation of Pt-bearing Ru–Ir–Os alloys, Fe–Pt alloys or platinum-group minerals (PGMs), through co-precipitation with olivine and chromite, has been proposed as a viable mechanism for Pd/Pt variability in some basalts from East Greenland (Momme et al. Reference Momme, Tegner, Brooks and Keays2002), the Emeishan LIP (Song et al. Reference Song, Keays, Xiao, Qi and Ihlenfeld2009) and SE China (Yang et al. Reference Yang, Zhao, Qi, Yang and Zhou2011). However, the Aleppo Plateau basalts exhibit no correlation between Pd/Pt and Ir (and also Ru), in contrast to concurrent depletion of Pt and IPGEs as expected for the removal of such alloys and PGMs. We are therefore inclined to rule out this hypothesis, i.e. mineral and alloy fractionation, for the Aleppo Plateau basalts.
5.c.2. High Pd/Pt as a source feature?
It is, however, clear from Figure 7b that high Pd/Pt ratios are associated with low Pt abundances, an element already shown to be reasonably positively correlated with Rh among the Aleppo Plateau basalts. These relationships suggest that there may have been a coupled process of Pt–Rh depletion relative to other PGEs. One possibility is that this feature is inherited from the source. Luguet et al. (Reference Luguet, Alard, Lorand, Pearson, Ryan and O'Reilly2001, Reference Luguet, Lorand, Alard and Cottin2004) reported in situ analyses of sulphides from peridotites which are thought to have been affected by mantle metasomatism, and showed that these sulphides are characterized by Pd enrichment with suprachondritic Pd/Pt. In addition, some such sulphides from the Ligurian ophiolites show troughs of Rh–Pt relative to Ru and Pd on primitive mantle normalized spider diagrams (Luguet et al. Reference Luguet, Lorand, Alard and Cottin2004). Such a feature is the opposite to that of harzburgites (bulk rocks) from the Tabar–Lihir–Tanga–Feni arc and Ural–Alaskan type ultramafic-mafic complexes (compilations of Kepezhinskas & Defant, Reference Kepezhinskas and Defant2001), which show enrichments of Rh–Pt relative to Ru and Pd. If these features can be linked to a single, universal process, one may call upon a process capable of selectively mobilizing Pt and Rh and ‘depositing’ them elsewhere. One such process may be mantle interactions with fluids or silicate melts (Ackerman et al. Reference Ackerman, Walker, Puchtel, Pitcher, Jelínek and Strnad2009). Albeit not analysed for Rh, dunites, interpreted as former reactive melt channels, from the Troodos ophiolite (Büchl et al. Reference Büchl, Brügmann, Batanova, Münker and Hofmann2002) are found to exhibit subchondritic Pd/Pt. Likewise, if the source mantle of the Aleppo Plateau basalts has variably interacted with fluids or silicate melts, forming Pt–Rh depleted sulphides similar to some of those from the Ligurian ophiolites, subsequent partial melting of this metasomatized mantle may produce basalts characterized by suprachondritic Pd/Pt.
6. Conclusions
The Aleppo Plateau basalts have very low contents, but large variations in PGEs, despite their comparable primitive mantle normalized spider patterns. Olivine and spinel fractionation may have contributed to some PGE variations, but the effects were probably minor. The major controls on the PGE systematics in the basalts are considered to be retention of sulphides in the mantle during partial melting and melt extraction. It appears that the absolute PGE budgets of the basalts are in part also controlled by the lithology of the source mantle in which the presence of some mafic components may ‘dilute’ the PGEs in the source. Scavenging of PGEs by segregating sulphide liquid may have also been a possible mechanism for further depletion of PGEs in the magmas, albeit that there is very little evidence for this, and it is not necessary. Many samples show suprachondritic Pd/Pt, up to 5.6, much higher than the primitive mantle and chondrite values of ~ 0.5–0.6. The increase of Pd/Pt is difficult to reconcile with simple fractionation of silicate minerals such as clinopyroxene, which requires unrealistic amounts of fractionation. Nor is the removal of Pt-bearing PGE minerals or alloys, as supported by a lack of Pd/Pt–Ir (–Ru) correlations. Coupled variations between Pt and Rh, however, suggest that the suprachondritic Pd/Pt in the basalts is caused by coupled Pt–Rh depletion, a feature that may be inherited from a metasomatized source mantle.
Acknowledgements
Mei-Fu Zhou is thanked for discussions on PGE chemistry, and Der-Chuen Lee for his constructive criticism. Tadashi Usuki provided a very important reference. Fieldwork was kindly permitted and supported by the General Establishment of Geology and Mineral Resources, Syria and Maurel & Prom Syria. Two anonymous reviewers provided constructive reviews and helped clarify the manuscript. This work was funded by research grants provided by HKU (grant no. 200607176152 and 200807176091 to J. M.).