INTRODUCTION
The morphology, phenology, and epibiosis of marine macrophytes can vary in space and time as a result of various biotic and abiotic factors (Jernakoff et al., Reference Jernakoff, Brearley and Nielsen1996). Biological factors such as herbivory, competition and predation alter species composition and frequency of epiphytic organisms (Boero & Fresi, Reference Boero and Fresi1986; Duffy & Hay, Reference Duffy and Hay2000; Dahms et al., Reference Dahms, Harder and Qian2004). Among physical parameters, light intensity and temperature are of primary importance to explain the distribution and phenology of seaweeds in temperate areas (De Wreede, Reference De Wreede1976; Glenn et al., Reference Glenn, Smith and Doty1990). These factors affect seaweed photosynthetic rate and consequently modify algal growth and survivorship (Moore et al., Reference Moore, Wetzel and Orth1997; Moore & Wetzel, Reference Moore and Wetzel2000). Despite the seasonal variation in light intensity and temperature being less conspicuous in tropical waters than in temperate ones, seaweeds are still assumed, although not formally tested, to exhibit seasonal variations in morphology and phenology (Gillespie & Critchley, Reference Gillespie and Critchley1999; Ateweberhan et al., Reference Ateweberhan, Bruggemann and Breeman2005). Since large seaweeds harbour epibionts, changes in their morphology may influence the population of both fouling organisms and the epifauna. Also, the epibionts on the seaweeds may themselves change in coverage or morphology due to grazing (Stachowicz & Whitlatch, Reference Stachowicz and Whitlatch2005) or their own seasonal variation (Schmidt & Scheibling, Reference Schmidt and Scheibling2006; Széchy & Sá, Reference Széchy and Sá2008).
For some seaweeds, adaptations at the morphological level may be derived as the wave action varies (Graham & Wilcox, Reference Graham and Wilcox2000), which is another important physical factor in structuring macroalgal beds worldwide (Denny & Gaylord, Reference Denny and Gaylord2002). Usually, algal populations from sheltered areas present heavier and larger fronds and occur at lower densities than those from exposed sites (Paula & Oliveira-Filho, Reference Paula and Oliveira-Filho1982; Underwood & Jernakoff, Reference Underwood and Jernakoff1984; see Denny & Gaylord, Reference Denny and Gaylord2002 for some exceptions and adaptations). Morphological features such as the shape and dimensions of the thallus components (blades, bladders and receptacles) and the degree and kind of branching might also be highly dependent on local wave action (Paula, Reference Paula1988; Blanchette, Reference Blanchette1997).
Since turbulence is inversely related to depth (Krapp-Schickel, Reference Krapp-Schickel1993), hydrodynamic differences may occur not only between areas with different wave exposures but also throughout a depth gradient in a given area. This hydrodynamic variation results in a qualitative (richness) and/or a quantitative (abundance) zonation of rocky benthic communities, including macrophytes (Krapp-Schickel, Reference Krapp-Schickel1993; Garrabou et al., Reference Garrabou, Ballesteros and Zabala2002). Although these macrophyte bathymetric patterns have been studied in some locations (Costa Jr et al., Reference Costa, Attrill, Pedrini and De-Paula2002; Díez et al., Reference Díez, Santolaria and Gorostiaga2003), very few reports deal with the relationship between algal phenological traits and depth (Engelen et al., Reference Engelen, Breeman, Olsen, Stam and Aberg2005a, Reference Engelen, Aberg, Olsen, Stam and Breemanb), especially over a narrow depth-range.
Numerous species of epiphytic algae, as well as sessile animals such as hydrozoans, are commonly recorded on seaweeds (Oliveira et al., Reference Oliveira, Marques and Migotto2006; Széchy & Sá, Reference Széchy and Sá2008). Strong correlations among abundance and richness of sessile epiphytic organisms and physical factors, such as wave exposure (Rossi et al., Reference Rossi, Gili and Hughes2000), and features of the host seaweed (shape, texture, biomass, and surface area) had been observed (Heck & Wetstone, Reference Heck and Wetstone1977; Arrontes, Reference Arrontes1990; Széchy & Paula, Reference Széchy and Paula1997). In this way, it may be supposed that temporal and spatial variability in seaweed morphology may directly influence the extent of epibiosis. Conversely, one may hypothesize that such variations might be independent from seaweed morphology, being caused by intrinsic reproductive characteristics of epibiont populations.
Many tropical and temperate shallow water communities are dominated by brown seaweeds such as Sargassum and Fucus (De Wreede, Reference De Wreede1976; Hawkins et al., Reference Hawkins, Hartnoll, Kain, Norton, John and Price1992), and the knowledge about the factors affecting such species may shed light on the ways such communities are regulated (Duffy & Hay, Reference Duffy and Hay2000). On the south-eastern coast of Brazil, brown algae of the genus Sargassum are a very important component of hard bottom benthic communities, with seven species identified along the Rio de Janeiro and São Paulo State coasts (Széchy & Cordeiro-Marino, Reference Széchy and Cordeiro-Marino1991). Extensive beds with dense canopies of Sargassum are present throughout the year in northern areas of the São Paulo coast (Paula & Oliveira-Filho, Reference Paula and Oliveira-Filho1980). Many studies show the seasonality of Sargassum spp. populations, but there is no consensus as to which season or under what conditions growth and senescence occurs (De Wreede, Reference De Wreede1976; McCourt, Reference McCourt1984; Gillespie & Critchley, Reference Gillespie and Critchley1999; Ang, Reference Ang2006). This uncertainty also applies to morpho-phenological characters.
In the present study we evaluated the influence of a narrow depth gradient (1 m, m, and m) and of a small seasonality (period of the year) on the morphological and phenological traits, and on the occurrence of sessile epiphytic organisms in a sublittoral population of the brown alga Sargassum cymosum on a tropical rocky shore.
MATERIALS AND METHODS
Study area
This study was carried out at Lázaro Beach (23°30′S 45°08′W), situated in Fortaleza inlet, Ubatuba, south-eastern Brazil. This is a tropical area with evident seasonality in oceanographic conditions (mostly temperature) but not as strong as in subtropical and temperate habitats. The sampled rocky shore is moderately exposed to wave action (Széchy & Paula, Reference Széchy and Paula2000) and the adjacent soft bottom has a high gravel and organic matter content (Negreiros-Fransozo et al., Reference Negreiros-Fransozo, Franzoso, Pinheiro, Mantelatto and Santos1991). The study area has a rich macrophyte community dominated by the brown alga Sargassum cymosum, which forms a 30 m long homogeneous bed that covers the rocky shore from the sublittoral fringe to a maximum of 4 m depth. Other algae such as Dictyopteris delicatula Lamouroux, D. plagiograma (Montagne) Vickers, Bryothamnion seaforthii (Turner) Kützing, and Gracilaria aff. verrucosa (Hudson) Papenfuss occur at low densities among S. cymosum fronds in this area (G.B. Jacobucci, personal communication).
Sampling procedure
A 20 m sampling sector was set up parallel to the shoreline within which three depth zones were defined from the mean low water (MLW, 0.0 m): upper (0.5–1.5 m), middle (1.5–2.5 m) and lower (2.5–3.5 m), hereafter referred as their average interval value: 1 m, 2 m, and 3 m, respectively. At each depth, 9 samples of S. cymosum (an individual frond including its holdfast) were collected at random in October (spring) 1997 and January (summer), April (autumn), and July (winter) 1998, totalling 27 samples (fronds) per period of the year. During field collections, each S. cymosum frond was carefully enclosed in a 0.2 mm mesh bag and detached from the bottom. All samples were collected through SCUBA diving.
Measuring morphology and epibionts
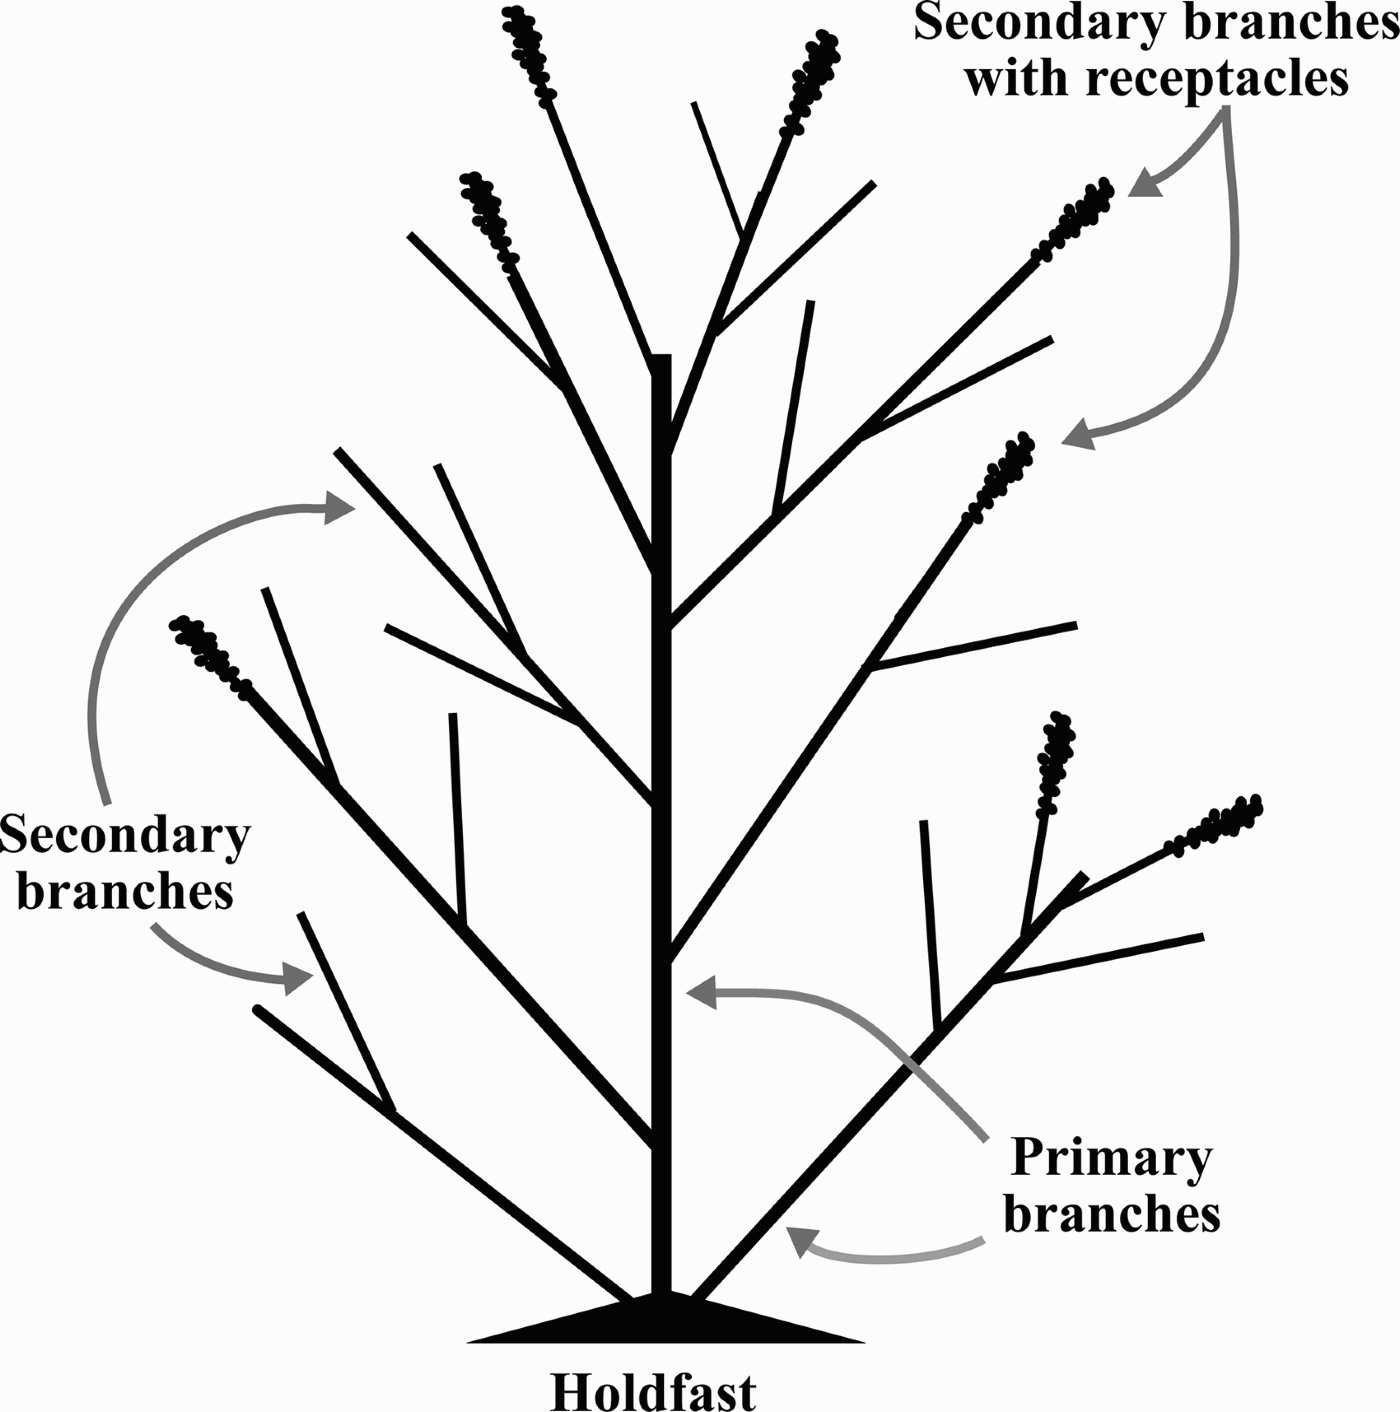
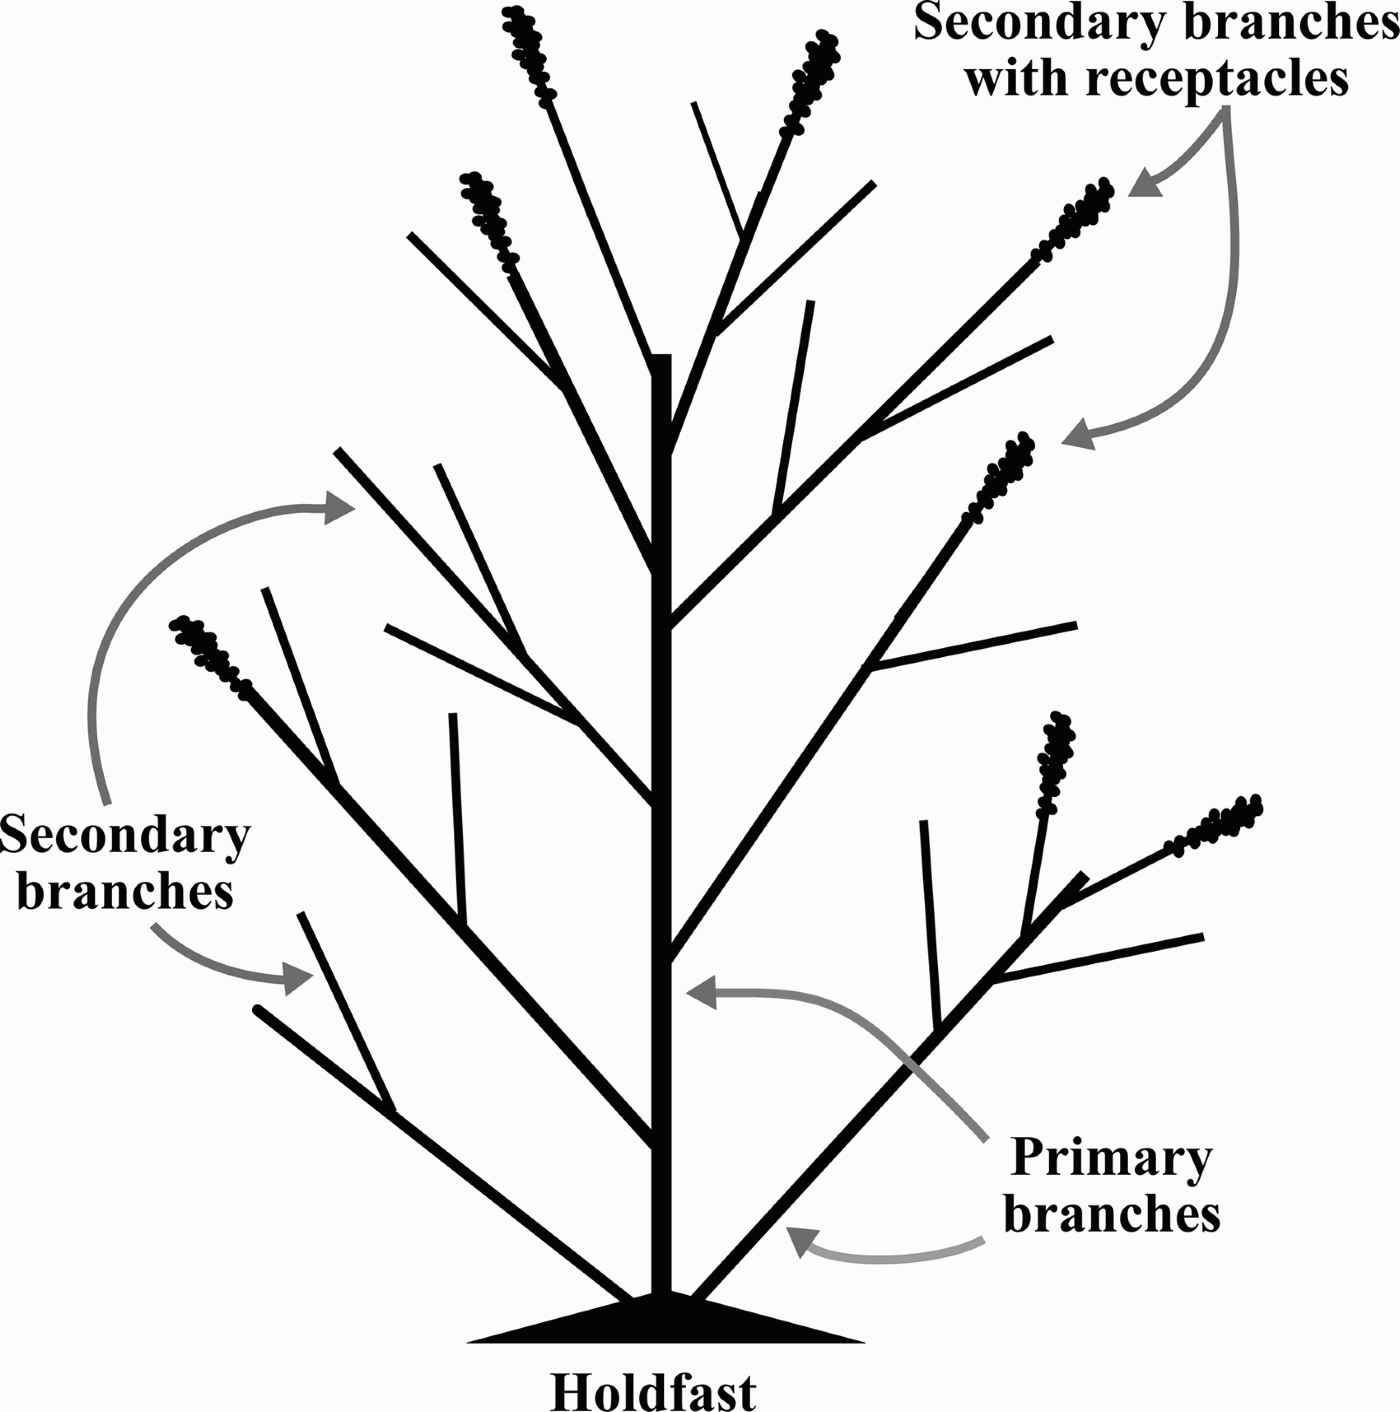
To evaluate the morphology and phenology of S. cymosum, several characteristics were considered as follows. Wet weight of each frond was determined after removal of excess water by spinning for two minutes in a salad spinner. Maximum length (hereafter referred to as length) was obtained by measuring fronds from the holdfast to their farthest tip. For each frond, the number of primary branches (stipes departing directly from the holdfast; Figure 1) and secondary branches (stipes derived from a primary branch; Figure 1) was recorded. The presence of receptacles was the criterion used for fertile state determination. The proportion of primary branches with receptacles was calculated relative to the total number of secondary branches.
Schematic view of a Sargassum cymosum frond showing morphological variables measured in the present study.
Epibiosis rates were obtained by visual evaluation of the secondary branches and classed into the nearest of the following (five) categories of epibiont coverage as follows: value 0 was attributed for the absence of epiphytic organisms; 0.25 for 25% cover; 0.50 for 50% of cover; 0.75 for 75% cover; and 1.00 for 100% cover. The frond epibiosis rate was determined by averaging all secondary branch coverage values. Besides Bryozoa and Porifera, two kinds of hydrozoan colonies were recognized according to their morphology: branched species, usually Dynamena disticha (Bosc, 1802) or Sertularia distans (Lamouroux, 1816) and the highly branched species Aglaophenia latecarinata Allman, 1877. The epiphytes were sorted into two functional–morphological groups according to habit, maximum length and thallus organization: filamentous (e.g. Hypnea musciformis) and foliose algae (e.g. Dictyota cervicornis and Dictyopteris delicatula) (adapted from Steneck & Dethier, Reference Steneck and Dethier1994).
Data analysis
In order to test hypotheses on the effect of depth and period of the year on morphological characteristics of S. cymosum fronds, a model I two-way analysis of variance (ANOVA) (depth—fixed factor, 3 levels; period—fixed factor, 4 levels) was employed for each recorded variable (length, weight, and number of primary and secondary branches). The post-hoc Student–Newman–Keuls (SNK) test was used for pairwise comparisons among different levels within each factor. When the interaction term (depth*period) was non-significant, the data from different depths were pooled and analysed among periods and/or the data from different periods were pooled and analysed among depths. When the interaction term was significant, the SNK test was employed independently for each level of each treatment (factor) tested, i.e. depths were compared within each period and periods were compared within each depth.
This procedure was also employed for the general algal morphology, which was calculated using univariate and multivariate procedures. First, a principal component analysis (PCA) was run on morphological charactistics considering data standardization, square root transformation, and Bray–Curtis similarity index. The first principal component (PC1), which explained about 50% of algal structural variability (see below), was then used as an indirect measure of algal morphology and compared between treatments using a model I two-way ANOVA as presented above. Alternatively, the overall algal shape was compared among depths and periods using a bifactorial analysis of similarities (ANOSIM) (Clarke & Warwick, Reference Clarke and Warwick2001). The similarities between samples were calculated using the Bray–Curtis index with standardized and square root transformed data. The similarities between samples were visualized for each treatment separately with a PCA plot showing the correlation between samples and the morphological variables analysed (Clarke & Warwick, Reference Clarke and Warwick2001).
The variability between and within treatments for a given variable may be explained by the variation in another feature and thus confound the effects of the factors being investigated. In this way, the variation of a characteristic in relation to depth and period of the year should take other variables (covariates) into account to separate the effects of differences among treatments from the differences due to the covariate (Underwood, Reference Underwood1997). Analyses of covariance (ANCOVAs) were performed for the proportion of secondary branches with receptacles and for the epibiosis rate of each taxomonic group with general algal morphology (PC1) as covariate. Finally, the degree of epibiosis (all organisms) was also compared among depths and periods using a bifactorial ANOSIM as explained above.
RESULTS
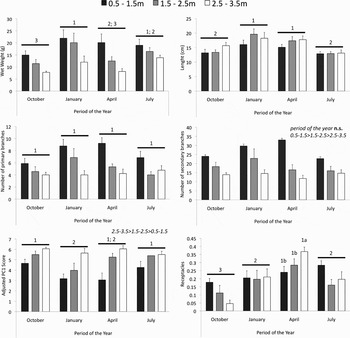
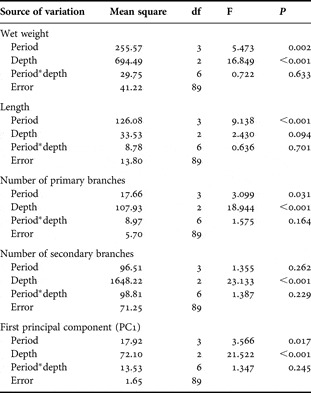
The morphological characters of Sargassum cymosum showed significant but not consistent patterns of variation related to period of the year and depth (Table 1; Figure 2). Wet weight was influenced by both depth and period (no significant interaction) with frond weight being inversely correlated with depth (1 m > 2 m > 3 m). Heavier fronds were recorded in January (summer) and lighter ones in October (spring). April (autumn) and July (winter) presented intermediate values. Period was the only factor that affected frond length (no significant interaction), with larger fronds in January and April and smaller ones in October and July. The number of primary branches also depended on both depth and period (no significant interaction). More ramified fronds were recorded in shallower areas (1 m > 2 m = 3 m). The SNK test failed to demonstrate paired differences among periods, but a tendency towards higher values was recorded in January and April. The number of secondary branches was influenced only by depth (no significant interaction), with smaller values in deeper areas (1 m > 2 m > 3 m).
Mean values (± SD or SE) of wet weight (g), length (cm), number of primary and secondary branches, and general algal morphology, represented by the first principal component of a principal component analysis (PC1) on all morphological characters (see text for details) of fronds of Sargassum cymosum collected at Lázaro Beach, Fortaleza Bay, in different periods of the year and depths (0.5–1.5 m; 1.5–2.5 m; 2.5–3.5 m). Data on frequency of secondary branches with receptacles are also presented. Superscript figures and letters represent the results of the Student–Newman–Keuls (SNK) tests for pairwise comparisons among periods of the year and depths, respectively. The SNK for the frequency of secondary branches is related to analysis of covariance using general algal morphology as covariate. Similar superscript labels represent non-significant differences in the test. In the case of significant interaction between seasons and depths the comparisons were made for each depth separately.

Two-way model I analysis of variance comparing morphological characteristics of Sargassum cymosum among periods of the year and depths (0.5–1.5 m; 1.5–2.5 m; 2.5–3.5 m).

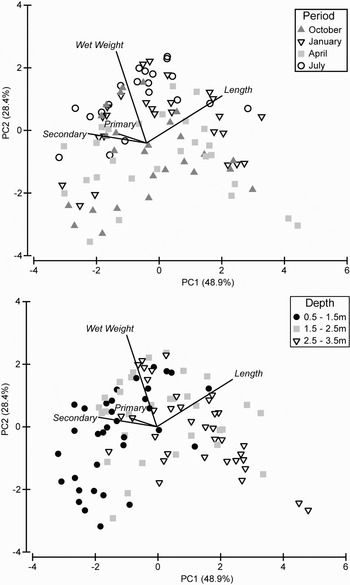
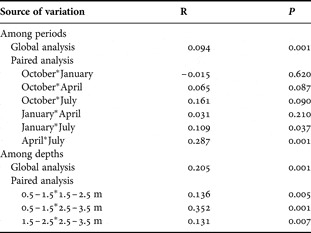
General algal morphology (as summarized by PC1) was compared among treatments (see Table 1; Figure 2). The first (PC1) and second (PC2) principal components explained, respectively, 48.9% and 28.4% (total accumulated = 77.3%) of the variation in the samples. PC1 was defined by frond length (positive correlation) and number of secondary branches (negative correlation), while PC2 was positively correlated to frond wet weight (Figure 3). The results showed a stronger and more evident effect of depth (1 m ≠ 2 m ≠ 3 m) in relation to period of the year (Table 1; Figure 2). The spatial and temporal variation of general morphological characteristics was also tested using ANOSIM that revealed similar results as exposed above, with a significant, but stronger (R = 0.205), effect of depth (1 m > 2 m > 3 m) as well as a significant, but weaker (R = 0.094), effect of period (July ≠ April = January = October; July = October) (see Table 2; Figure 3).
Principal component analysis for the data on morphological characters (wet weight, length, and number of primary and secondary branches) of Sargassum cymosum comparing periods of the year and depths (0.5–1.5 m; 1.5–2.5 m; 2.5–3.5 m). The first (PC1) and second (PC2) principal components explained, respectively, 48.9% and 28.4% (total accumulated = 77.3%) of the variation in the original data. (on standardized and square root transformed data).

Analysis of similarities for the data on morphological characters (wet weight, length, and number of primary and secondary branches) of Sargassum cymosum comparing periods of the year and depths (0.5–1.5 m; 1.5–2.5 m; 2.5–3.5 m).

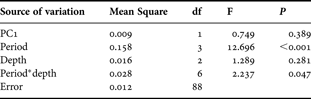
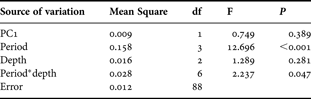
The variation in the proportion of secondary branches with receptacles was addressed using a covariance analysis with algal general morphology as covariate (PC1) and revealed a significant effect of period of the year (October > January = July > April) but not of depth. Reproductive effort was also not affected by algal morphology (PC1). The interaction term between period and depth (period*depth; see Table 3) was significant due to different depth tendencies between October (1 m > 2 m > 3 m) and April (1m = 2 m < 3 m). The post-hoc SNK test was then employed for each depth interval separately (see Figure 2). Significant variation among periods was recorded only in the lower depth zone (3 m) with the number of reproductive structures being significantly higher in April than in other months, which presented similar values to each other.
Analysis of covariance comparing the frequency of secondary branches with receptacles of Sargassum cymosum among periods of the year and depths (0.5–1.5 m; 1.5–2.5 m; 2.5–3.5 m) using general algal morphology, represented by the first principal component (PC1) of a principal component analysis on all morphological characters, as covariate.
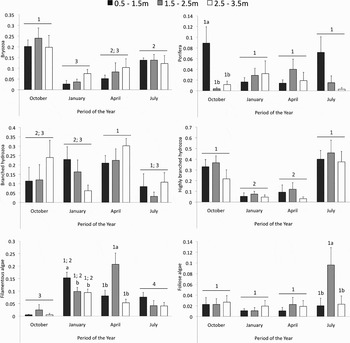
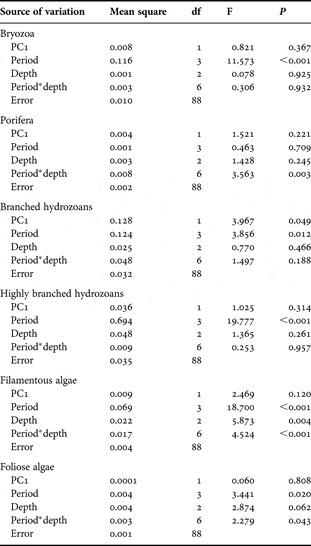
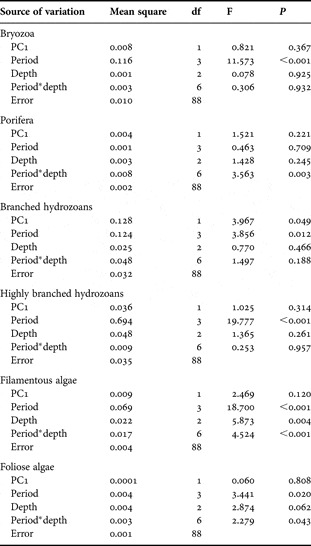
Analysis of covariance using the general algal morphology as covariate was also used to address the effects of periods and depths on epibiosis rate. In general, there was no influence of PC1 on the evaluated epibionts, except for a significant but marginal (P = 0.049) effect on branched hydrozoans (Table 4; Figure 4). Depth had a small effect on epibiosis, being significant only for filamentous and marginally significant (P = 0.061) for foliose algae, but with variable responses during the sampling period (see significant interactions in Table 4). Epibiosis (except porifera) was in general significantly influenced by periods with different biological groups presenting different year-round variability.
Mean values (± SD or SE) of the rate of epibiosis by Bryozoa, Porifera, branched and highly branched hydrozoas, and filamentous and foliose algae in fronds of Sargassum cymosum collected at Lázaro Beach, Fortaleza Bay, in different periods of the year and depths (0.5–1.5 m; 1.5–2.5 m; 2.5–3.5 m). Superscript figures and letters represent the results of the Student–Newman–Keuls tests for pairwise comparisons among periods and depths, respectively, related to analysis of covariance using general algal morphology, represented by the first principal component of a principal component analysis (see text for details) on all morphological characters, as covariate. Similar superscript labels represent non-significant differences in the test. In the case of significant interaction between periods and depths the comparisons were made for each depth separately.

Analysis of covariance comparing the epibiosis rate of Bryozoa, Porifera, branched hydrozoans, highly branched hydrozoans, filamentous algae, and foliose algae on Sargassum cymosum among periods of the year and depths (0.5–1.5 m; 1.5–2.5 m; 2.5–3.5 m) using general algal morphology, represented by the first principal component (PC1) of a principal component analysis on all morphological characters, as covariate.
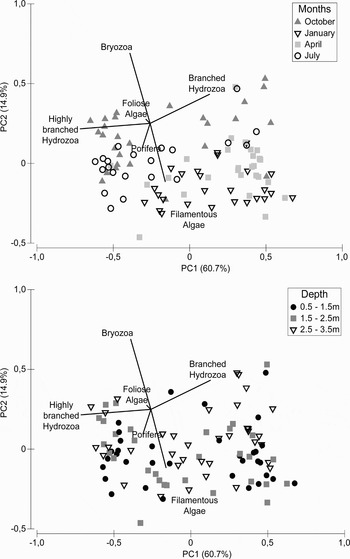
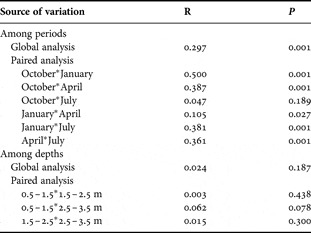
Analysis of similarities was also used to compare the epibiosis considering all groups analysed together and confirmed that periods (R = 0.297; P = 0.001) had a stronger effect on alga epibiosis than depths (non-significant –R = 0.024; P = 0.187). In this way, the combination of the epibiosis rate (all epibionts pooled) did not show any depth variation but was significantly influenced by period of the year (July = October ≠ January ≠ April; Table 5; Figure 5). This overall epibiosis rate was also investigated using a PCA (see Figure 5), which revealed that the first (PC1) and second (PC2) principal components explained, respectively, 60.7% and 14.9% (total accumulated = 75.6%) of the variation among samples. This analysis also revealed that PC1 was associated to the frequency of ocurrence of branched (positive correlation) and highly branched hydrozoans (negative correlation), while PC2 was positively correlated with epibiosis by Bryozoa and negatively correlated with occurrence of filamentous algae.
Principal component analysis for the data on epibiosis rate (Bryozoa, Porifera, branched and highly branched hydrozoans, and filamentous and foliose algae) of Sargassum cymosum comparing periods of the year and depths (0.5–1.5 m; 1.5–2.5 m; 2.5–3.5 m). The first (PC1) and second (PC2) principal components explained, respectively, 60.7% and 14.9% (total accumulated = 75.6%) of the variation in the original data (on standardized and square root transformed data).

Analysis of similarities for the data on epibiosis rate (Bryozoa, Porifera, branched and highly branched hydrozoans, and filamentous and foliose algae) of Sargassum cymosum comparing periods of the year and depths (0.5–1.5 m; 1.5–2.5 m; 2.5–3.5 m).

DISCUSSION
The temporal differences in morphological traits of Sargassum cymosum fronds were expected as previously noted for this species. Wet weight, length and number of main branches significantly varied with period of the year, with higher values in summer and autumn and lower values from winter through spring (Paula & Oliveira-Filho, Reference Paula and Oliveira-Filho1980).
The influence of wave action of shallow waters modulates algal morphology (Krapp-Schickel, Reference Krapp-Schickel1993), with lighter, less ramified and relatively longer Sargassum fronds being found deeper in the rocky shore (De Ruyter van Steveninck & Breeman, Reference De Ruyter van Steveninck and Breeman1987). In the present study the algae in deeper waters were lighter and less ramified but not longer.
Lack of correspondence with water movement (depth-related) suggests that light intensity may instead be the main factor influencing the algal morphology (De Ruyter van Steveninck & Breeman, Reference De Ruyter van Steveninck and Breeman1987) and could be the main cause of S. cymosum biomass changes related to period and depth recorded in this study. The stronger influence of depth over time period on the morphological and phenological characteristics may be due to the constant influence of depth-related differences in light. Although there is a loss of algal biomass due to senescence, the net increase in algal biomass seems to be directly linked to the high light intensities in summer and in shallow waters (Cronin & Hay, Reference Cronin and Hay1996), as also shown for S. cymosum in the present study. In addition, warmer temperatures at the surface and in summer also influence growth (Hanisak & Samuel, Reference Hanisak and Samuel1987; Ateweberhan et al., Reference Ateweberhan, Bruggemann and Breeman2005) and photosynthetic rate (Robledo & Freile-Pelegrín, Reference Robledo and Freile-Pelegrín2005).
Although some studies show an apparent reproductive allocation trade-off for Sargassum (McCourt, Reference McCourt1985; Gillespie & Critchley, Reference Gillespie and Critchley2001; Ang, Reference Ang2006), our data do not support this view. The year-round presence of reproductive receptacles in Sargassum spp. has already been reported for the south-eastern Brazilian coast (Paula & Oliveira-Filho, Reference Paula and Oliveira-Filho1980; Jacobucci, Reference Jacobucci2000; Széchy et al., Reference Széchy, Galliez and Marconi2006; Almada et al., Reference Almada, Yoneshigue-Valentin and Nassar2008). Vegetative growth concomitant with the production of reproductive structures in algae may not be a matter of a trade-off since the reproductive tissues are also capable of photosynthesis (decreasing production and maintenance costs) and also because ontogenetic and morphogenetic responses may overcome energetic constraints (Ateweberhan et al., Reference Ateweberhan, Bruggemann and Breeman2005).
On the other hand, the significantly higher frequency of primary branches with receptacles in the deeper zone recorded in April (autumn) may be evidence of a different reproductive trade-off for these deeper individuals. Sargassum polyceratium deep-water (~30 m) populations had a shorter reproductive period than shallow populations (De Ruyter van Steveninck & Breeman, Reference De Ruyter van Steveninck and Breeman1987). Both low light conditions and high turbidity (due to proximity to a sandy bottom) may influence this strategy. The sediment deposition could directly affect reproductive effort of deeper S. cymosum fronds. Umar et al. (Reference Umar, McCook and Price1998) showed that an increased sediment load over Sargassum microphyllum thalli causes reduction of recruitment, growth, survival and vegetative regeneration. Supposing that the algae closer to sandy bottoms are unfavourably affected by this sediment influence, a higher receptacle production rate would be an interesting strategy for maximizing the reproductive output of these individuals and therefore keeping this zone colonized (McCourt, Reference McCourt1985).
It is registered that individuals from deep zone populations are lighter, shorter, less ramified and present a more evident seasonality in reproductive tissues (De Ruyter van Steveninck & Breeman, Reference De Ruyter van Steveninck and Breeman1987). In this study, lower zone individuals had their morphological and phenological traits almost constant throughout the year, except for the frequency of receptacles (the only variable with significant interaction between period and depth), which peaked in autumn. For these deeper individuals, environmental conditions may be suboptimal, forcing them to concentrate the effort of producing most of the receptacles in autumn rather than in vegetative or reproductive tissues throughout the year.
In a revision of the Sargassum genera (Veloso & Széchy, Reference Veloso and Széchy2008), an association of vegetative parameters (plant size and/or biomass) and reproductive effort (usually receptacles number or biomass) has been registered for many species. For the studied population, no significant relationship was found between algal shape and reproductive effort (ANCOVA), as previously noted for S. ilicifolium, S. subrepandum and Turbinaria triquetra (Ateweberhan et al., Reference Ateweberhan, Bruggemann and Breeman2005).
As well, no link between the number of primary branches and secondary branches (lateral branches) was evidenced (see Ateweberhan et al., Reference Ateweberhan, Bruggemann and Breeman2005), therefore not giving support to the pseudoperennial attribute noted for most of the Sargassum species (De Ruyter van Steveninck & Breeman, Reference De Ruyter van Steveninck and Breeman1987), the shedding of most of their secondary lateral branches after reproduction (McCourt, Reference McCourt1984; Martin-Smith, Reference Martin-Smith1993). This Sargassum cymosum population may be considered perennial because its secondary lateral branches are continuously shed and produced during the year (Paula & Oliveira-Filho, Reference Paula and Oliveira-Filho1982; De Ruyter van Steveninck & Breeman, Reference De Ruyter van Steveninck and Breeman1987).
For this perennial characteristic of studied species, temporal variation of the epibiosis load on Sargassum may lead to false conclusions. The coverage area of bryozoans, highly branched hydrozoans and poriferans appears to vary in relation to period of the year. Since these animals are often found encrusting the primary (basal) branches (Chemello & Milazzo, Reference Chemello and Milazzo2002; Fraschetti et al., Reference Fraschetti, Terlizzi, Bevilacqua and Boero2006) and these branches are resilient throughout the pseudoperennial life cycle of S. cymosum (Paula & Oliveira-Filho, Reference Paula and Oliveira-Filho1980), they may persist until the alga recovers. For these fouling animals, the epibiosis patterns tended to be higher in October (spring) and July (winter) and lower in January (summer) and April (autumn). Conversely, the opposite pattern is shown for the morpho-phenological traits of the algae, thus indicating that epibiosis is concentrated on these perennial primary branches (Fraschetti et al., Reference Fraschetti, Terlizzi, Bevilacqua and Boero2006). The strategy of settling on parts of the algae that are not shed secures the epibionts' population maintenance on algae through time (Williams, Reference Williams1996).
The temporal patterns observed for the epibionts is probably determined by temporal partitioning of recruitment and competitive interactions for algal substrate. The competition for space can result in epibiont mortality (Seed & O'Connor, Reference Seed and O'Connor1981), but this situation could be minimized by the seasonal growth of algae, which creates new substrate resources for settlement (Williams, Reference Williams1996). Hydrozoans and bryozoans can rapidly occupy newly available leaves and stems of seagrasses (Borowitzka et al., Reference Borowitzka, Lethbridge and Charlton1990) and on algae (Fraschetti et al., Reference Fraschetti, Terlizzi, Bevilacqua and Boero2006). Such recruitment patterns probably also occur on S. cymosum fronds. For the epiphytic algae, the epibiosis narrowly followed the S. cymosum patterns (see Reis et al., Reference Reis, Leal, Yoneshigue-Valentin and Belluco2003), showing that shading due to turbidity and temperature may also influence the seasonal life cycle of these algae (see Bravin & Yoneshigue-Valentin, Reference Bravin and Yoneshigue-Valentin2002 for experiments of environmental factors on H. musciformis).
Although not evaluated, the impact of grazing invertebrates (such as amphipods and gastropods) and fish, could act as an important structuring factor on the epiphyte community of S. cymosum. Experiments with gastropods showed that grazers are important to controlling epibiosis on the host algae (in this case, the phaeophycean Chondrus crispus), being regarded as possible mutualists (Stachowicz & Whitlatch, Reference Stachowicz and Whitlatch2005). The presence of Hypnea musciformis on Sargassum has been experimentally related to a decrease of herbivory by amphipods, which prefer to feed upon H. musciformis, thus controlling the epibiosis of this fast-growing epiphyte (Reis et al., Reference Reis, Leal, Yoneshigue-Valentin and Belluco2003; Jacobucci et al., Reference Jacobucci, Tanaka and Leite2009).
Depth seems to play a very important role in the strategy adopted by S. cymosum. Depending on the depth zone occupied, the environmental conditions (e.g. temperature, light intensity) allow the individuals to reproduce and grow year-round, with little seasonal variation. If these conditions are not optimal (as in deeper areas), the algae react seasonally, reproducing preferentially in April (autumn). Epibionts are not dependent on the plant morphology, and thus do not vary according to the availability and quality of their substrate. It is now very important to confirm the pseudoperennial trait of Sargassum cymosum, as well as the rate and moment of secondary (lateral) branch loss. Also, more studies focusing on the physiological responses to temperature and light intensity, apparently the most important factors regulating the Sargassum spp. populations would help to further explain the distribution patterns of this very important genus on rocky shores.
ACKNOWLEDGEMENTS
Thanks to the direction and the staff of Centro de Biologia Marinha of Universidade de São Paulo (CEBIMar–USP) which furnished the logistic structure for the research project. Special thanks to Linda Gwen Waters and Dr Gilberto Amado-Filho for comments and revision of the manuscript, and to the two anonymous referees for comments on the manuscript (Referee 1) and statistical analyses (Referee 2). This work was supported by Coordenação de Aperfeiçoamento de Pessoal de Nível Superior (CAPES) (G.B.J. scholarship grant); Conselho Nacional de Desenvolvimento Científico e Tecnológico (CNPq) (F.P.P.L., grant number 300337/82-5); and Fundação de Amparo à Pesquisa (FAEP).