The crux of political debates about civil liberties lies the specifics of a given situation: who should or should not be allowed to do what and why? Political debates are thus not carried out in the abstract, but involve references to specific political and social groups, to specific civil rights and include attempts to convince opponents by forwarding arguments tailored to the specific situation.Footnote 1 Extant research indicates that we should expect the public’s tolerance judgements to be influenced by such contextual elements,Footnote 2 but we still lack knowledge about which elements are significant, why they are, and when they are.
As Gibson and Gouws point out, one reason for this state of affairs is methodological. If we are to understand whether and how the public is sensitive to the specificities of actual political debate, we need to rely increasingly on methods that allow our survey questions to mimic the context of these debates.Footnote 3 In this article, we do just that in relation to one important contextual element: variations in target groups. Hence, we present a series of studies where the exploitation of experimental procedures allows us to examine tolerance judgements towards a range of highly different social and political groups. In this way, we move beyond the focus of much earlier research on tolerance, which has been pre-occupied with carrying out content-free measurements. Efforts at doing so have included the application of the so-called ‘least-liked’ technique, where questions are explicitly posed with regard to the group that the respondent distances himself from the most.Footnote 4 In general, conclusions have been bleak about citizens’ tolerance towards minorities. As Gibson sums up, ‘intolerance is a potent attitude, while tolerance is a weakling’.Footnote 5
However, ‘least-liked’ groups are often both extreme and violent. Hence, they are not representative of the full spectrum of groups discussed in civil liberties debates, and therefore this approach could neglect important differences between groups.Footnote 6 Using survey experiments, we extend recent research on the importance of reciprocity to moral judgements and propose that one such difference relates to the group’s own respect for the democratic rights of others. Consistent with this notion, we demonstrate, first, that tolerance is particularly high towards groups that observe democratic rights – even if these groups are ‘least-liked’ or feared. Indeed, sympathy for a group only appears to affect tolerance for those groups that are associated with violence and non-democratic means. Hence, we uncover a strong public consensus that groups playing by the rules of democracy are protected by the very same rules. Secondly, the conduct of the group does not just influence citizens’ immediate tolerance judgements, but also how easily citizens can be persuaded to express tolerance. Hence, citizens are especially persuaded by appeals for tolerance towards groups that respect the democratic rights of others, while appeals for intolerance are most effective towards groups that do not respect those rights.
These findings are important and revise current knowledge about the nature of tolerance judgements. First, earlier studies have demonstrated that feelings of antipathy increase intolerance.Footnote 7 Our results, in contrast, suggest that this is not the case for groups that accept the democratic rights of others. Secondly, extant studies suggest that it is easier to persuade people to forsake their originally tolerant position than to persuade those who are intolerant to become tolerant.Footnote 8 Again, our results suggest that this only applies to non-democratic groups. For groups that respect the democratic rights of others, it is actually easier to persuade the initially intolerant to become tolerant than the other way around. In tandem, these results imply that citizens are quite willing to grant democratic rights to minority groups even when they are highly different from the majority norm. Hence, tolerance seems to be stronger than previously thought. It is, however, not limitless. Tolerance towards a group presupposes that the group accepts the reciprocal rights of others.
The Concept Of Political Tolerance and Its Measurement
Political tolerance involves accepting the political rights of others, such as freedom of speech, even with respect to groups that one otherwise disagrees with or is actually afraid of.Footnote 9 As Sullivan, Piereson and Marcus noted, ‘Tolerance implies a willingness to “put up with” those things one rejects or opposes. Politically, it implies a willingness to permit expression of ideas and interests one opposes’.Footnote 10 In other words, tolerance is something one expresses towards persons or groups that one does not care for.
Given this understanding of political tolerance, Sullivan, Piereson and Marcus formulated a content-free measure of political tolerance, the so-called ‘least-liked’ application.Footnote 11 Their approach involves first presenting respondents with a list of politically extreme groups and asking which of the groups he/she feels the most negatively towards. Next, the tolerance-related questions are posed with explicit reference to this very group. If citizens acknowledge the democratic rights of this group, they were surely willing to ‘put up with’ a group they do not care for. However, the conclusions from a number of studies using the ‘least-liked’ approach are bleak. Thus, a majority of Americans found it entirely appropriate to limit the civil rights of their ‘least-liked’ group, including their freedom of speech.
The ‘least-liked’ approach has been criticized from a number of perspectives. First, the ‘least-liked’ groups will often be very extreme and violent. Whether or not one rejects the rights of such extremist groups does not bear on the subject of political tolerance with the same weight as if one were to reject the rights of groups who themselves observe other groups’ rights. By way of example, it is more consequential how citizens react to Muslims in general than how they react to Islamic Fundamentalists; but the ‘least-liked’ approach makes us focus on the most extreme group. Hence, the use of the ‘least-liked’ approach fails to grasp what has been called the ‘breadth of intolerance’.Footnote 12 Secondly, the ‘least-liked’ measurement strategy bypasses a fundamental question: can tolerance be expected to be limitless? When members of a group engage in violent and/or non-democratic behaviour, thereby denying others their basic rights, it might reflect a tolerant position to seek to curtail the activities of such extreme groups. This argument has been made pointedly by Sniderman et al.,Footnote 13 but the idea is not new. Liberal philosophers since Hobbes and Locke have justified the concept of civil liberties by invoking the notion of the social contract. From the perspective of the social contract, a group’s right to freedom is deeply linked to its own observation of the same rights in relation to other groups.
The Conduct Of Specific Groups and Tolerance Judgements
Few citizens have been trained in liberal philosophy. Yet research on tolerance and moral judgements suggests that the tolerance judgements of citizens could very well be influenced by the specific conduct of the group in question. This research demonstrates that the judgement and behaviour of citizens in a wide variety of circumstances is influenced by a particular set of deep-seated norms, norms of reciprocity.Footnote 14 On the subject of tolerance, the operations of such norms would imply that people should feel compelled to accept the rights of groups who themselves observe the democratic rights of other groups and feel compelled to reject the rights of groups that do not accept the rights of others.
In line with this, previous research on tolerance judgements has noted that groups associated with violent and non-democratic behaviour are in general less tolerated and that people’s reasoning on the matter is strongly influenced by the reciprocity logic.Footnote 15 Our argument, however, goes further. If citizens do indeed take a normative stance based on considerations of reciprocity, we should see that citizens not just take the specific conduct of the group into account but also make tolerance judgements in different ways depending on the group’s conduct. Rights to freedom should be strongly supported within the limits prescribed by considerations of reciprocity, but only weakly outside. In other words, tolerance should be strong within limits.
Specifically, our first prediction is that groups having no reputation for engaging in violent and non-democratic activities will be tolerated even when they are ‘least liked’. Thus, norms of reciprocity prescribe that such non-extremist groups, who play by the rules of democracy and live up to what one can expect in a democracy, should be allowed to enjoy rights and freedoms. In relation to extremist groups, however, the situation is different, in the sense that an individual’s perception of the problem posed by the group’s degree of lack of reciprocity should reflect the extent to which the individual sympathizes with the group’s cause. Hence, our second prediction from the notion of reciprocity norms is that an individual’s sympathy guides tolerance judgements for extremist groups, but not for non-extremist groups.
The extent to which a specific group respects the democratic rights of others might not just influence citizens’ immediate judgements but also the impact of persuasive appeals in debates about civil liberties. Thus, Gibson has carried out a number of studies in which questions regarding tolerance are first posed according to the ‘least-liked’ approach and then followed by a counterargument, which varies according to whether the person originally has subscribed to a tolerant or intolerant perspective.Footnote 16 Those studies demonstrated that many people could be persuaded by a counterargument, but the most recent studies indicate that it is easier to move tolerant respondents towards the intolerant camp than vice versa.Footnote 17 Again, however, this conclusion might be biased by the focus on the ‘least-liked’ and, hence, most extreme groups.Footnote 18
Research on persuasion has demonstrated that the persuasive effects of appeals are greatest when these appeals resonate with the receivers’ values and norms.Footnote 19 Given our argument that considerations about reciprocity are a fundamental ingredient in tolerance judgements, we should therefore expect the effects of counterarguments to depend on whether a group is extreme or not. Specifically, we should expect that the conclusions of previous research only hold up for extreme groups. Hence, our third and final prediction on the interplay between group characteristics and norms of reciprocity is the following: Appeals to limiting the rights of a group are most effective in relation to extreme, non-democratic groups. In reverse, appeals to equality should be highly persuasive in relation to groups that themselves respect the rights of others.
To summarize, we argue that the weakness of tolerance could have been overestimated in previous research because many of the ‘least-liked’ groups are associated with violence and non-democratic means. To the extent the public is guided by notions of reciprocity in their tolerance judgements, such groups are beyond the limits of tolerance. Such notions should, however, compel the public to tolerate democratic groups even if such groups are highly disliked. This suggests that when tolerance is assessed across a range of groups important in everyday politics, we will find that tolerance within specific limits is quite strong. Putting this argument to a test requires us to employ an approach to measuring tolerance which allows us to assess tolerance towards a large number of different social and political groups. To this end, we use a new set of survey experiments which allows us to tap the ‘breadth of intolerance’ while avoiding artificial consistency in the responses.
Data and Operationalization
In the spring of 2006, a survey of 1,967 Danish citizens aged 18–70 was collected. The data collection, carried out by SFI-Survey, was conducted by telephone and the respondents constituted a representative sample of the Danish population in the age span randomly selected from the Central Office of Civil Registration registry.Footnote 20 The response rate (AAPOR RR1) was 63 per cent, whereas the co-operation rate (AAPOR COOP3) was 77 per cent.
When measuring tolerance towards different groups, we run the risk that respondents will respond equally (in)tolerantly towards all groups in order to appear consistent even though in reality they hold different levels of (in)tolerance towards different groups.Footnote 21 To overcome this problem of artificial consistency, we have made use of the opportunity offered by experiments embedded in surveys. Thus, we have measured political tolerance judgements in relation to four political and four social groups while each respondent has only had to respond to one political and one social group. In so doing, we have avoided establishing artificial consistency in the responses to the target groups. In addition, we have measured the sympathies and antipathies of the respondents towards all of the groups studied. For each of the groups referred to, we can therefore register both the popular opinion as well as the opinions among those distancing themselves the most from the group and among those regarding the group as the most threatening.Footnote 22 Further, this approach enables us to advance counterarguments regarding the rights of specific groups and to examine the interaction between the target groups and persuasive appeals.
The general reciprocity logic underlying our argument, as well as work by Rohrschneider and by Kuklinski et al., implies that a group’s commitment to democracy and non-violence should be important determinants of the tolerance shown towards the group.Footnote 23 Therefore, we have chosen the groups for our study based on their diverging history precisely with respect to (non-)democratic and (non-)violent behaviour. The four political groups used in the survey are Neo-Nazis, the autonome,Footnote 24 the far right and the far left. The four social groups are Islamic fundamentalists, bikers, ordinary Muslims and fundamentalist Christian groups fighting against homosexuality and free abortion. Neo-Nazis the autonome, Islamic fundamentalists and bikers are all groups previously associated with an extremist stance in terms of violent and non-democratic behaviour, while the other groups have not been associated with such behaviour. Each category thus contains two non-extremist and two extremist groups.
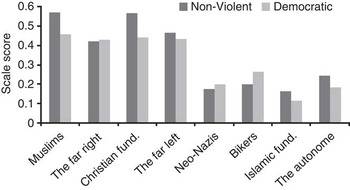
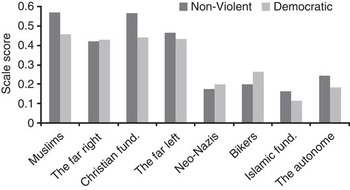
A validation study of a representative sample of 1,023 respondents has demonstrated that the public does indeed distinguish between extreme and non-extreme groups in the way we expect.Footnote 25 Thus, the study included measures of respondents’ perceptions of the degree to which the eight target groups are violent as well as the degree to which they respect the rules of democracy (see the Appendix for question wording). Figure 1 depicts the average responses to these questions. The results provide very strong support for our propositions. On both indicators, there is a clear differentiation between the four extreme and the four non-extreme groups: consistently, the Neo-Nazis, bikers, Islamic fundamentalists and the autonome are regarded as more violent and less democratic than the Muslims, the far right and left, and Christian fundamentalists (for violence, means on the 0–1 scale are 0.19 for extremists and 0.50 for non-extremists, p < 0.001; for democratic, means are 0.19 for extremists and 0.44 for non-extremists, p < 0.001).Footnote 26
Perceptions of target groups’ democratic commitment and use of violence Note: Columns indicate the average response on scales running from 0 ‘No respect for rules of democracy’ to 1 ‘Complete respect for rules of democracy’ and from 0 ‘Not at all violent’ to 1 ‘Very violent’. The latter scale is reversed in the figure.
In the main study, all respondents were randomly presented with one group from each category (i.e., a political group and a social group), and were asked whether they agreed that the target group ought to have the right to participate in the activities below. The response categories were ‘completely agree’, ‘somewhat agree’, ‘neither agree nor disagree’, ‘somewhat disagree’, ‘completely disagree’, as well as ‘don’t know’:
1. Representatives of [group] should not be allowed to express themselves in public debate.
2. The police should have better opportunities for tapping telephones owned by [group].
3. Representatives of [group] should have the right to speak at secondary schools.
4. Also, [group] should be allowed to hold demonstrations.
The second stage in the experiment consisted of confronting respondents with a counterargument. The counterargument followed the question about demonstrations and was only posed as a follow-up to the questions about the four political groups: Neo-Nazis, the autonome, and the far right and left. The counterarguments obviously varied according to whether the original answer had been positive or negative. If respondents agreed that the group in question should be allowed to hold demonstrations, they were subsequently randomly presented with one of two counterarguments:
A. This question is debated. Some people are against [group] holding demonstrations, because they often lead to violence. Thinking about that, to what extent do you then agree or disagree that [group] should be allowed to hold demonstrations?
B. This question is debated. Some people are against [group] holding demonstrations, because they themselves are not willing to respect the rules of democracy. Thinking about that, to what extent do you then agree or disagree that [group] should be allowed to hold demonstrations?
If respondents disagreed that the group in question should be allowed to hold demonstrations, they were randomly presented with one of the following two counterarguments:
C. This question is debated. Some people feel that real democracy requires that all groups have the same rights – including groups you don’t like. Thinking about that, to what extent do you then agree or disagree that [group] should be allowed to hold demonstrations?
D. This question is debated. Some people say that the Danish constitution dictates that all groups have the right to demonstrate in order to express their opinion. Thinking about that, to what extent do you agree or disagree that [group] should be allowed to hold demonstrations?
Just as the theoretical expectations set out above, the arguments used in the experiment are developed on the basis of our reciprocity theory as well as extant research showing the importance of violence and non-democratic behaviour to tolerance judgements.Footnote 27 Thus, Argument A points to the possibility that group’ demonstrations may turn violent, thereby indicating extreme behaviour on behalf of a group. Argument B invokes the core tit-for-tat logic of the concept of reciprocity applied to democracy: if a group does not behave according to democratic norms itself, it places itself outside the norms’ protection. Arguments C and D go in the other direction by pointing to the fairness aspect of reciprocity – you cannot just discriminate against disliked groups – as enshrined in democratic theory as well as the constitution. By applying the experimental design here, we are able to assess whether these different arguments have the expected different effects for different groups.
The Importance of Group Conduct
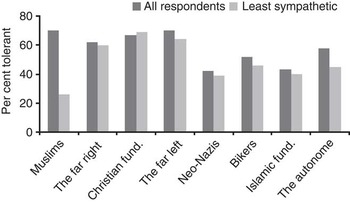
Figure 2 presents political tolerance towards the eight target groups (averaging over the four indicators).Footnote 28 The first confirmation of the importance of distinguishing between specific groups based on their conduct comes from the darker columns showing the extent of tolerance in the total sample. Least tolerance is displayed towards Neo-Nazis, Islamic fundamentalists, bikers and the autonome, whereas the greatest tolerance is shown towards the far left and right, Christian fundamentalists and ordinary Muslims. In other words, the target group clearly matters for political tolerance and that precisely in the way suggested by the norm of reciprocity: the extreme groups are clearly tolerated less than the non-extreme groups (the average percentages of tolerant responses are 48.5 for extremists and 67.1 for non-extremists).Footnote 29
Tolerance by target group Note: Columns represent the percentage of tolerant responses averaged across the four indicators (see the online appendix) for all respondents as well as for those indicating 0 sympathy for the groups on the 0–10 sympathy scale.

In fact, the distributions in Figure 2 are even more dramatic than they might first appear. As our argument suggests, even those who dislike the non-extreme groups should grant them democratic rights. This is exactly what the lighter columns in Figure 2 show. These columns display levels of tolerance expressed by those who like each target group the least (see the Appendix for question wording; the figure depicts tolerance among those placing themselves at 0 on the sympathy scale). As is clear from Figure 2, tolerance is lower among those with low sympathy than is the case in the general population, but, with a single exception (see below), the differences between the darker and lighter columns for each group are small. In general, these results are consistent with the argument about the importance of the conduct of the specific group (among the least sympathetic, the average percentages of tolerant responses are 41.3 for the four extremist groups and 65.1 for the three non-extremist groups, excluding the Muslims).Footnote 30 Hence, most people do not tolerate extreme groups, while many display tolerance towards non-extreme groups even if they have no sympathy for them.Footnote 31
The interesting exception is the high degree of intolerance towards Muslims among those with least sympathy. On our interpretation, this finding suggests that whether a group lives up to the norm of reciprocity or not is a matter of perception. Hence, Muslims have a special status in public discourse in Western Europe in general and Denmark in particular.Footnote 32 Thus, for better or worse, Muslims have come to stand at the centre of debates about immigration and multiculturalism in most countries in Western Europe. As a result, attitudes towards the group are highly politicized and highly polarized. Importantly, negative attitudes towards Muslims in Western Europe are, in part, grounded in the perception that the social practices of even ordinary Muslims are in conflict with liberal ideals.Footnote 33 In the eyes of those highly negative towards Muslims, this group does, in other words, not fulfil its democratic obligations. Hence, even though Muslims are not generally seen as extreme, they are by a small ‘hard core’, and these individuals are very unforgiving towards the group (the percentage of respondents placed at 0 on the sympathy scale is 5.6 for Muslims compared to 65.7 and 73.8 for Islamic Fundamentalists and Neo-Nazis, respectively).
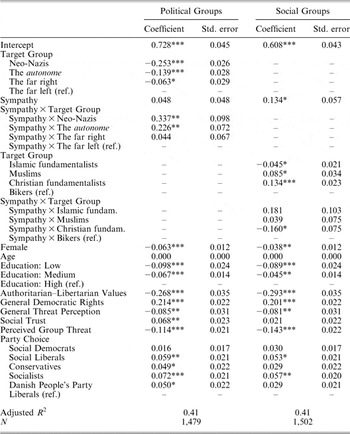
Previous research has included a number of variables in the analysis among which the threat posed by a given target group has appeared as an important predictor of tolerance for minority groups.Footnote 34 To further validate the importance of distinguishing between specific groups, Table 1 presents an ordinary least squares (OLS) regression model where tolerance is regressed on target group, group sympathy, perceived group threat, age, gender and education of the respondents, their positions on scales for authoritarian–libertarian values, general democratic rights, general threat perception, and social trust as well as the respondents’ party choice (as a proxy for their ideological position) – all of which have been included in previous analyses of tolerance (measurement details are presented in the Appendix).Footnote 35 This model also allows us to test the prediction derived from the reciprocity logic about the differential effect of sympathy on tolerance for extremist and non-extremist groups.
Regression of Tolerance on Target Group, Group Sympathy, Perceived Group Threat, Gender, Age, Education, Authoritarian-Libertarian Position, Democratic Rights, General Threat Perception, Social Trust, and Political Party Choice

Note: *: p < 0.05; **: p < 0.01; ***: p < 0.001. Entries are unstandardized regression coefficients and standard errors. The dependent variable is scaled from 0 to 1, with 1 being the most tolerant.
Again, the results provide support for our expectations. First, the coefficients for the group variables show the same distribution of tolerance across the eight groups as described above. In other words, controlling for a large number of alternative explanatory variables, we still find the clear division between extreme and non-extreme groups (at least when sympathy is at its lowest). This is indicated in Table 1 by the large and negatively signed target group coefficients for Neo-Nazis and the autonome and the positive coefficients for Muslims and Christian fundamentalists.
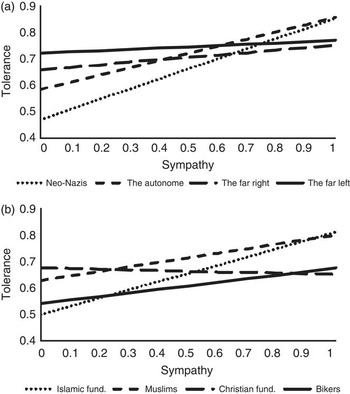
Secondly, the proposed interactions between group sympathy and the target group are clearly significant for both political (F 3, 1457 = 6.381, p < 0.001) and social groups (F 3, 1480 = 4.679, p = 0.003). We predicted group sympathy to have an effect on tolerance only for extremist groups because – due to the norm of reciprocity – the rights of non-extremist groups should be tolerated regardless of people’s sympathy towards them. Across the eight groups, the effect of sympathy for seven out of eight groups shows the expected pattern. Thus, if the models are re-specified so that the size and significance of the effect of sympathy on tolerance are tested separately for each group rather than in contrast to the reference group, we find group sympathy effects of 0.385, 0.274 and 0.315 (all p < 0.001) for Neo-Nazis, the autonome and Islamic fundamentalists, respectively, and for bikers the effect of 0.134 is also significant (at p = 0.02). For the non-extreme groups, by contrast, the effect is generally weak (0.092, 0.048 and −0.026 for the far right, the far left and Christian fundamentalists, respectively) and fails to reach significance at the 0.05 level. Unsurprisingly, once again Muslims stand out with an effect of 0.172 (p = 0.001).Footnote 36 To help interpret the substantive meaning of the results, the influence of sympathy on tolerance for each group is depicted in Figure 3.Footnote 37
Predicted tolerance for eight groups by level of sympathy Note: The predictions are based on the estimates in Table 1. Predictions are for males with high education who vote for the Liberals; all covariates are kept at their mean. Panel (a). Political Groups and Panel (b). Social Groups

In general, these findings point to the importance of distinguishing between target groups. Our approach has demonstrated that tolerance varies considerably between target groups, even when we control for sympathy and a range of other relevant variables. As expected, the decisive factor appears to be whether a specific group is seen as extreme: in the population, tolerance is clearly lower for extreme groups that are violent and do not respect the rules of democracy than for non-violent and democratic groups, even if these are disliked or feared. The behaviour of the former, that is, may raise concerns that these groups do not fulfil the norm of reciprocity, and thus make people inclined to limit the groups’ freedoms. Hence, most people do not perceive tolerance to be limitless.Footnote 38 But this also implies that previous studies, since these have focused on extreme groups, have probably underestimated the level of tolerance.Footnote 39
Group Conduct and CounterArguments
So far, we have investigated what could be referred to as people’s visceral tolerance for diverse groups. However, actual political debates about political tolerance not only reference different groups but also involve exchanges of arguments tailored to convince the counterpart. Using data from Russia and South Africa, Gibson and his collaborators have shown that tolerance is more pliable than intolerance to these kinds of arguments.Footnote 40 Again, however, the conduct of the specific groups should matter, and hence we predict that this conclusion does not hold when looking at target groups not associated with violence and non-democratic behaviour.
To test this, we included the second stage in our experiments, in which respondents were subjected to arguments running counter to their original standpoints. In the following, we focus exclusively on the vast majority of respondents who were originally either for or against a group having the right to demonstrate.Footnote 41 The ‘changers’ are, therefore, those respondents who shifted from one clear opinion to an equally clear – but directly opposed – opinion. As mentioned, this part of the experiment was only carried out in connection with the four political groups: Neo-Nazis, the autonome, and persons on the far right and left.
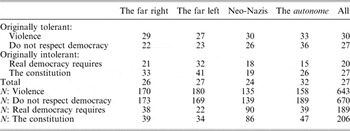
Consistent with previous studies, a considerable proportion of the respondents could be talked out of their original opinion when exposed to a counterargument.Footnote 42 Generally speaking, we are able to persuade 27 per cent of those with a clear opinion to switch to the opposite opinion (this percentage is, however, smaller than in previous studies). Importantly, this figure covers a number of differences between the groups and between arguments as can be seen in Table 2.
Number of ‘Opinion Changers’ by Target Group and Counterargument

Note: Entries are percentage changing towards intolerant or tolerant response, respectively.
First, as shown in the last column, overall it is somewhat easier to persuade people who were initially tolerant to shift to an intolerant opinion than vice versa. By pointing out the risk of violence in connection with a demonstration of the lack of respect for democracy, we can move 30 and 27 per cent, respectively, to be against demonstrations. Conversely, we can ‘only’ move 20 and 27 per cent, respectively, of those initially against demonstrations with the arguments that democracy requires equal rights or that the Danish constitution ensures the right to demonstrate.Footnote 43 These results are in accordance with studies carried out by Gibson in the United States, Russia and South Africa, in which it was consistently easier to persuade people to adopt an intolerant position than the reverse. But the difference in pliability between the initially tolerant and the initially intolerant is smaller in Denmark than in the other countries and it fails to reach significance at the 0.05 level.
More importantly, however, the conclusion that it is easier to persuade people to intolerance than to tolerance only holds true for two of our four groups: Neo-Nazis (p = 0.016) and the autonome (p = 0.015), i.e. the two extreme groups. As regards the far left, it is actually easier to persuade people to shift to a tolerant position than to an intolerant one (p = 0.048), while there is no significant difference in relation to tolerance/intolerance towards those on the far right (p = 0.730). In other words, the relatively pessimistic result from previous research must be revised in the light of the study at hand: For some groups, the non-extreme ones, it is at least as easy – and sometimes even easier – to persuade people to become tolerant than the other way around. These findings are exactly what we expected. That a group itself respects the democratic rights of others can be used in persuasive appeals to make people more tolerant, as can a group’s lack of respect for the democratic rights of others be used to talk people into a more intolerant position.
The importance of taking the specific conduct of a group into account is further emphasized by the different effects of the specific arguments: referring to the constitution was a more persuasive argument in relation to the non-extreme (far left and right) groups than in relation to the extreme groups, whereas pointing to the lack of respect for democracy was much more persuasive in relation to the extreme groups, especially the autonome. These findings suggest that it is easier to move people with arguments that resonate with the proposed link between tolerance and norms of reciprocity in the sense that people can be more easily moved to deny civil liberties to extremist groups and to accord these liberties to groups using legitimate political means.Footnote 44
Discussion
Citizens’ reactions to debates about political tolerance are influenced by the specific details of the debate itself. In this article, we have demonstrated the importance of the contextual aspects of civil liberties controversies for the pliability of political tolerance judgements: which arguments are offered in the debate and who the debate is about. While the general observation of the pliability of political tolerance judgements is not new, the implications of our specific observations of the nature of this pliability are.
Most importantly, our findings from survey experiments revealed a more optimistic story about citizens’ political tolerance than has hitherto been told. Hence, scholars have suggested that tolerance is a weak and perhaps even an unnatural stance.Footnote 45 Extant research suggests that this is true by demonstrating, first, that citizens deny disliked groups democratic rights and, secondly, that tolerance is more easily undermined by counterarguments than is intolerance. Much of this research has been carried out using the ‘least-liked’ approach, in which tolerance judgements are tapped in relation to the group the respondent despises the most. Importantly, the present study suggests that the bleak conclusions of extant research might be a result of the special characteristics associated with many ‘least-liked’ groups and, especially, their association with violent and non-democratic conduct.
In general, our findings suggest that scholars should increasingly focus on how tolerance judgements vary across distinct groups and theorize about how the specific characteristics of a group influence the way tolerance is expressed. Specifically, we were able to demonstrate that tolerance is strong but only so within limits prescribed by norms of reciprocity. Hence, people are remarkably tolerant towards non-extremist groups, even if these are disliked. In fact, people’s sympathy for a non-extreme group does not seem to play any role in the tolerance expressed. Similarly, we demonstrated that initially intolerant persons can be persuaded by appeals for tolerance in connection with non-extreme groups, while it is much harder to persuade the initially tolerant to change their opinion towards these groups. These findings, then, suggest that the conduct of the specific group in question introduces a gestalt switch in the way tolerance judgements are made.
The experimental approach allowing us to obtain these results was developed as an alternative to the prominent ‘least liked’ approach to tolerance. We do not, however, believe that our results imply that the ‘least liked’ approach should be abandoned. What we have shown is how the application of a different approach leads to different results that are applicable to a broader range of groups in society – including those that are non-extremist. As in most societies such groups dominate, this approach provides socially highly relevant results. These, we believe, generalize beyond the Danish context. Thus, we built our argument and derived our predictions based on mechanisms of reciprocity documented in settings very different from that of Danish politics and our findings are consistent with previous research on tolerance from Canada and the United States.Footnote 46
Since groups like those in our study come with clusters of attributes, our results do not, however, permit definitive conclusions about the relative importance to people’s tolerance judgements of a group’s association with violence relative to its failure to endorse democracy. This clustering of attributes also extends beyond the two under investigation here. Hence, democratic, non-violent groups are also typically larger, more organized and more mainstream in terms of, for example, appearance. In this way, the two sets of groups we have considered in this study differ in more respects than by one set being violent and non-democratic and the other non-violent and democratic. It is important to note, however, that many such group characteristics are highly intertwined and even causally related. In the context of a well-established democratic culture, for example, democratic groups tend naturally to be larger given the resonance between the practice of the group and the ideals of society. Presumably, many of the differences between the sets of groups will flow from the characteristics we have stressed: the group’s level of violence and its stance towards democracy. Still, in future research, it would be important to disentangle the effects of these different yet interrelated characteristics in greater detail empirically and, in this way, to pinpoint the most important of these characteristics empirically.
This caveat notwithstanding, our observations tell a more positive story about the nature of public tolerance than the one found in extant research. First, as previous studies have focused on extreme groups, they have probably underestimated the level of tolerance. Secondly, when intolerance is displayed it is targeted more strongly at groups associated with violent or non-democratic conduct. While not all members of such groups may themselves exhibit such behaviour, the results do at least show that intolerance is not directed at any and all minority groups; i.e. non-extreme groups are tolerated far more than the extreme. In other words, while tolerance does have limits, these limits are generally not random – they are regulated by the norms of reciprocity.
Still, our findings do leave room for concern. Hence, in the case of Muslims, we saw how perceptions matter. Regarding such highly politicized groups, there is no consensus on whether the group fulfils its democratic obligations or not and, hence, on whether it should be granted rights to freedom or not. While the majority of Danes do perceive Muslims as non-extreme, a small segment of the public strongly wishes to limit the rights of Muslims. Even while tolerance is strong within the limits prescribed by norms of reciprocity, a seemingly democratic group can still, at least by some, be judged outside these limits.
Appendix
The questions posed in the validation study were: 1. ‘Here is a list of groups in Denmark. For each group please indicate how violent you think the group is.’ The scale ran from ‘0 Not at all violent’ to ‘10 Very violent’. 2. ‘Here is a list of groups in Denmark. For each group please indicate whether you think the group respects the rules of democracy.’ The scale ran from ‘0 Does not at all respect the rules of democracy’ to ‘10 Completely respects the rules of democracy.’ In addition, ‘Don’t know’ was a possible answer. The answers were rescaled to run from 0 to 1.
The variables in the main study are constructed in the following way:
Group sympathy is measured by the question: ‘I will now list a number of groups in Denmark and ask what you think about them. Please respond on a scale from 0 to 10, 0 indicating that you do not like the group at all, 10 indicating that you like the group very much.’ Responses were rescaled to run from 0 to 1.
Tolerance is measured by means of the four items described in the design section. The items are combined into a scale running from 0 to 1 with 1 being most tolerant. In the case of missing values, respondents have been allocated their average values on the other items. Respondents with more than one missing value were removed from the analysis. These principles for handling missing values have been followed throughout the analyses unless otherwise stated.
Age is included as an interval variable.
Education is divided into three groups: elementary school–8 years, 9–10 years, high school.
Perceived group threat is measured by the following question: ‘I will now list a number of groups in Denmark and ask how great a threat you believe each of them poses to Danish society. Please respond on a scale from 0 to 10, 0 indicating that a group is not threatening at all, 10 indicating that the group is very threatening.’ Respondents were asked to place all eight groups and the answers were rescaled to run from 0 to 1.
Authoritarian–libertarian values are measured by means of five Likert-type items: ‘Violent crimes ought to be punished much harder than is currently the case’; ‘Economic growth should be ensured by expanding industry, even if this is at the cost of environmental interests’; ‘Crime is better prevented with preventive measures and counselling than with harsh punishments’; ‘Immigration constitutes a serious threat to our national character’; ‘If there are not enough jobs, employers should employ Danes ahead of immigrants’. There were five response categories ranging from ‘Completely agree’ to ‘Completely disagree’. ‘Don’t know’ was also possible. The five items are combined in a scale with Cronbach’s Alpha of 0.63. High values on the scale, which goes from 0 to 1, indicate an authoritarian position.
General democratic rights are measured by means of two Likert-type items: ‘All political groups should have the right to express themselves, even if the things they are saying can be offensive to large parts of the population’, and ‘Radio and TV should muffle extreme opinions’. The two items were combined and scaled to run from 0 to 1 with 1 being the most democratic position (with only two items, the computation of Cronbach’s Alpha does not make sense).
General threat perception is measured by means of six Likert-type items: ‘I am afraid that my personal financial prospects are constantly getting worse’; ‘I am afraid that the Danish economy will develop in a negative direction in the years to come’: ‘I am afraid that Danish culture is currently under threat’; ‘I am worried that the welfare state, as we know it today, is currently under threat’; ‘I am worried that violence and crime will increase in my area’; ‘I am worried that we will experience more violence and terror in Denmark’. The items are combined into a scale with Cronbach’s Alpha of 0.66. High values on the scale, which goes from 0 to 1, indicate a high level of perceived threat.
Social trust is measured by means of three items, two of which are in Likert format: ‘There are few people you can trust completely’; ‘Other people will exploit you if you are not careful’. The third item runs as follows: ‘Do you think that you can trust most people, or do you think that you can’t be too careful when dealing with others?’ The answer categories were: ‘Trust’, ‘It depends’, ‘You can’t be too careful’. The last item was recoded to the same width as the two others and they were then combined into a scale with Cronbach’s Alpha of 0.69. High values on the scale, which goes from 0 to 1, indicate a high level of social trust.
Party choice is measured by means of the item ‘If there was a Folketing election tomorrow, which party would you vote for?’ Respondents choosing the Centre Democrats, the Christian Democrats, the Progress party, other candidates or those who did not indicate a preference were excluded from the analysis (in the case of the three parties because of their small number). Respondents choosing the Red-Green Alliance were combined with the Socialist People’s party due to their small number.