

DISCUSSION POINTS
-
• Is it justified to identify the take-off of fossil fuel use as the tipping point toward “modernity” rather than – as is more common – the onset of industrial technology?
-
• The vicious cycle of increasing area productivity at the expense of labor productivity as the key driver of population growth in agrarian regimes – overstated?
-
• Is the stagnating/declining materials and energy use in high-income industrial countries an indication of a pending regime change or a result of globalization?
-
• Does a conceptualization of history as coexistence of and transition between energy regimes provide a benefit for understanding the challenges ahead?
Introduction: Energy use and societal development
Climate change and looming supply shortages of fossil energy carriers have recently brought the role of energy in societal development to the forefront of academic and public interest. Social theory on the mutual influence of societal development and energy, however, dates back to the transition from biomass-based to fossil energy. In the mid-19th century, Herbert Spencer argued that abundant supplies of energyFootnote * lead to “surplus social energy” which advances civilization by enabling population growth, social differentiation, and cultural activities beyond the fulfilment of basic needs. “The [energy affluent] society grows larger, more complex, and more active”. Reference Spencer2 Despite this strong focus on energy in explaining societal development, Spencer did not recognize the importance of coal in the sudden abundance of energy in his time. Early works in cultural anthropology also identified the importance of energy for the evolution of human societies, Reference Morgan3 and culture was occasionally described as a “manifestation of energy”. Reference White4,Reference Steward5 The opportunities and limits of societal development in relation to energy were analyzed by Cottrell in the mid-20th century and revised early in the new millennium in light of the fast-paced change that the energy system had undergone. Reference Cottrell6 The physicist Smil compiled encyclopedic knowledge on the role of energy in nature and society. Reference Smil7–Reference Smil11 Ayres and Warr Reference Ayres and Warr12 explored the theory of and provided empirical evidence for the link between economic growth and “exergy”, that is, useful energy contained in a given energy form or a material. Exergy reflects the maximum amount of work (or change) that a system or a material/energy flow can exert.
The amount of energy that can be used by a society is limited by the accessible sources of energy and the available conversion technologies. Most contemporary narratives of the history of societal progress and economic growth focus on energy conversion and the role of technology. In contrast, this review focuses on the role of the dominant energy sources. According to classical political economics, as represented by David Ricardo and Adam Smith, economic wealth is mainly generated by human labor making use of land. Reference Smith13,Reference Ricardo14 Ricardo Reference Ricardo14 considered wealth to be generated from the “produce of the earth” and accordingly identified land (or lack thereof) as the key constraint to growing wealth. Human labor was also described by Karl Marx as “the universal condition for the metabolic interaction between man and nature”. Reference Marx15 In contrast to Ricardo, Marx did not consider land (or resources in general) to constitute a limiting factor. He defined the abilities of a society to mediate and control its metabolism to depend upon the development of its “means of production”, i.e., its technology, based on (principally unlimited) human ingenuity. In the 20th century, neoclassical economists followed this line of thinking and explained the generation of wealth without assigning a causal role to natural resources, focusing production functions exclusively on capital and labor [e.g., Refs. Reference Cobb and Douglas16 and Reference Solow17]. Technological innovation, as an essentially immeasurable quantity, stood in for the substantial residual in explaining economic growth by labor and capital. Critics have proposed that this residual should be attributed to natural resources: the energy (or exergy) input into the economy. This claim is supported by substantial empirical evidence. Reference Cleveland, Costanza, Hall and Kaufmann18–Reference Hall and Klitgaard21
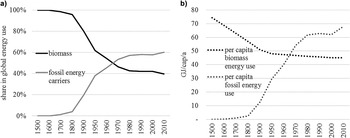
The historic and current transition from biomass-based to fossil energy systems can be observed globally Reference Krausmann, Gingrich, Eisenmenger, Erb, Haberl and Fischer-Kowalski22 as well as regionally. Reference Schaffartzik, Mayer, Gingrich, Eisenmenger, Loy and Krausmann23 In the late 20th century, research began to focus on the shift in the energy systems of developing countries. Reference Leach24 In the early 21st century, the ongoing energy transition in the so-called emerging economies, especially in China and India as “growing giants”, Reference Hashimoto, Fischer-Kowalski, Suh and Bai25 received much attention. Reference Pachauri and Jiang26 Figure 1 illustrates this transition by presenting the global share of biomass-based and fossil energy in total global energy use Footnote † between 1500 and 2010.
Share of biomass and fossil energy carriers in total global energy use (a) and per capita energy use in Gigajoules per capita and year (GJ/cap/a) by energy source (b) between 1500 and 2010 (source of data: Ref. Reference Krausmann, Gingrich, Eisenmenger, Erb, Haberl and Fischer-Kowalski22 and SEC Database; global energy use measured as DEC). The x-axis is scaled in 100-year intervals between 1500 and 1900 and in 10-year intervals between 1950 and 2010.

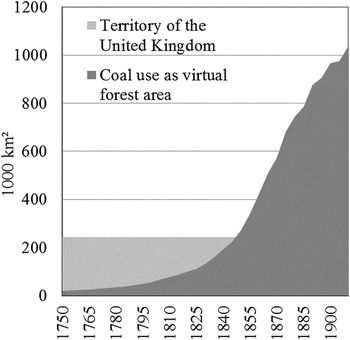
The shift in energy sources began much earlier than usually recognized: During the Dutch “Golden Age” in the 16th century, peat already amounted to more than 10% of primary energy use in the Netherlands and by 1700, coal had a share of 20% in the energy use of the United Kingdom. Reference Pallua28,Reference Warde, Kander, Malanima and Warde29 While in the Netherlands, the use of peat competed with agricultural land, Reference Gerding30 in the United Kingdom, the use of coal instead of increasingly scarce fuel wood allowed for a continuing process of urban growth, fueling (preindustrial) manufacture and textile production for export. A number of authors analyzed the United Kingdom's rise to political hegemony as a result of the country's changing energy system. Reference Sieferle, Krausmann, Schandl and Winiwarter31,Reference Warde32 The country's access to a “subterranean forest” Reference Sieferle33 in the form of coal provided an order of magnitude more energy (and energy of much higher density) than could have been provided by fuel wood even if the entire territory of the United Kingdom were covered in forest. By 1900, an area 5 times the size of the United Kingdom would have been required to produce an amount of fuel wood with an energy content equivalent to the amount of coal used (see Fig. 2).
Coal use in the United Kingdom between 1750 and 1910 expressed as virtual forest area. Virtual forest area is the area required to provide fuel wood from annual growth (not from standing timber) with an energy content equivalent to the coal used. Source: Refs. Reference Sieferle33 and Reference Krausmann, Fischer-Kowalski, Singh, Haberl, Chertow, Mirtl and Schmid34.

In the 18th century, the invention of the steam engine was instrumental in triggering industrialization, not only in the United Kingdom but also across Europe and eventually the rest of the world. Footnote ‡ Industrialization caused large-scale ecological and social transformations and continues to spread from the industrial core countries (currently comprising about 20% of the world population) to the much larger rest of the world, at an accelerating speed. Reference Krausmann, Gingrich, Eisenmenger, Erb, Haberl and Fischer-Kowalski22,Reference Fischer-Kowalski and Haberl36 From a socio-metabolic perspective, the control of an additional energy source with an hitherto unknown power Reference Smil10 marks the beginning of a new era – even if the technologies to make efficient and diverse use of this energy were to evolve and spread only gradually.
Fossil energy carriers dominate current global energy use; this metabolic model will not extend indefinitely into the future. Based on the pioneering work of Hubbert, Reference Hubbert37 researchers hold that global peak oil will occur soon or has already occurred. Reference Campbell and Laherrère38 More recent work suggests that other fossil energy carriers, such as coal or natural gas, may also be subject to a peak. Reference Murphy39,40 Yet, estimates of the future availability of fossil energy carriers diverge strongly. Reference Murphy39,40 The medium term impact of the current “revolution” in oil and gas mining via “unconventional sources” is contested. 40,Reference McJeon, Edmonds, Bauer, Clarke, Fisher, Flannery, Hilaire, Krey, Marangoni, Mi, Riahi, Rogner and Tavoni41 Other researchers believe that market forces, technological progress, and resource substitution will allow for sufficient supply of energy more or less indefinitely into the future, with no major obstacle to fossil fuel availability ahead. Reference Meng and Bentley42,Reference Jackson and Smith43 Researchers concerned with climate change argue that if humanity continues on its track of increasing fossil fuel use, let alone burns all the fossil fuel reserves now deemed accessible, global warming far above the critical 2 °C limit recommended by the Intergovernmental Panel on Climate Change (IPCC) will ensue. Reference Meinshausen, Meinshausen, Hare, Raper, Frieler, Knutti, Frame and Allen44,Reference Stocker, Qin, Plattner, Tignor, Allen, Boschung, Nauels, Xia, Bex and Midgley45 This might create a critical situation for civilization altogether. Some authors view the exceptionally benign and stable climatic conditions of the Holocene as an indispensable precondition for the evolution and maintenance of complex anthropogenic systems. Reference Schellnhuber, Cramer, Nakicenovic, Wigley and Yohe46 Globally, a (next) transition to renewable energy sources (i.e., geothermal, hydro, solar, wind, tidal, and biomass) is still in an early stage: in 2009, 52 Exajoules (EJ/a) from modern renewable sources Footnote § amounted to a share of 10% of global total primary energy supply (TPES), 40 and to 7% of global domestic energy consumption (DEC) (see footnote 2 for definitions).
The interplay of energy use and societal development of the past shapes both present energy use and future options. This review focuses on shifts in dominant energy sources, in the quantity and quality of energy use from these sources, and on the role these shifts played for social change. In section “Modes of societal energy use: Socio-metabolic regimes”, we identify and describe socio-metabolic regimes as they occurred throughout human history. The section “A next transition ahead?” deals with indications that there may be a next energy transition ahead. The concluding section “Conclusions: Is a new energy transition about to take off?” attempts a cautious résumé as to how a potential future transition might be comparable to the transitions observed in the past.
Modes of societal energy use: Socio-metabolic regimes
The conceptualization of modes of societal organization as not only socially or socio-economically but also as socio-ecologically distinct is an important achievement of the environmental historian Sieferle. The relevant socio-ecological characteristics comprise social organization along with its intended and unintended environmental impacts. The source of energy and the dominant technology for conversion of that energy into socially useful forms allows for an analysis of the functional problems faced by societies in each of the modes. Sieferle Reference Sieferle33,Reference Sieferle47,Reference Sieferle and Benzig48 distinguishes three modes, or socio-metabolic regimes:
-
(i) hunting and gathering,
-
(ii) agrarian, and
-
(iii) industrial.
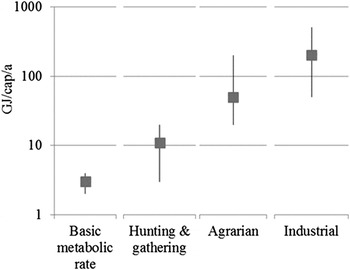
In the hunting and gathering mode, the energy system is “passive solar energy utilization”. Energy for human societies is gained from products of recent photosynthesisFootnote ** either directly (vegetable food and firewood from gathering activities) or indirectly (animals from hunting activities). This energy system requires mobility and allows for low population densities only. In the agrarian mode, the energy system is “active solar energy utilization”. Plants providing energy to humans directly (food crops) and indirectly (fodder crops) are cultivated on areas cleared of their natural vegetation. The cultivated crops “actively” harness solar energy. This energy system requires a sedentary way of life and allows for much higher population densities than the hunting and gathering mode. The industrial mode, in contrast, so far is based largely on fossil energy carriers supplying human societies with an amount of energy never accessible before, and with new materials. The transition to the industrial mode partially relieves human societies of their dependence on land and fosters urban growth. Each of the modes is associated with specific levels of per capita energy use Footnote †† depicted in Fig. 3.
Metabolic rates (energy use in Gigajoules per capita and year (GJ/cap/a)) by energetic mode. The squares represent the average metabolic rate across all societies under each particular energetic regime, the whiskers represent the range of metabolic rates within. The “basic metabolic rate” is the average physiological food demand. Please note the logarithmic scaling of the y-axis. Source of data: Refs. Reference Fischer-Kowalski and Haberl36 and Reference Fischer-Kowalski, Krausmann and Pallua49.

While, on average, a human requires approximately 3 Gigajoules of energy per year (GJ/cap/a) to survive (basic metabolic rate Footnote ‡‡ ), societies in the hunting and gathering mode use 3.7 times as much energy (11 GJ/cap/a). For agrarian societies, the factor is 16.7 (50 GJ/cap/a), and for industrial societies 66.7 (200 GJ/cap/a). Accounting for energy use including human food and all animal feed (fodder and grazing) rather than, as in most other accounts, only that share of food and fodder required for work makes sense environmentally: humans and their livestock compete with other animals for products of photosynthesis, and whatever they consume is no longer available for other uses within the ecosystem, Reference Vitousek, Ehrlich, Ehrlich and Matson51 thus affecting biodiversity. It also makes sense socially: communities have to provide for the basic needs of their human members and their livestock, irrespective of whether they work or not. For preindustrial societies, our calculation renders somewhat higher metabolic rates (i.e., energy use per capita and year) than other sources: they typically neglect the amount of biomass grazed by domestic animals or only include the fodder required for animals to perform work. Reference Smil11,Reference Malanima, Kander, Malanima and Warde52
The defining energetic parameters within these modes link to very distinct trajectories of societal development, each with specific opportunities and limitations, as will be discussed in the following.
The hunting and gathering mode
Passive solar energy use in the hunting and gathering mode and the cultural evolution of societies are mutually dependent. There are two important technological links: i) the preparation of food with the help of fire and ii) hunting technique and equipment. The use of fire in food preparation has socio-ecological and cultural relevance. The energetic use of fuel wood for cooking turns biomass, which would otherwise not be edible and/or would be poisonous, into food and saves endosomatic energy in digestion. Reference Wrangham50 This is an evolutionary advantage as humans can sustain themselves on a smaller food intake (and a smaller territory) than otherwise comparable omnivorous animals. The use of fire for cooking also affects social organization: humans do not consume food individually where they find it, but bring it back to a shared fireplace, creating a division of labor in food procurement and a collectivity in food consumption. This reinforces social interdependence within larger groups, stimulates communication and the development of language. Reference Goudsblom53 Second, hunting techniques and equipment evolve only slowly. Innovations which make hunting more successful have a tendency to speed up the (local) extinction of the preferred prey, forcing societies to migrate at a higher rate or to move further down the trophic scale in search for food (Ref. Reference Sieferle47). Footnote §§ The use of fire in hunting, known to have occurred in some regions, can be one of the self-defeating technologies. Burning vegetation to drive herds of herbivores toward hunters or down cliffs kills more animals than can be eaten and destroys large amounts of biomass without an added energetic value for humans. Reference Gill, Williams, Jackson, Lininger and Robinson54,Reference Rule, Brook, Haberle, Turney, Kershaw and Johnson55 Thus, in general, the passive solar energy system of hunters and gatherers does not lend itself to rapid technological development, and the migratory way of life limits the possibilities of accumulating personal belongings and of building durable infrastructure.
The energy system of hunting and gathering also has implications for population dynamics: fertility is low for a number of reasons. Containers for cooking liquids are not availableFootnote *** and infants depend on breast-feeding. This reduces the mother's fertility as well as the chances of survival for siblings of small age difference. Reference Ellison56,Reference Ammerman and Cavalli-Sforza57 Secondly, the average diet in such societies is relatively low in fat Footnote ††† and chronic fat deficiency reduces ovulation. Reference Lee, Cohen, Malpass and Klein58 Most important, though, is the low labor burden of the hunting and gathering mode. Reference Sahlins59,Reference Singh, Grünbühel, Schandl and Schulz60 While children secure the continued existence of hunting and gathering communities, there is very little demand for children's labor, and high numbers of children are a burden rather than an asset given the strains of migration. Overall, the limitations imposed by this energetic mode result in very low population growth, not exceeding a long-term average of 0.05% per year. Reference Gignoux, Henn and Mountain61
The transition from a hunting and gathering mode to an agrarian mode would occur first in areas able to sustain a higher population density because of favorable climatic and topographical conditions (such as river basins with secure water supply and rich soils). Given increased population density, hunting-gathering societies may begin to engage in simple types of cultivation to enhance their security of supply. As population density further increases, this becomes a necessity. Those who wish to remain hunter-gatherers are driven toward less productive areas. As will be discussed in section “The agrarian mode”, population density and the fortification of agrarian settlements provides the agrarian population with an advantage over hunting and gathering, Reference Sieferle and Benzig48 as long as the originally favorable conditions in the settled area prevail (Ref. Reference Flannery and Gowdy62). Footnote ‡‡‡
The agrarian mode
The “active solar energy use” Reference Sieferle and Benzig48 of the agrarian mode consists in manipulating terrestrial ecosystems so that they provide a higher return of those kinds of biomass which humans wish to use in their social metabolism. Humans begin to control key parameters of ecosystems such as vegetation cover, elements of the water and nutrient cycles, and by this, create colonized areas in which they concentrate solar energy for the photosynthesis of plants they cultivate.
The development of new technological solutions becomes a key feature of social organization, and determines the environmental impact of agrarian societies. Forested land, wetlands, and drylands are converted into land suitable for cultivation with substantial impacts on the carbon cycle. Agrarian populations share with foragers the technology of food preparation with the help of fire, but by creating fireproof containers (of ceramics, later of metals) they also become able to cook soups and broths. This widens the spectrum of plants used for human consumption and of food essential for smaller children and maybe the elderly. Agrarian societies keep domesticated animals as sources of labor and food and as a means of making extensive use of vast land areas. Keeping livestock has a strong impact on metabolic rates as the nutrition of these animals boosts socioeconomic biomass use. Additionally, the disease vectors of these animals affect the health of humans as well as of wild species, and higher population density allows for the emergence of epidemics which in turn may serve as weapons in the conquest of new territory. Reference Crosby63 Agrarian societies deliberately intervene in the evolution of plants and animals by selectively favoring species variants more appropriate for human use and by seeking to eradicate food competitors. This has an impact on biodiversity loss beyond the pressures resulting from land conversion; however, some gain in biodiversity may also result. These societies create solid, built structures: first, only houses and paths but increasingly also roads, ships, bridges, dams, and urban settlements. The built environment increases the complexity of societal organization. The control over and protection of cropland, tools, livestock, and stored produce is essential under the agrarian mode. Specialized professions of military personnel and administration evolve and organize in increasingly complex social hierarchies. Infrastructures open possibilities for fast transportation and trade across large distances. In many parts of the world, major empires come into being which typically compete with one another and eventually collapse. Reference Diamond64,Reference Tainter65 Agrarian societies mine for minerals and metals. This constitutes a novel (however small) compartment within the metabolic profile, and opens a large spectrum of opportunities for human activities, among them the development of more effective weapons and of coins which function as an economic representation of value. Finally, agrarian populations slowly but continuously advance technologies to intensify their use of land, becoming able to nourish more people on ever-smaller areas, often at the expense of more human labor which substitutes for ecosystem services. Reference Boserup66
The wide range of historical and extant agrarian societies makes overarching characterizations difficult. However, these societies share two features and both functionally relate to their energy system. One feature is the link between energy availability and land, resulting in an elastic but inescapable energy constraint. The other feature is the vicious cycle between land use intensification, increasing human labor burden, and population growth.
Findings from historical reconstructions of biomass use [e.g., Refs. Reference Cussó, Garrabou and Tello67 and Reference Krausmann68], from anthropological field studies [e.g., Ref. Reference Coughenour, Ellis, Swift, Coppock, Galvin, McCabe and Hart69], and from material and energy flow studies of agrarian economies [e.g., Ref. Reference Krausmann, Schandl and Sieferle70] allow us to estimate the range of metabolic rates for the agrarian mode (see Fig. 3). On average, metabolic rates in agrarian modes are 3–4 times higher (both in terms of energy and of material use) than those of hunters and gatherers. Nevertheless, agrarian societies are energetically strongly constrained. The only major source of their energy is land, and working the land requires people for labor. Small elites in agrarian societies may acquire additional riches by conquering and controlling larger territories (or engaging in non-agrarian trades). For the vast majority of the population, the expansion of territory may mean additional security from raids and foreign invasions, but it may also mean the opposite, loss by continuous wars and civil strife. Elites may increase their affluence by increasing the tax burdens on their subjects and tributaries Footnote §§§ but this strategy also has its limits at the subsistence boundary of those who do the agricultural work. Thus, energy affluence in agrarian systems may rise initially when land and biomass are abundant, but does not increase continuously and in the long term.Footnote ****
How is it possible that a technologically dynamic mode of subsistence does not produce growing affluence for its members? The key answer to this question is population growth. As Boserup Reference Boserup66,Reference Boserup72 has convincingly shown, there is a trade-off for increasing area efficiency in agricultural systems: higher labor input and lower labor productivity. In the agrarian socio-metabolic regime, there is both an opportunity and a motive for high fertility. The opportunity is provided by the sedentary mode of living that allows mothers to take care of a large number of children simultaneously and to feed small children from sources other than breast milk, thus allowing for short child spacing. The motivation stems from the insatiable need for labor in agriculture, for both simple tasks which children easily can do (like weeding or looking after small livestock), and for physically demanding tasks that elderly people cannot do anymore and that require more mature children to take over. Footnote †††† In the cultural and religious systems of practically all agrarian societies, high numbers of children within marriage are welcome; contraception and abortion are banned. Simultaneously, social controls are in place to limit the numbers of unsupported or landless children. Sexual relations and childbirth outside of marriage are actively prevented and prerequisites for marriage may be strict (e.g., age, dowry, ability of husband to support family Footnote ‡‡‡‡ ) leading to the creation of substantial population segments for whom celibacy is prescribed. Reference Grigg76 High fertility is welcome within the confines of marriage and land tenure. An additional motivation for fertility may be security: a rural community, comprising an ethnic or religious subgroup, is stronger against outside attacks if it is larger, and has many people who can defend it. If there are external influences that reduce mortality by supplying food and medical assistance without changing the basic functioning of the system otherwise, the problem is aggravated: very high population growth leads to a deterioration of living conditions and makes an eventual transition into another societal mode very difficult. This is not only a historical problem but a development trajectory that can be observed in modern-day countries dependent on development aid. Thus, technological advancement within the agrarian regime tends to be self-defeating in the long term: progress leads into a Malthusian trap.
The Neolithic revolution occurred in spatially distinct locations thousands of years apart. In contrast, the transition from the agrarian to the industrial mode originated in one region, Western Europe, in particular in the United Kingdom (and also to some degree, the Netherlands) and spread across the world from there by trade, technology transfer, imitation, and economic domination within centuries. The initial use of fossil fuels during the 16th century – peat in the Netherlands and then coal in the United Kingdom – primarily provided an opportunity for urban growth. Under the agrarian mode, urban growth, and with it the development of manufacture, trade, and other nonagricultural activities was constrained by at least three factors. i) the generally low agricultural surplus: in Europe, the work of 100 farm families could typically feed 3–10 non-farm families Reference Fischer-Kowalski, Krausmann, Smetschka, Singh, Haberl, Chertow, Mirtl and Schmid71 ; ii) severe constraints to transportation of bulk materials across land Reference Malanima, Kander, Malanima and Warde52,Reference Gerhold77,Reference Grübler78 ; and iii) the lack of fuel wood within reach of population centers, at least in already largely deforested countries such as the United Kingdom and the Netherlands. Thus, the share of urban populations usually remained under 10% (Refs. Reference Goldewijk, Beusen and Janssen79 and Reference Livi-Bacci80). Footnote §§§§ The use of peat and coal removed the constraint of fuel wood. Both countries revolutionized their transport systems by building channels, and accessible urban markets spurred agricultural productivity. Thus, from its very onset, the use of fossil fuels was linked to urban growth and proto-industrialization as well as arts, science and enlightenment long before the steam engine, and with it the industrial takeoff, came into being.
The industrial mode
Initially, the industrial mode was characterized by relatively small adaptions to the new energy source, such as the redesign of human dwellings with iron stoves and brick chimneys for the indoor use of coal. Reference Allen82 Industrialization proper built upon earlier scientific and social advances. Reference Mumford83 In the decades and centuries that followed, a completely new socio-metabolic regime unfolded. We describe its phases, sometimes termed first and second industrial revolution Reference Kander, Kander, Malanima and Warde84 in the following subsections.
The coal revolution: The United Kingdom's head start
The first industrial revolution and the transition to a new energy system were closely linked to positive feedbacks between the use and extraction of coal, the steam engine, iron and steel production, and the transportation system – all of which together constituted a new technology complex. Reference Grübler85 Coal-fired steam engines made it possible to convert heat into mechanical power and by driving water pumps were instrumental in enabling coal mining from increasing depths and reducing the cost of coal extraction. Higher availability of coal enabled strong increases in iron production and the manufacture of steel from 1870 onwards. The transport system was revolutionized by the use of iron, steel, and steam engines in railway trains and steamships.
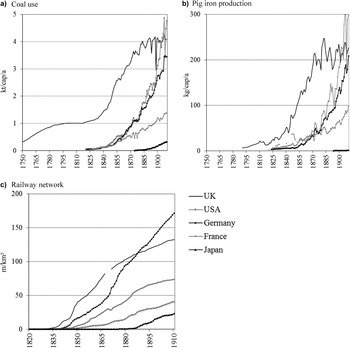
This new technology complex made it possible to extract, transport, and process materials at hitherto unknown rates. As a result, societal metabolism changed significantly. While biomass previously had been the main type of material consumed, now large amounts of coal, construction materials, and ores were added to the metabolic profiles of the industrializing countries. Between 1750 and 1900, the total material use of the United Kingdom, for example, increased from 60 to 400 million tons per year. The United Kingdom's use of coal [Fig. 4(a)] already took off in the mid-18th century and pig iron production [Fig. 4(b)] as well as the extension of the railway network [Fig. 4(c)] followed in the mid-19th century. In other countries, however, the industrial revolution occurred noticeably later. In France, Germany, and the United States of America, for example, coal use did not significantly rise until the mid-19th century, in Japan even not until the late 19th/early 20th century. Compared to the United Kingdom, these countries were “late-comers” to iron production and railway transport as well (Fig. 4).
Coal use (a) in kilotons per capita and year (kt/cap/a) and pig iron production (b) in kilograms per capita and year (kg/cap/a) between 1750 and 1910, and railway network (c) in meters of railway per square kilometer of area (m/km²) between 1820 and 1910 in the UK, the USA, Germany, France, and Japan. Source of data: Ref. Reference Krausmann, Fischer-Kowalski, Singh, Haberl, Chertow, Mirtl and Schmid34.

The use of the “subterranean forest” of coal (see Fig. 2), however, did not remove all the limitations faced by the solar energy system. For nutrition, even industrialized societies depend on access to land for biomass harvest. Due to the marked population growth during the early period of industrialization, demand for food rose. In industrializing societies there was, for the first time in history, a rapidly growing need for nonagricultural workers: The new technical complex and the associated energy system required high amounts of physical labor, especially in final manufacturing. Food was also required for additional livestock: Draught animals had to bridge the transportation gaps in the early, wide-meshed railway system. While demand for fuel wood decreased with the rising use of coal, large amounts of timber went into railway construction, and the emerging paper industry required increasing amounts of pulp. In sum, a high and growing need for biomass (food, feed, wood) and thus for land was maintained in the industrializing societies. Because opportunities to expand the agricultural area or to increase the productivity of the land already under use were limited,Footnote ***** biomass had to be imported from overseas colonies, from North America, and from imperial Russia. Increasingly, colonial expansion into agriculturally productive areas was functionally linked to the socio-metabolic changes in Europe's early industrialization.
In its industrialization, the United States of America did not require colonies but instead continued to push its “frontier” south and west: Once the expansion of the railway system [see Fig. 4(c)] made fertile prairie land accessible to settlers, agricultural opportunities became abound. Between 1850 and 1930, more than 100 million hectares of land, from which the indigenous population and extensive land-use practices had been violently displaced, were converted for agricultural use in the US-American Midwest. Reference Cunfer86 High yields were achieved with low human labor inputs so that a (comparatively) small rural population could not only supply densely populated urban centers on the US-American East Coast with agricultural produce but also provide for significant amounts of exports to Europe.
During this first industrial revolution, a substantial rise in per capita consumption of materials and energy occurred. This, however, did not translate into mass prosperity. Instead, capitalist investments channeled much of the newly gained energy and material affluence into expanding systems of factory production and into production for export. In the growing urban centers, social and environmental conditions worsened as use of coal and population density increased. Reference McNeill87
The oil revolution: The United States' head start
The second industrial revolution, fueled by oil, linked to the emergence of yet another new technology complex: Oil fuels the combustion engine, revolutionizes transport by automobile and airplane, and is the feedstock of the petrochemical industry. Additionally, this phase of industrialization depends on electricity as a new type of energy use. Reference McNeill87
While oil had been used in small quantities (mostly as lamp oil) in the second half of the 19th century, the “oil boom” began at the turn to the 20th century with the discovery of extensive oil fields in Texas. Between 1900 and 1930, US-American oil production rose from less than 10 million to 140 million tons per year (corresponding to 1.2 tons of oil per capita and year). Just as the United Kingdom was at the forefront of the first industrial revolution with its high use of coal, the United States of America dominated global oil production throughout the first half of the 20th century. This role did not shift to the Middle East before the 1960s.
In terms of extraction costs per unit of energy gained, oil was cheaper than coal. Oil has a higher energy density than coal, it is also easier to transport, and it can be used in mobile combustion engines. The latter, in automobiles and airplanes, individualized and greatly increased the speed of human and freight transportation. Following the expansion of the railway network based on coal-fired steam engines, this constituted a second revolution of the transport system within approximately 100 years. At the same time, coal became the main source for a new type of energy supply: electricity. Electricity enabled the mechanization of decentralized types of work via electrical motors. Thus, just as the first industrial revolution did not completely replace biomass with coal, coal was not completely replaced by oil in the second industrial revolution. The thermal energy released during coal combustion remained the basis of steel production and electricity generation. While coal reached peak consumption in the 1920s in the USA and only a few years later in Europe, oil consumption continued to rise and accounted for almost 50% of global TPES by the late 1960s. Reference Krausmann, Fischer-Kowalski, Singh, Haberl, Chertow, Mirtl and Schmid34
In the United States of America, the new system of cheap energy went hand-in-hand with assembly line production and rising working class income, ushering in an era of mass production and consumption, commonly referred to as Fordism. Reference Grübler85,Reference von Gottl-Ottlilienfeld88 Cheap oil and a bundle of technologies coupled to this new energy source also fundamentally altered agricultural production, the last “traditional” economic sector. The tractor allowed for the substitution of all animals and a large portion of human labor. The motor saw increased the speed of tree felling in comparison to the axe by a factor of 100–1000 (and thus enabled rapid deforestation). The agrochemical industry, based on oil and natural gas, helped to lift the chronic limitations on plant nutrients that agriculture was suffering from. From the 1920s onwards, large amounts of atmospheric nitrogen were made available for agricultural use through the Haber–Bosch process which in turn required high-energy inputs. Reference Smil9 Resulting applications of nitrogen in crop farming, industrial potassium and phosphate fertilizers, pesticides, and plant and livestock breeding allowed for the manifold increase of yields and of labor productivity in agriculture. Reference Grigg76 Disseminated by U.S. based agricultural companies active on the global market, these new agricultural methods dissipated around the world as the “green revolution”. Footnote ††††† They spread in Europe after the Second World War and, as a result, the share of the population engaged in agriculture fell to 5% or less. The “green revolution” also influenced the agricultural sectors of economies in the global South. Rising global agricultural output could keep pace with the quadrupling of the world population throughout the 20th century.
In the wake of the second industrial revolution, changes in production, and the experiences with the world economic crisis in the 1930s, induced fundamental changes in consumption. The “American way of life”, whereby everyone is considered to have the potential to rise to riches, found its expression in an aspiration toward high rates of consumption. Material- and energy-intensive goods and services such as automobiles, electrical household appliances, central heating, and meat and dairy products played an increasingly dominant role in the average shopping basket. In Europe and Japan, this transition occurred after the Second World War. Then, in industrialized countries, annual material and energy consumption doubled until 1970 and was linked to a fundamental transformation of the society–nature relationship. Reference Pfister and Uekoetter90 In the last decades, this expansive process spread to the so-called emerging economies 91 which rapidly increased their use of fossil fuels (much of it coal) for the industrial production of commodities for export, and also for their own growing middle classes. Reference Lange and Meier92
A next transition ahead?
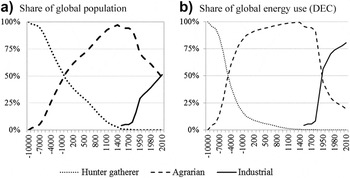
The industrial socio-metabolic mode continues to spread from its origins to the rest of the world. By now, it seems to have captured about half of the world population [see Fig. 5(a)]; in terms of share in global energy use, its share even exceeds three quarters [Fig. 5(b)].
a) Global population share by socio-metabolic mode, 10,000 BC – 2000 AD. Industrial population estimated from urban population. b) Global population share weighted by their primary energy use (DEC). Note: Time axes are not to scale for different periods: −10,000 to 0: 1000 year intervals; 0–1900: 100 year intervals; 1950–2010: 10 year intervals. Source: Ref. Reference Fischer-Kowalski, Krausmann and Pallua49.

Behind this seemingly all-encompassing success of a metabolic regime, there are structural reasons for and even some indications of a next transformation.
Demographic change: Urbanization and low fertility
Two key demographic developments are functionally linked to the industrial socio-metabolic mode: urbanization and transition to low fertility. While the former already became apparent during the early transition to a fossil energy system, the latter, overlaid by migration and coexistence of metabolic modes, is not so readily visible. Almost by definition, life in urban centers is freed from directly working the land for food production although it may be sustained by land rents (as with much of Greek and Roman city inhabitants in antiquity, or feudal landlords). The majority of city inhabitants receive an income from employment outside of food production and procure their food via markets. Under the agrarian mode, only a small share of the total population can be urban Footnote ‡‡‡‡‡ (see section “The agrarian mode”). With the use of fossil fuels, it became possible for a smaller and decreasing rural population to feed a larger (and increasing) urban population, thereby removing the constraint on the size of the urban population. In the industrial mode, food must still mainly be produced in rural areas, while the majority of other activities, which the population engages in, develop in cities and require inputs of fossil energy carriers (and electricity).
The growth of urban populations by far exceeds the growth rate of the total world population, and sometimes, urban growth is held responsible for world population growth altogether. This, we think, is a misconception. The growth of urban centers is not a result of high fertility and low mortality in cities, but a result of migration. Urban centers tend to be a population sink: they attract people from rural areas that then, within one or two generations, change their reproductive behavior toward having fewer children. The Boserupian Reference Boserup66 vicious cycle of needing more children to help with the increased work to satisfy increased food demand does not apply to urban populations. On the contrary, under urban and industrial conditions, the “use value” of children is low from the perspective of parents. Children cost money and time and complicate the organization of daily life of which adults commonly spend the largest part working outside of the home. In the longer run, one or two children are enough to provide the emotional satisfaction associated with child bearing and child rearing. Urban life is not conducive to high fertility rates. In the industrial mode, parents can expect to manage their (longer and healthier) old age on their own and neither wish to nor may expect to depend upon the support from their children. The full process of transformation to mature industrial countries results in a system of very low mortality and even lower fertility rates with a substantial prolongation of generation spacing. Reference Lutz, Sanderson and Scherbov93 In terms of biological reproduction, this is a system of population degrowth Footnote §§§§§ which will lead to a decline of the global world population in the second half of the 21st century, Reference Lutz, Sanderson and Scherbov93 or even before. This mitigating impact of urbanization on population growth is rarely discussed, while a number of studies focus on the impact that increasing rates of urbanization have on global energy use, especially via the consumption patterns in cities [e.g., Refs. Reference Parikh and Shukla95–Reference York97].
The industrial socio-metabolic mode, seemingly having triggered a veritable world population explosion in the past, will be also a major force in containing and reducing population growth.
A saturation of material and energy use in the industrial core countries?
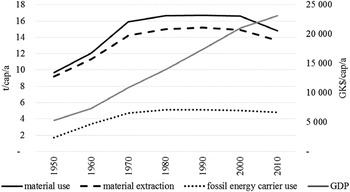
The early 1970s, heralded culturally by the worldwide student protests of 1968, and militarily by the defeat of the US armed forces in Vietnam, can be seen as a turning point for the oil-based socio-metabolic mode shaped decisively by the United States of America (see section “The oil revolution: The United States' head start”), and to mark the beginning of the end of the entailed wasteful approach to natural resource use. Reference Krausmann, Fischer-Kowalski, Singh, Haberl, Chertow, Mirtl and Schmid34 Simultaneously, this period is the start-off of communication and information technologies. These new technologies became prominently intertwined with questions of resource use in 1972 when Meadows and Meadows, Reference Meadows, Meadows, Randers and Behrens98 under the provocative title Limits to Growth, presented the results of a simulation model run on the world's first civilian mainframe computer. The first oil price shock, triggered by the Yom Kippur war, and the peak oil debate (see section “Introduction: Energy use and societal development”) additionally shaped these decisive 1970s. Worldwide, measures were implemented to reduce petroleum use that slowed down energy consumption significantly. From the 1970s onwards, the growth in per capita material and energy extraction and use in the high-income industrial economies markedly declined Reference Wiedenhofer, Rovenskaya, Haas, Krausmann and Fischer-Kowalski99 while per capita gross domestic product (GDP) continued to rise (see Fig. 6). It is not entirely clear why such a saturation occurred and why, in per capita terms, it continues today. For the last two decades, an explanation may lie in the “outsourcing” of material- and energy-intensive production from the high income industrialized to the newly industrializing or “emerging” economies. Accounts of the CO2 or the materials embodied in the goods and services imported by the industrialized countries suggest that this may indeed be the case [e.g., Refs. Reference Peters, Minx, Weber and Edenhofer100 and Reference Wiedmann, Schandl, Lenzen, Moran, Suh, West and Kanemoto101]. At the same time, resource-rich industrialized countries such as Australia and Canada continue to provide the rest of the world and emerging economies especially with primary products, e.g., metals. Between 2000 and 2010, these exports led to a slight convergence of material use and extraction in the Western industrial countries [Fig. 6]. However, neither the recent outsourcing nor the strong export-orientation of individual countries can account for the earlier change in trend.
Per capita material extraction (domestic extraction, DE), material use (domestic material consumption = DE + imports – exports), and fossil energy carrier use in tons per capita and year (t/cap/a) and GDP in international Geary–Khamis dollars per capita and year (GK$/cap/a) in the Western industrial countries between 1950 and 2010. Source of data: Ref. Reference Schaffartzik, Mayer, Gingrich, Eisenmenger, Loy and Krausmann23.

Increasing pressure on resources and take-off of renewable energy
If the per capita level of energy and resource use in the high-income industrial economies were to continue to remain stable and this level was also attained by the remaining two-thirds of the global population which currently have (much) lower use rates, then global annual resource extraction would need to increase threefold by 2050. 91 With regard to food supply, such a scenario of stabilization and convergence appears feasible only if potentially limiting factors such as rising energy costs, water shortages, and soil erosion are disregarded. 102 Concerning freshwater and drinking water reserves, the situation in many regions of the world is already dire [e.g., Ref. Reference Vörösmarty, Green, Salisbury and Lammers103], with the future hanging by the slender threads of climate change. Reference Alcamo, Flörke and Märker104,Reference Milly, Dunne and Vecchia105 Many mineral and metal resources are already subject to declining ore grades Reference Mudd106 and rising prices. In contrast to the 20th century, during which there was a continuous decline in the prices of raw materials, there is now a rising trend of the commodity price index that was only interrupted shortly by the economic crisis of 2008/2009. 107
With respect to technical energy, a global growth scenario as outlined by the United Nations Environmental Programme (UNEP Reference Pfister and Uekoetter90 ) requires returning to the use of coal – a trend that is already ongoing. On the other hand, the so-called unconventional sources of oil and gas must be accessed which requires high financial and energetic investments. “There appears to be general consensus that the occurrence of fossil and fissile energy resources is large enough to fuel global energy needs for many centuries. There is much less consensus as to their actual future availability on the market place”. 40 In the year 2009, out of the annual 528 Exajoules per year (EJ/a) of total primary energy supply (TPES), 78% were met by fossil sources, 5% by nuclear energy, and 17% by renewables. 40 Traditional biomass (i.e., fuel wood) made up the single largest share of these renewables (7.4% out of 17%) – hardly a sign of an energy transition. The next largest share has hydroelectricity (6.1%) – also a fairly traditional source. Thus, on the global level, the share of modern renewable energy sources that could be an indication of a fundamental energy transition amounted to just over 3% in 2009.Footnote ****** At the same time, the shift toward increased use of renewable energy sources is gaining momentum: energy generated from renewable sources has doubled during the last decade; photovoltaic energy even increased by a factor of 60, wind energy by a factor of 20. 40 Changes concerning price levels are even more spectacular. Lauber Reference Lauber108 analyzes the various shifts in policy (non)support for renewable energy internationally and arrives at the conclusion that irrespective of persisting strong policy support for fossil fuels and nuclear energy, electricity generation from renewables is now “in a good position to thrive on all continents” because of a breakthrough in cost-reduction.
Biomass provides the energetic basis of the hunting and gathering and the agrarian mode. Currently, modern biofuels constitute an important political project in many countries. What role can they play in meeting societal energy demand? In 2003, a review was published of studies which had quantified the potential contribution of biomass to primary energy supply by 2050. Reference Berndes, Hoogwijk and van den Broek109 The lowest estimate at that time was 47 EJ/a (Ref. Reference Battjes110) Footnote †††††† while the highest estimate was almost one order of magnitude larger at 450 EJ/a. Reference Fischer and Schrattenholzer111 More recently, potential for biomass-based energy exceeding 1000 EJ/a was identified. Reference Smeets, Faaij, Lewandowski and Turkenburg112 Other authors claim that the higher figures tend to be the result of an overestimation of the land area potentially available for bioenergy production Reference Lambin and Meyfroidt113 and of the yields attainable on the available areas. Reference Haberl, Beringer, Bhattacharya, Erb and Hoogwijk114 In a recent study, it has been argued that additional primary energy supply from all global lands excluding forests cannot exceed 190 EJ/a. Reference Haberl, Erb, Krausmann, Running, Searchinger and Smith115 The range of primary bioenergy potential by 2050 has been narrowed to between 64 and 161 EJ/a. Reference Haberl, Erb, Krausmann, Bondeau, Lauk, Müller, Plutzar and Steinberger116 While biomass therefore could only replace a modest share of fossil energy carriers, “cascade utilization” of residues from agriculture and forestry Reference Haberl and Geissler117 and an integrated optimization of food and energy production would allow to produce more bioenergy without putting food supply at risk [e.g., Ref. Reference Amon, Amon, Kryvoruchko, Machmüller, Hopfner-Sixt, Bodiroza, Hrbek, Friedel, Pötsch, Wagentristl, Schreiner and Zollitsch118].
Conclusions: Is a new energy transition about to take off?
The literature on climate policies explores whether global greenhouse gas emissions can be reduced in time to avoid dangerous climate change. In contrast, this review focuses on the question whether a systemic take-off away from the fossil fuels based energy regime can actually be observed and what socio-ecological implications this would have. Would such an energy transition in any way be comparable to the transition from the agrarian to the industrial socio-metabolic mode, triggering fundamental socio-economic and ecological transformation? In many countries, the transition to the fossil energy system occurred as a process of gradual change until fossil fuels contributed approximately 7% to DEC. After that point, change was very rapid and even took place in conjunction with social revolutions (e.g., United Kingdom in 1642, Germany in 1848, China in 1949). Reference Fischer-Kowalski and Hausknost119 Will a future energy transition be associated with similar social upheaval? We have no conclusive answer to this.
What this review of literature on long-term energy use does demonstrate, however, is that deep-rooted systemic features of the industrial regime have already begun to change. The ongoing global industrial transformation will in all likelihood lead to a decline of the world population within this century (see section “Demographic change: Urbanization and low fertility”) – a remarkable change in the demographic dynamics characterizing humanity so far. In spite of what seems to be a saturation of the core industrialized countries with energy and materials (section “A saturation of material and energy use in the industrial core countries?”), the ongoing global convergence process in energy and resource use levels to the per capita standards of high-income industrial countries will run into planetary boundaries and global supply limitations. The small but highly dynamic contribution of modern renewable energy carriers to current energy use (section “Increasing pressure on resources and take-off of renewable energy”) suggests that they may fuel future societal development in a nonfossil energy system. It can hardly be argued that these observations are conclusive in terms of a pending socio-ecological transition. They do, however, illustrate how unlikely it is that a “business as usual” scenario will remain in place for future global energy use. The industrial socio-metabolic mode (see section “The hunting and gathering mode”) as we know it cannot go on indefinitely. Whether it will end by the depletion of fossil energy carriers, a dramatic transformation of the Earth's climate system or a politically guided sustainability transformation remains an open question. Regardless of how this energetic mode ends, it will have had a much shorter lifespan than the agrarian and the hunting and gathering modes.
The scientific community is no longer contented with providing evidence on the environmental impact of human action. Instead, the need for social change increasingly features on the research agenda, even within the earth sciences. This is reflected in the articulated need for a transition to a low-energy, low-carbon society Reference Schellnhuber, Messner, Leggewie, Leinfelder, Nakicenovic, Rahmstorf, Schlacke, Schmid and Schubert120 or even addressed as the necessary aversion of threats to humankind altogether. Reference Butzer and Endfield121–Reference Spinney123 Historically, new opportunities lay in new energy sources, superior in energy density and cost. The promise of an energy source that might relieve people of demanding physical labor and improve day-to-day living conditions exerted a strong “pull” toward change. Currently, however, such a “superior” new energy source is not in sight.
Steinberger and colleagues Reference Steinberger and Roberts124,Reference Steinberger, Roberts, Peters and Baiocchi125 have demonstrated for a large sample of countries that a high human development index, especially in terms of its life expectancy and education components, has become substantially less dependent on energy affluence during the last three decades. While this may be encouraging in theory, the practical task of fundamentally re-organizing all aspects of society for a low-carbon future has yet to be tackled. In spite of the acute risks associated with climate change, the inertia of the energetic status quo and its perceived advantages currently seem to hinder transformation.
Even if a major shift in the dominant energy sources can be achieved in the next decades, it remains an open question how far-reaching the social and economic consequences of such a shift will be. Will these be on a par with the historical shift to coal? The dominant scientific contributions to the debate, by their sheer choice of research questions, seem to suggest otherwise. The focus on energy efficiency in much of the research related to climate change mitigation, for example, alludes to maintenance or even improvement of current levels of energy services and economic growth. Evidence from historical energy transitions covered in this review makes it hard to believe that the next transition will be a calm, controlled, universally benign event, capable of essentially preserving or improving upon the status quo.