



1. Introduction
Sandstorms, a severe disastrous weather phenomenon of broad concern (Thomas, Knight & Wiggs Reference Thomas, Knight and Wiggs2005; Fenton, Geissler & Haberle Reference Fenton, Geissler and Haberle2007; Kok Reference Kok2010; An, Sin & DuBow Reference An, Sin and DuBow2015; Li et al. Reference Li, Zheng, O'Connor, Xu, Li, Lu, Robinson, Ouyang, Hai and Daily2021), occur frequently in northern China every spring (Xu et al. Reference Xu, Guan, Lin, Luo, Yang, Tan, Wang, Wang and Tian2020). There are at least two different plausible explanations for the causes of sandstorms from the meteorology and hydrodynamics fields. The former models the origin as thermal (buoyancy-driven) turbulence with a high Rayleigh number, which arises when a hot sandy surface encounters a cold front derived from atmospheric circulation (Dai, Williams & Qiu Reference Dai, Williams and Qiu2021; Helfer & Nuijens Reference Helfer and Nuijens2021). The latter models the origin as shear-driven turbulence with a friction Reynolds number ( $Re_{\tau }=u_{\tau }\delta /\nu$, where
 $\delta$,
 $u_{\tau }$ and
 $\nu$ denote the boundary layer thickness, friction velocity and kinematic viscosity, respectively) as high as
 $O(10^6)$, which exhibits strong shearing effects on sandy surfaces and causes large amounts of sand to leave the surface (Smits, McKeon & Marusic Reference Smits, McKeon and Marusic2011; Zhao et al. Reference Zhao, Long, Zhang, Yang, Liu and Liang2020). Previous studies on the dynamic factor of sandstorms have mainly focused on the statistical analysis of turbulence data with steady wind without gusting or sharp changes in the mean flow (Ackerman & Cox Reference Ackerman and Cox1989; Cassisa et al. Reference Cassisa, Simoens, Prinet and Shao2010; Cheng, Zeng & Hu Reference Cheng, Zeng and Hu2011). The general understanding is that the shear turbulence plays a more crucial role than thermal turbulence in sand emission and transport (Zhang et al. Reference Zhang, Zhu, Peng, Kang, Chen and Park2008; Li & Zhang Reference Li and Zhang2012; Zhao et al. Reference Zhao, Long, Zhang, Yang, Liu and Liang2020). However, much less is known about whether this understanding is applicable to the entire sandstorm process, especially to the early and late stages of sandstorms. The early and late stages, regarded as non-stationary flows (Chunchuzov Reference Chunchuzov1994; Kareem et al. Reference Kareem, Hu, Guo and Kwon2019), are the rising stage with a continuously accelerating atmospheric incoming flow and the declining stage with a decelerating flow, respectively.
The discovery of a series of coherent structures that are in some way organized in random and disordered turbulence (Robinson Reference Robinson1991; Jiménez Reference Jiménez2018) was a milestone in related studies in the 1950s. Subsequently, coherent structures, even very-large-scale motions (VLSMs) with streamwise lengths  $L_{x} > 3\delta$, were found to exist in near-neutrally stratified atmospheric surface-layer (ASL) flows, which are similar to those in the turbulent boundary layer (TBL) observed in laboratory testing with pipes (Guala, Hommema & Adrian Reference Guala, Hommema and Adrian2006; Bailey & Smits Reference Bailey and Smits2010; Baltzer, Adrian & Wu Reference Baltzer, Adrian and Wu2013) and channels (Christensen & Adrian Reference Christensen and Adrian2001; Balakumar & Adrian Reference Balakumar and Adrian2007). The VLSMs have also been found in the steady stage of sandstorms, where the wind velocity reaches a plateau after an acceleration process in the rising stage (Liu & Zheng Reference Liu and Zheng2021). These flows are all dominated by shear-driven turbulence (Smits et al. Reference Smits, McKeon and Marusic2011; Jiménez Reference Jiménez2018; Marusic & Monty Reference Marusic and Monty2019). For thermal turbulence, coherent structures with dimensions of the order of the experimental device (Sun, Xi & Xia Reference Sun, Xi and Xia2005; Chong et al. Reference Chong, Huang, Kaczorowski and Xia2015), commonly termed thermal plumes, have also been found in Rayleigh–Bénard convection (Zhou, Sun & Xia Reference Zhou, Sun and Xia2007; Huang et al. Reference Huang, Kaczorowski, Ni and Xia2013; Xie, Ding & Xia Reference Xie, Ding and Xia2018). In most cases, shear and thermal turbulence coexist in ASL flows, which is known as convective ASL flow (Rao & Narasimha Reference Rao and Narasimha2006; Nguyen et al. Reference Nguyen, Horst, Oncley and Tong2013; Ding et al. Reference Ding, Nguyen, Liu, Otte and Tong2018; Salesky & Anderson Reference Salesky and Anderson2018; Tong & Ding Reference Tong and Ding2020). According to the Monin–Obukhov similarity theory, when the potential temperature gradient is negative (i.e. the near-surface temperature is higher than that in the upper layers), the airflow moves upward and the ASL is unstably stratified (Obukhov Reference Obukhov1946; Monin & Obukhov Reference Monin and Obukhov1954). This upward motion of the flow under buoyancy causes the coherent structures to be lifted up from the ground, especially the heads of hairpin vortices (these are aligned coherently in the streamwise direction, creating larger-scale coherent structures, Adrian, Meinhart & Tomkins Reference Adrian, Meinhart and Tomkins2000), resulting in the structures becoming steeper and having a larger inclination with increasing thermal instability (Hommema & Adrian Reference Hommema and Adrian2003; Carper & Porté-Agel Reference Carper and Porté-Agel2004; Chauhan et al. Reference Chauhan, Hutchins, Monty and Marusic2013; Liu, Bo & Liang Reference Liu, Bo and Liang2017; Salesky & Anderson Reference Salesky and Anderson2018; Li et al. Reference Li, Hutchins, Zheng, Marusic and Baars2022). In the stable regime (positive potential temperature gradient), the sinking cold and denser air exhibits a ‘suppressing’ effect, resulting in a decrease in the structure inclination angle (Chauhan et al. Reference Chauhan, Hutchins, Monty and Marusic2013; Liu et al. Reference Liu, Bo and Liang2017). The variation in the spatial length scales of coherent structures with thermal stability has a similar trend to that of the structure inclination; that is, the spatial extent is significantly increased in the unstable regime but reduced in the stable condition (Chauhan et al. Reference Chauhan, Hutchins, Marusic and Monty2010). Recently, Li et al. (Reference Li, Hutchins, Zheng, Marusic and Baars2022) investigated the effect of thermal stability on the aspect ratio (streamwise/wall-normal scales) of self-similar coherent structures using ASL data and found that the aspect ratio becomes progressively smaller as thermal instability increases. In addition to the topology of turbulent coherent structures, thermal stability also leads to significant changes in other flow properties, including the mean velocity profile (Salesky, Katul & Chamecki Reference Salesky, Katul and Chamecki2013; Tong & Ding Reference Tong and Ding2020; Heisel et al. Reference Heisel, Sullivan, Katul and Chamecki2023), the turbulent kinetic energy (TKE) budget and the partitioning of the TKE between its streamwise, spanwise and vertical components (
 $u^2, v^2, w^2$) (Wyngaard & Coté Reference Wyngaard and Coté1971; Frenzen & Vogel Reference Frenzen and Vogel1992; Nilsson et al. Reference Nilsson, Lohou, Lothon, Pardyjak, Mahrt and Darbieu2019; Zou et al. Reference Zou, Li, Huang, Li, Song, Zhang and Wan2020), and the velocity spectra (Kaimal et al. Reference Kaimal, Wyngaard, Izumi and Coté1972; Yadav, Raman & Sharan Reference Yadav, Raman and Sharan1996; Ding et al. Reference Ding, Nguyen, Liu, Otte and Tong2018).
The second-order structure function quantitatively depicts the self-organized state of multiscale turbulent structures (She & Leveque Reference She and Leveque1994; Frisch & Kolmogorov Reference Frisch and Kolmogorov1995). In Rayleigh–Bénard convection, the cumulative TKE of all structures with streamwise length  $L_{x} \leq r$, that is, the second-order structure function
 $S_{2}(r/z)$ (where
 $z$ denotes the wall-normal distance), follows the power law of
 $(r/z)^{2/3}$ (Kolmogorov's two-thirds law) (Frisch & Kolmogorov Reference Frisch and Kolmogorov1995). However, in the shear turbulence, the expression has not only the two-thirds law corresponding to the inertial region of
 $\eta \ll r< z$ (where
 $\eta$ denotes the Kolmogorov microscale), but also a logarithmic scaling law
 $\sim B\ln (r/z)$ (where
 $B$ is the log–linear slope) in the energy-containing region of
 $z< r\ll \delta$ (Perry & Chong Reference Perry and Chong1982). While the scaling for Rayleigh–Bénard convection and wall-bounded shear turbulence has been studied by experiments and numerical simulations, less attention has been paid to scaling in convective boundary layers. Then, in the evolution of sandstorms with both shear turbulence and thermal turbulence, does the second-order structure function in the sand-laden atmospheric turbulence field tend to the scaling law of thermal or shear turbulence? Does this function also evolve with sandstorm development? What are the factors leading to the evolution of the scaling law? We address these aspects in the present work.
Based on field observations of the entire sandstorm process, including the rising, steady and declining stages, this study acquires the turbulent fluctuations by removing the time-varying mean flow from the stationary and non-stationary components of the velocity time series, and then adaptive segmented processing is used to ensure ergodicity. By applying statistical analysis, it is found that the thermal turbulence and the shear turbulence exhibit a competitive evolutionary process with sandstorm development, which leads to a change in the scaling law of the cumulative kinetic energy in the sand-laden atmospheric turbulence. Specifically, during the evolution of the sandstorm, the dominant driving factor transitions from thermal turbulence to shear turbulence, which then attenuates under thermal (gravity) suppression. The structure function follows the logarithmic scaling law, but the scaling parameter gradually decreases from a large value to approach the theoretical result and finally increases slightly again, where the key factors are the accelerated flow and thermal stability of the sandstorm flow rather than the sand particles.
This work is organized as follows: the experimental set-up for the field observations in the particle-laden ASL is described in § 2. Section 3 presents the processing procedure of the sandstorm non-stationary data. After applying the data processing procedure, the flow and particle parameters are provided. The analysis of the evolution of the turbulence driving factors during the entire sandstorm process considering the Monin–Obukhov thermal stability parameter and quadrant distribution is provided in § 4. The difference in the scaling law of the second-order structure function in rising, steady and declining stages of the sandstorm and the individual effects of environmental factors on the scaling law are presented in § 5. The concluding remarks are drawn in § 6. Details of the non-stationary data processing method and a comparison of the results obtained with the non-stationary method and stationary method are provided in Appendix A. Appendix B provides results from another sandstorm data.
2. Acquisition of observational data
The data employed in the present work were derived from observation of a sandstorm starting at 16:00 local time on 14 April 2016 and ending at 06:00 on 15 April 2016 in Northwest China. In addition, to draw general conclusions, more datasets from long-term observations were selected where only one of the parameters are different and the others are similar. The field observations were conducted at an ASL turbulence observatory called the Qingtu Lake observation array (QLOA, detailed in Wang & Zheng Reference Wang and Zheng2016; Liu & Zheng Reference Liu and Zheng2021), which is located in the flat dry bed of the Qingtu Lake and borders the two deserts of Badain Jaran and Tengger in western China (E:  $103^\circ 40^\prime 03^{\prime \prime }$, N:
 $39^\circ 12^\prime 27^{\prime \prime }$). This area has a flat sandy surface and is perennially dry and rainless, with no vegetation covering the ground. The QLOA is composed of a 32 m high main tower and 23 lower towers that are 5 m in height, which are arranged in similar orientations according to Cartesian coordinates. There are 11 towers along the northwest direction (prevailing wind direction,
 $x$-axis) and 6 spanwise towers (
 $y$-axis) on the left and right sides of the main tower (
 $z$-axis). Thus, the QLOA can perform synchronous multipoint measurements of the wind velocity, temperature and sand concentration in a spatial domain of 390 m, 60 m and 32 m in the streamwise, spanwise and vertical directions and is regarded as one of the two notable field stations for the study of TBLs at the atmospheric scale by Heisel et al. (Reference Heisel, Dasari, Liu, Hong, Coletti and Guala2018). The three components of wind velocities and the temperature were measured using sonic anemometers (CSAT3B, Campbell Scientific) at a sampling frequency of 50 Hz. The PM10 (particles with diameters
 $\le 10\,\mathrm {\mu }\mathrm {m}$) concentration was measured by an aerosol monitor (DUSTTRACK II-8530-EP, TSI Incorporated) with a sampling frequency of 1 Hz. The multi-physical quantity data used in this study were acquired at eleven heights spaced logarithmically from 0.9 m to 30 m (
 $z = 0.9$, 1.71, 2.5, 3.49, 5, 7.15, 8.5, 10.24, 14.65, 20.96 and 30 m). Details of the measurements of the wind velocity and the sand concentration in wind-blown sand flows/sandstorms can be found in Liu, Shi & Zheng (Reference Liu, Shi and Zheng2022).
After applying wind direction correction to the raw flow field data (Wilczak, Oncley & Stage Reference Wilczak, Oncley and Stage2001), the actual streamwise, spanwise and vertical velocity time series ( $U, V, W$) were acquired and are shown in figure 1(a–c). Figure 1(a) shows that the streamwise velocity of the sandstorm undergoes an initial rapid increase to a plateau and then a rapid decrease. Thus, the sandstorm can be divided into rising, steady and declining stages with durations of approximately 3, 5 and 6 h, respectively. To check the stationarity, the non-stationary index
 $IST$ of streamwise velocity signals
 $U(t)= \{ u_1,u_2,\ldots,u_N \} = \{ U_1(\Delta t),U_2(\Delta t),\ldots,U_n(\Delta t) \}$ is calculated as (Foken et al. Reference Foken, Gockede, Mauder, Mahrt, Amiro and Munger2004)
 \begin{equation} IST=\left|\left(CV_{m}-CV\right) / CV\right| \times 100\,\%, \end{equation}
where  $CV_{m} =(\sum _{i=1}^{n} C V_{i})/n$ is the mean of
 $CV_{i}$,
 $CV_i$ is the local variance of each segment
 $U_i(\Delta t)$, and
 $CV$ is the overall variance of
 $U(t)$. For example, for hourly streamwise velocity time series,
 $\Delta t = 5\,{\rm min}$,
 $n=12$ and
 $CV$ is the overall variance for 1 h (standard practice in the analysis of ASL data, Wyngaard Reference Wyngaard1992). The
 $IST$ measures data non-stationarity by comparing the overall variance (
 $CV$) and the average local variance (
 $CV_m$) of the selected signal, which expresses the ‘relative size of the error’ of the local variance in relation to global variance. The resulting hourly
 $IST$ in the entire sandstorm process is shown by a blue line in figure 1(a). According to the stationary data condition of
 $IST < 30\,\%$ proposed in Foken et al. (Reference Foken, Gockede, Mauder, Mahrt, Amiro and Munger2004), it is determined that the velocity signal of the sandstorm is wide-sense stationary (Koralov & Sinai Reference Koralov and Sinai2007) in the steady stage, but non-stationary in both the rising and the declining stages. In addition, the synchronously measured time series of PM10 dust concentration and temperature at the corresponding height are plotted in figure 1(d,e), where the green line in figure 1(e) is the Monin–Obukhov thermal stability parameter calculated by the fluctuating vertical velocity and temperature after applying the data processing procedure and is further discussed in § 4.
Synchronous measurement data and related parameters at a height of  $z = 5$ m over the entire sandstorm process. (a–c) Streamwise, spanwise and vertical wind velocities (denoted by
 $U$,
 $V$ and
 $W$), where the blue line is the non-stationary index
 $IST$; (d) PM10 dust concentration (
 $C$); (e) red line showing the ambient temperature
 $\theta$ and green line showing the Monin–Obukhov thermal stability parameter (
 $z/L$).

3. Processing of observational data
3.1. Non-stationary data processing method
To obtain the turbulence signals of ASL flows, there are two widely used methods to remove the mean flow. For the steady case, the arithmetic mean of a fixed length velocity time series is usually taken as the mean flow, where the averaging interval of 1 h is widely adopted (Hutchins et al. Reference Hutchins, Chauhan, Marusic, Monty and Klewicki2012; Wang & Zheng Reference Wang and Zheng2016; Liu, He & Zheng Reference Liu, He and Zheng2023). For non-stationary cases, empirical mode decomposition (EMD) (Huang et al. Reference Huang, Shen, Long, Wu, Shih, Zheng, Yen, Tung and Liu1998) is usually employed to decompose the velocity time series. The intrinsic mode functions (IMFs) and residual term with periods greater than 1 h are taken as the mean flow because fluctuations of period 1 h or less are considered turbulence, while the slower fluctuations are considered part of the mean field (Wyngaard Reference Wyngaard1992). Using these two methods to extract the mean flow in figure 1(a), it is found that, for the steady stage of the sandstorm, the results are basically the same, being constant with time, while there is a significant difference between these two methods in the rising and declining stages. The mean flow extracted by EMD exhibits remarkable time-varying characteristics (see figure 8a in Appendix A). This provides further evidence that the rising and declining stages of the sandstorm involve typical non-stationary flows caused by sharp changes in the atmospheric incoming flow. The stationary method for calculating the steady incoming flow is not appropriate for the non-stationary process.
To perform statistical analysis, it is necessary to divide the turbulence fluctuations extracted by removing the time-varying mean flow in the sandstorm into several segments satisfying the stationarity conditions. Different from the usual segmentation of atmospheric flow with a fixed interval length, an adaptive segmentation method is employed in this study (Liu et al. Reference Liu, Shi and Zheng2022). First, the period of the minimum segment is estimated according to the characteristic time of typical energetic eddies in the outer region of the wall-bounded turbulence, i.e.  $\Delta t = 10\delta /U_{c}$ (where
 $U_{c}$ is the convection velocity taken as the local mean). Then, the adaptive segmented length of interval
 $\Delta T_{i}=(N_{i}-1)\Delta t$, in which
 $N_{i}= 1,2,\ldots$, is determined by checking the stationarity and statistical convergence of the divided segment of data. After applying the adaptive segmentation procedure to the turbulence signals extracted by removing the time-varying mean (non-stationary method), the interval of each segment of the present sandstorm data is 45, 40, 55 and 40 min in the rising stage, and 25, 30, 45, 20, 25, 30, 35, 45, 35, 25 and 45 min in the declining stage. In addition, different degrees of overlap can be set between two adjacent segments to increase the continuity of evolution. The statistical convergence of each segment is confirmed in figures 9 and 10 in Appendix A.
The statistical results, such as turbulent intensity and pre-multiplied energy spectra, obtained with the non-stationary method agree well with those obtained with the stationary method in the steady stage of the sandstorm, suggesting that the non-stationary data processing method can also be applied to stationary data analysis. However, in the rising and declining stages, there are significant differences between the results obtained with the non-stationary and stationary methods (see figures 11–13 in Appendix A). On the one hand, quantitatively, the stationary method overestimates the low-frequency turbulence intensity of the sandstorm, the scale and the kinetic energy fraction of the VLSMs. This is because the stationary method does not remove the gusting or sharp changes in the mean flow, leading to the higher low-frequency energy of the non-stationary system. On the other hand, qualitatively, the stationary method misjudges the attenuation of the structure scale as increasing in the declining stage since the residual gusting or drastic change in the mean field masks the turbulence attenuation in the actual sandstorm decline process.
3.2. Two-phase flow parameters
The friction Reynolds number  $Re_{\tau }$ is widely used in wall-bounded turbulence and is defined as the ratio of the outer scale
 $\delta$ to the inner viscous scale
 $\nu /u_{\tau }$, i.e.
 \begin{equation} Re_{\tau} = \frac{\delta u_{\tau}}{\nu}. \end{equation}
The friction velocity  $u_{\tau }$ is calculated as
 $u_{\tau }=\sqrt {-(\overline {uw})}$ following Hutchins et al. (Reference Hutchins, Chauhan, Marusic, Monty and Klewicki2012) and Li & Neuman (Reference Li and Neuman2012), where
 $u$ and
 $w$ are the fluctuating streamwise and vertical velocities at
 $z = 2.5$ m, respectively, and the overbar denotes the time average. The kinematic viscosity
 $\nu$ is estimated based on the barometric pressure and the temperature at the observation site (Tracy, Welch & Porter Reference Tracy, Welch and Porter1980). The ASL thickness
 $\delta$ is reasonably adopted as 150 m based on the measurements made with Doppler lidar (Liu et al. Reference Liu, He and Zheng2023).
The thermal stability of the data during the sandstorms can be characterized by the Monin–Obukhov stability parameter, which is given as
 \begin{equation} z/L={-}\frac{\kappa z g \overline{w \theta^{\prime}}}{\bar{\theta} u_{\tau}^{3}}, \end{equation}
where  $\kappa = 0.41$ is the Kármán constant,
 $g$ is the gravity acceleration,
 $w$ and
 $\theta ^{'}$ are the fluctuating vertical velocity and temperature after removing the time-varying mean, respectively,
 $\overline {w \theta ^{\prime }}$ is the average vertical heat flux obtained by the covariance between
 $w$ and
 $\theta ^{'}$ and
 $\bar {\theta }$ is the average temperature.
The particle mass loading  $\varPhi _{m}$ is estimated based on the average PM10 dust concentration
 $\bar {C}$ and the percentage of PM10 (denoted by
 $P_{d\le 10\,\mathrm {\mu }\mathrm {m}}$) in all sand particles with different sizes (detailed in Liu et al. Reference Liu, He and Zheng2023), i.e.
 \begin{equation} \varPhi_{m} = \frac{\varPhi_{m}^{P M 10}}{P_{d \leq 10\,\mathrm{\mu} \mathrm{m}}} = \frac{\bar{C} }{\rho _{f} P_{d\le 10\,\mathrm{\mu}\mathrm{m}}}, \end{equation}
where  $\rho _{f}\approx 1.26 \,\mathrm {kg}\,\mathrm {m}^{-3}$ is the air density, and
 $\varPhi _{m}^{P M 10}$ is the average mass loading of particles with sizes less than
 $10\, \mathrm {\mu }\mathrm {m}$ (i.e. PM10 mass loading). The average PM10 dust concentrations
 $\bar {C}$ evolving over time at different heights are plotted in figure 2(a). The sand particles were collected at different heights (
 $z$ = 0.9, 2.5, 5, 8.5, 10.24, 14.65, 20.96 and 30 m) during the sandstorm, and the particle size distribution is acquired through analysing these collected sand particles with a commercial standard sieve analyser (MicrotracS3500) (Liu et al. Reference Liu, He and Zheng2023). The resulting particle size distribution is shown in figure 2(b), and
 $P_{d\le 10\,\mathrm {\mu }\mathrm {m}}$ at all eight heights is shown in figure 2(c).
(a) Evolution of average PM10 dust concentration  $\bar {C}$ over time during the sandstorm process at different heights. (b) Sand particle size distribution at different heights, where
 $N_d$ is the number of sand particles with diameter
 $d$ and
 $N$ is the total number of sand particles with different sizes. (c) Variations in percentage of PM10 (
 $P_{d\le 10\,\mathrm {\mu }\mathrm {m}}$, shown by black squares) and average sand particle size (
 $\bar {d}_{p}$, shown by blue circles) with height.

The Stokes number  $St$ represents the relative strength of inertia and diffusion of particles, which is defined as the ratio of the particle relaxation time
 $\tau _{p}$ to the fluid characteristic time. When the fluid characteristic time is taken as the Kolmogorov time scale
 $\tau _{\eta }$, the corresponding
 $St_{\eta }$ is given as
 \begin{equation} St_{\eta } = \frac{\tau_{p}}{\tau_{\eta}}. \end{equation}
The particle relaxation time  $\tau _{p}$ can be estimated as (Wang & Stock 1993)
 \begin{equation} \tau_{p} = \frac{\rho_{p} \bar{d}_{p}^{2}}{18 \rho_{f} v}, \end{equation}
where  $\rho _{d}\approx 2650 \,\mathrm {kg}\,\mathrm {m}^{-3}$ is the particle density and
 $\bar {d}_{p}$ denotes the average sand particle size at each height (as shown in figure 2c). The Kolmogorov time scale
 $\tau _{\eta }$ is calculated as (Pope Reference Pope2000)
 \begin{equation} \left. \begin{gathered} \tau_{\eta} = \frac{\eta^{2}}{\nu} ,\\ \eta^+ = \left(\kappa z^+\right)^{1 / 4}, \end{gathered} \right\} \end{equation}
where  $\eta$ is the Kolmogorov length scale (microscale) and ‘
 $+$’ represents the inner-flow scaling normalized with the viscous scale
 $\nu /u_{\tau }$, i.e.
 $\eta ^+ = \eta u_{\tau }/ \nu$ and
 $z^+ = z u_{\tau } /\nu$. Similarly, when the fluid characteristic time is taken as the viscous time scale
 $\nu / u_{\tau }^{2}$, the corresponding
 $St^+$ is given as
 \begin{equation} St^+ = \frac{\tau_{p} u_{\tau }^{2}}{\nu}. \end{equation}
The resulting key fluid and particle parameters related to the particle-laden flow at different stages of the sandstorm are listed in table 1.
Key two-phase flow parameters relating to the sandstorm data. Here,  $\bar {U}$ and
 $\bar {\theta }$ denote the local average velocity and average temperature at 5 m a height; and
 $d_{p}/ \eta$ represents the scale ratio of particles to fluid. The results estimated at
 $z = 5$ m is provided herein for parameters relating to the height.

4. Evolution of driving factors in the sandstorms
The ASL is a typical convective boundary layer in which the shear turbulence and thermal turbulence coexist (Rao & Narasimha Reference Rao and Narasimha2006; Nguyen et al. Reference Nguyen, Horst, Oncley and Tong2013; Ding et al. Reference Ding, Nguyen, Liu, Otte and Tong2018; Salesky & Anderson Reference Salesky and Anderson2018; Tong & Ding Reference Tong and Ding2020). The relative magnitudes of the thermal buoyancy and shear terms can be characterized by the Monin–Obukhov stability parameter  $z/L$ defined in (3.2). The Monin–Obukhov length
 $L$ is often interpreted as the height at which the buoyancy-induced TKE budget (increasing,
 $L < 0$ or consuming,
 $L >0$) is equal to the TKE produced by shear (Obukhov Reference Obukhov1946; Monin & Obukhov Reference Monin and Obukhov1954; Businger & Yaglom Reference Businger and Yaglom1971; Metzger, McKeon & Holmes Reference Metzger, McKeon and Holmes2007; Chamecki et al. Reference Chamecki, Dias, Salesky and Pan2017; Tong & Ding Reference Tong and Ding2020). Based on the Monin–Obukhov length
 $L$, the thermal stability of the ASL can be labelled as unstable (
 $L<0$), neutral (
 $| L | \to \infty$) and stable (
 $L>0$) stratification. In practice, the ASL with
 $|z/L| \ll 1$ is considered to be a near-neutral condition. A value of 0.1 is a threshold commonly used to define near-neutral conditions where turbulence is dominated by shear and the effect of buoyancy can be neglected (Högström Reference Högström1988; Högström, Hunt & Smedman Reference Högström, Hunt and Smedman2002; Metzger et al. Reference Metzger, McKeon and Holmes2007; Hutchins et al. Reference Hutchins, Chauhan, Marusic, Monty and Klewicki2012; Liu, Wang & Zheng Reference Liu, Wang and Zheng2018; Emes et al. Reference Emes, Arjomandi, Kelso and Ghanadi2019; Ayet & Katul Reference Ayet and Katul2020). The unstable stratification condition is
 $z/L < -0.1$, where the effect of buoyancy needs to be taken into account and becomes stronger as the thermal instability increases, and the stable condition is
 $z/L > 0.1$, where shear turbulence is suppressed.
The Monin–Obukhov stability parameter  $z/L$ during the entire sandstorm process in figure 1(e) shows that
 $z/L$ evolves from values less than zero to near zero and then to greater than zero as the sandstorm develops. This indicates that the thermal turbulence is strong in the rising stage of the sandstorm due to the large temperature difference between the air flow of the cold front transit and the warm air at the surface. Over time, the temperature of the upper and lower layers of air gradually mixes evenly, leading to a weakened thermal convection in the steady stage. Finally, in the declining stage, the cold and denser air settles to the surface and the atmosphere is transformed into a stable stratification.
Quadrant analysis is a simple, but quite useful, data-processing technique in the exploration of shear turbulence (Wallace Reference Wallace2016). Thus, to reveal the evolution of the shear-driven turbulence in the sandstorm, figure 3(a–c) shows the quadrant analysis of the streamwise and vertical velocity fluctuations in three stages of the particle-laden sandstorm flows. The distribution range and uniformity in each quadrant change with sandstorm evolution. The distribution range of the fluctuating velocity represents the amplitude, and thus a measure of the TKE. Therefore, figure 3(a–c) suggests that the sandstorm exhibits a larger TKE in the rising stage because of the superposition of the buoyancy-driven turbulence caused by the strong thermal instability, a slightly reduced TKE in the steady stage since sand emission and transport consume some of the system energy, and a distinctly attenuated TKE in the declining stage due to the suppressed turbulent motions by gravity under stable stratification conditions. In addition, the vortex generated by the shear (hairpin vortex or quasi-streamwise vortex in Townsend Reference Townsend1976) causes the lower velocity fluids to throw up and the higher velocity fluids to sweep down (‘ejection’ and ‘sweep’ events in Jeong et al. Reference Jeong, Bae, Lee and Kim1997), leading to the streamwise and vertical fluctuating velocities generally distributing over the  $Q_2$ and
 $Q_4$ quadrants. Therefore, the relatively uniform quadrant distribution implies weak shear-driven turbulence in the rising stage; the distinct tilt toward the
 $Q_2$ and
 $Q_4$ quadrants in the steady stage suggests enhanced ‘ejection’ and ‘sweep’ events and thus strong shear-driven turbulence; and the weakened tilt in the declining stage indicates attenuated shear turbulence.
Quadrant distributions of the streamwise and vertical velocity fluctuations ( $u$,
 $w$) in different stages of the sandstorm at 5 m height (dot symbols), and the corresponding joint probability density function
 $P(u, w)$ (white lines). (a) Rising stage, (b) steady stage, (c) declining stage. The evolution of (e) the probability of each quadrant event
 $N_{Q_i}/N_{total}$, (e) the intensity of contributions to the Reynolds shear stress of each quadrant event
 $\overline {uw}_{Q_i}/\overline {uw}$ and the Reynolds shear stress
 $\overline {uw}$ with time during the sandstorm. Further evidence from the results of another sandstorm is provided in figure 14 in Appendix B.

Despite the scatter plots of streamwise and vertical fluctuation distributions being visualized for analysing quadrant events, the Reynolds shear stresses cannot be easily estimated. Therefore, to quantitatively analyse the contribution of the quadrant events to the Reynolds shear stress, the evolution of the probability and intensity of each quadrant event are shown in figure 3(d,e), and the total Reynolds shear stress ( $\overline {uw}$) is also plotted in figure 3(e). The probability is given as
 $N_{Q_{i}}/{N_{total}}$, where
 $N_{Q_{i}}$ is the number of corresponding quadrant event and
 $N_{total}$ is the total number of all quadrant events, which represents the occurrence frequency of each quadrant events. The intensity is calculated as
 $\overline {uw_{Q_{i}}}/\overline {uw}$, where
 $\overline {uw_{Q_{i}}}$ is the Reynolds shear stress generated by each quadrant events and
 $\overline {uw}$ is the total Reynolds shear stress. At the beginning of the sandstorm, although the intensity of each quadrant event is significant, the probabilities are nearly equal, which results in a small total Reynolds shear stress (as shown by the solid pink line), implying weak shear-driven turbulence in the rising stage. With the development of the sandstorm, the intensities of the four quadrant events decrease, but the probabilities of the ‘ejection’ and ‘sweep’ events reflected by the
 $Q_2$ and
 $Q_4$ quadrants increase and those reflected by the
 $Q_1$ and
 $Q_3$ quadrants decrease, which results in a higher Reynolds shear stress, indicating the shear-driven turbulence is enhanced. After full sandstorm development, both
 $N_{Q_{i}}/N_{total}$ and
 $\overline {uw_{Q_{i}}}/\overline {uw}$ are constant in the steady stage. The probabilities of the four events are approximately 0.19 for
 $Q_1$, 0.30 for
 $Q_2$, 0.20 for
 $Q_3$ and 0.31 for
 $Q_4$. This agrees well with the
 $N_{2}/N_{total} \approx N_{4}/N_{total}\approx 0.29$ result previously documented in Katul et al. (Reference Katul, Kuhn, Schieldge and Hsieh1997) and
 $N_{2}/N_{total} = 0.296$,
 $N_{4}/N_{total} = 0.314$ results reported by Li & Bo (Reference Li and Bo2019). The contributions of different quadrant events to the Reynolds shear stress (
 $Q_1$,
 $-$0.31;
 $Q_2$, 0.87;
 $Q_3$,
 $-$0.30;
 $Q_4$, 0.75) are significantly larger than the low-Reynolds-number results (
 $Q_1$,
 $-$0.1;
 $Q_2$, 0.66;
 $Q_3$,
 $-$0.11;
 $Q_4$, 0.52, Nagano & Tagawa Reference Nagano and Tagawa1988), but have a same overall trend, i.e.
 ${Q_2} > {Q_4} > {Q_1} \approx {Q_3}$. During the declining stage, as the sandstorm attenuates, although the intensities hardly change, the probabilities of
 $Q_3$ and
 $Q_4$ are closer, resulting in a decrease in the total Reynolds shear stress; that is, the shear-driven turbulence is weakened. It is noted that the seemingly constant probability from the 11th to 13th hour in the declining stage is attributed to the temporary maintenance of wind velocity, as shown in figure 1(a).
In summary, this section indicates that, over the entire sandstorm process, the driving factors evolve from buoyancy-driven thermal turbulence predominating in the rising stage to weakened thermal turbulence but dominant shear-driven turbulence in the steady stage and then to suppressed turbulent motion by enhanced thermal stability.
5. Evolution of the cumulative TKE scaling law in the sandstorms
From the evolution of the driving factors in the sandstorm, it is inferred that the dynamic process of turbulent structures; that is, the generation of primary vortices by kinetic bursts, being stretched into hairpin vortices, aligning coherently to create hairpin vortex packets and thus large- and very-large-scale structures (Townsend Reference Townsend1976; Kim & Adrian Reference Kim and Adrian1999; Adrian et al. Reference Adrian, Meinhart and Tomkins2000), reflected by the ‘ejection’ and ‘sweep’ events in the sand-laden flow change over the different sandstorm stages. To explore the effects of changes in the turbulence driving factors on scaling, this section shows the evolution of the second-order structure function during the sandstorm process.
The second-order streamwise velocity structure function is defined as the second-order statistical moment of the streamwise velocity increment with distance  $r$, i.e.
 \begin{equation} S_{2, u}(r) = [u(x)-u(x+r)]^2 , \end{equation}
which represents the cumulative energy of eddies of size  $r$ and less (Davidson, Krogstad & Nickels Reference Davidson, Krogstad and Nickels2006a) and exhibits four scaling ranges (Davidson, Nickels & Krogstad Reference Davidson, Nickels and Krogstad2006b; de Silva et al. Reference de Silva, Marusic, Woodcock and Meneveau2015),
 \begin{equation} S_{2, u}(r) =
\left\{\begin{array}{@{}ll@{}} z^+(r / z)^{2}/(15 \kappa), & 0< r
\leq \eta ,\\ M_{2}(r / z)^{2 / 3}, & \eta \ll r < z ,\\
A+B \ln (r / z), & z< r \ll \delta ,\\ C-D \ln (\delta /
z), & r \sim \delta . \end{array} \right.
\end{equation}
At dissipative scales, there is a near balance between the turbulent production ( $P$) and dissipation (
 $\epsilon$) rates. In the inertial subrange (
 $\eta \ll r < z$), the scaling behaviour is local isotropy, and the expression of the second-order structure function corresponds to Kolmogorov's two-thirds law. At scales
 $z < r \ll \delta$ (energy-containing region), the second-order structure function is dominated by inertial-scale eddies and follows logarithmic law. At a scale comparable to the boundary layer thickness, the second-order structure function becomes a constant. In the outer region of the high-Reynolds-number wall turbulence, the very-large-scale coherent structures are dominant. Therefore, the logarithmic behaviour in the energy-containing region is specifically concerned in this study.
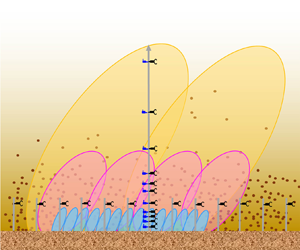
According to the Townsend's attached eddy hypothesis (shown as the schematic in figure 4), the flow in the logarithmic layer is filled with wall-attached eddies. Here, the velocity is defined as the sum of the attached-eddy-induced velocity increments (Yang et al. Reference Yang, Baidya, Johnson, Marusic and Meneveau2017; Xie et al. Reference Xie, de Silva, Baidya, Yang and Hu2021), i.e.
 \begin{equation} u(z) = \sum_{i = 1}^{N_{z}} a_{i}, \end{equation}
where  $u(z)$ is the instantaneous streamwise fluctuation at a distance
 $z$ from the wall in the logarithmic layer,
 $a_{i}$ is the
 $\delta /2^{i}$-sized attached-eddy-induced streamwise velocity. The number of wall-attached eddies that contribute to
 $u(z)$ equals the integral from
 $z$ to
 $\delta$ of the eddy population density
 $P(z)$; that is,
 $N_{z}=\int _{z}^{\delta } P(z) \,\textrm {d} z$. Because the sizes of the wall-attached eddies scale as their distances from the wall,
 $P(z)$ is inversely proportional to the distances from the wall
 $z$, i.e.
 $P(z) \sim 1 / z$.
A schematic of the attached eddies. The two points are at a distance  $z$ from the wall and are displaced by a distance
 $r$ in the streamwise direction.

The streamwise velocity difference between two points with distance  $r$ is written as
 \begin{equation} u(x, z)-u(x+r, z) = \sum_{i = 1}^{N_{z}}\left(a_{i}-a_{i}^{\prime}\right)\!. \end{equation}
A large-scale attached eddy (coloured yellow in figure 4) contributes the same increment to both the two points and a small-scale attached eddy (coloured blue in figure 4) contributes to neither. Thus, the velocity difference with distance  $r$ only contains contributions from intermediate-sized eddies (coloured carmine in figure 4)
 \begin{equation} u(x, z)-u(x+r, z) = \sum_{i = N_{r}}^{N_{z}}\left(a_{i}-a_{i}^{\prime}\right),\quad N_{r} \sim \ln (\delta / r), \end{equation}
where  $N_r$ is the number of wall-attached eddies that contribute to
 $u(z)$ but their size less than
 $r$. Then, a logarithmic scaling of the second-order structure function can be obtained by squaring both sides of (5.5) and taking the ensemble average
 $$\begin{gather} \left\langle[u(x, z)-u(x+r, z)]^{2}\right\rangle \sim\left(N_{z}-N_{r}\right)\left(\left\langle a_{i}^{2}\right\rangle+\left\langle a_{i}^{\prime 2}\right\rangle-2\left\langle a_{i} a_{i}^{\prime}\right\rangle\right)\nonumber\\ \sim\left(N_{z}-N_{r}\right)\big(\big\langle a^{2}\big\rangle-\left\langle a a^{\prime}\right\rangle\big) \sim N_{z}-N_{r} \sim \ln (r / z); \end{gather}$$
that is
 \begin{equation} \left\langle[u(x, z)-u(x+r, z)]^{2}\right\rangle = A+B \ln (r / z). \end{equation}
In addition, the derivative of the second-order structure function,
 \begin{equation} {\rm d} S_{2, u}(r / z) / {\rm d}(r / z) = B \frac{1}{r / z}, \end{equation}
plays the role of an energy density. The pre-multiplied derivative of the second-order structure function is equal to the parameter  $B$; that is
 \begin{equation} \frac{r}{z} \,{\rm d} S_{2, u}(r / z) / {\rm d}(r / z) = B, \end{equation}
which is a measure of the kinetic energy of eddies of size  $r$.
Figure 5(a) presents the second-order structure functions of streamwise velocity fluctuations in different stages of the sandstorm, where black lines represent the theoretical formulas based on stationary atmospheric turbulence (de Silva et al. Reference de Silva, Marusic, Woodcock and Meneveau2015; Chamecki et al. Reference Chamecki, Dias, Salesky and Pan2017; Xie et al. Reference Xie, de Silva, Baidya, Yang and Hu2021). The inset plotted results in log–log scales to better assess the power-law behaviour. There are significant differences in the profiles of the structure function among the different stages. In the steady stage, the profile agrees well with the theoretical formulas of the log–linear law in the energy-containing region and the two-thirds power law in the inertial region. However, in the rising and declining stages, the profiles deviate from the theoretical formula, and the degree of deviation in the energy-containing region becomes increasingly significant with increasing structural scale. This may imply that the existing formula based on stationary atmospheric flows is not suitable for scaling the cumulative energy of eddies on different scales in the non-stationary process of the sandstorm. Although the profiles in non-stationary cases are different from the existing formula, there are still intervals following the predicted log–linear behaviour and two-thirds power law. In the inertial subrange ( $r/z < 1$), as shown by the inset in figure 5(a), the profiles of the second-order structure function in log–log scales at different stages are straight, implying a power law. The power-law exponents for the three stages are
 $p = 0.68 \pm 0.04$,
 $0.66 \pm 0.05$ and
 $0.66 \pm 0.04$ by fitting the data, which are in general agreement with
 $p = 2/3$ predicted by the Kolmogorov's two-thirds law (Frisch & Kolmogorov Reference Frisch and Kolmogorov1995), and also match
 $p = 0.68$ for the ASL,
 $p = 0.67$ for a laboratory result (de Silva et al. Reference de Silva, Marusic, Woodcock and Meneveau2015) and
 $p = 0.68 \pm 0.01$ for the Rayleigh–Bénard convection (Sun, Zhou & Xia Reference Sun, Zhou and Xia2006). However, in the energy-containing region (
 $z < r \ll \delta$), the parameter
 $B$ that represents how quickly the cumulative TKE increases with increasing scale (Townsend Reference Townsend1976; Falkovich Reference Falkovich2018) is changed (as shown in figure 5b), where
 $B$ is obtained from the pre-multiplied derivative of the second-order structure function. Figure 5(b) shows that the pre-multiplied derivatives of the second-order structure function (a measure of the kinetic energy of eddies with scale
 $r$, Davidson et al. Reference Davidson, Krogstad and Nickels2006a) vs the streamwise length
 $r/z$ exhibit a plateau at all three stages of the sandstorm, but there are significant differences in the range (representing the interval of the logarithmic law) and magnitude (i.e. the value of
 $B$) of the plateau.
(a) Plots of the second-order structure function of the streamwise velocity fluctuations  $\langle \Delta u^{2+}\rangle$, the inset shows the results at a log–log scale; (b) the corresponding pre-multiplied derivative
 $(r / z)[\textrm {d}\langle \Delta u^{2+}\rangle / \textrm {d}(r / z)]$ vs
 $r/z$ in the rising (red line), steady (blue line) and declining (green line) stages of the sandstorm at a 5 m height, where the plateau magnitude is the value of
 $B$, ‘
 $+$’ denotes the inner scaling,
 $u^{2+}=u^{2} / u_{\tau }^{2}$,
 $\langle {\cdot } \rangle$ denotes the time average, black lines represent the theoretical formulas based on the stationary atmospheric flow,
 $B = 4/3\kappa ^{-2/3} \approx 2.5$ (Chamecki et al. Reference Chamecki, Dias, Salesky and Pan2017; Xie et al. Reference Xie, de Silva, Baidya, Yang and Hu2021),
 $A = 2.95$ and
 $M_{p} = 3.12$ (de Silva et al. Reference de Silva, Marusic, Woodcock and Meneveau2015). The illustration shows the evolution of
 $B$ obtained from the plateau value over time. See figure 15 in Appendix B for the results of another sandstorm.

The plateau range moves left from larger scales of approximately  $z \ll r < \delta$ at the right side in the rising stage to
 $z < r \ll \delta$ in the steady and declining stages, while the plateau magnitude decreases from
 $B = 23.3$ to 2.8 and then increases slightly to 4.8. These changes suggest that in the rising stage of the sandstorm, in addition to the larger size of the energetic structure, the kinetic energy is also stronger because the scales of the convective structures dominated by thermal turbulence are larger and the energy is mainly concentrated in the larger energetic structures. In the steady stage, both the scale and the kinetic energy decrease. This is because shear-driven turbulence is dominant in this case, and the strong shear not only acts on the surface to generate a new small-scale vortex but also breaks up the large convective structure (Hunt & Morrison Reference Hunt and Morrison2000; Liu et al. Reference Liu, Shi and Zheng2022), transferring energy to the small scales and thus reducing the kinetic energy of the energetic structures. Especially in the declining stage, the kinetic energy of the energetic structures is slightly enhanced again, although the further length scale decreases. This may be plausible given that the attenuated shear turbulence, especially suppressed by gravity when stably stratified, is unable to generate more small-scale vortices, so that the larger-scale structures cannot retain their coherence, resulting in a scale reduction and refocusing of the energy on these energetic structures due to the absence of small scales.
Specifically, the evolution of the scaling parameter  $B$ over time in the inset of figure 5(b) shows that
 $B$ decreases rapidly in the rising stage of the sandstorm, remains virtually unchanged in the steady stage and increases slightly in the declining stage. This indicates that the cumulative TKE increases more quickly with increasing scale in the non-stationary stage of the sandstorm than in the stationary stage, even in the declining stage where the velocity attenuates. Given that
 $B = 2.8$ in stationary sandstorm flows is close to
 $B = 2.35{-}3$ in high-Reynolds-number ASL (de Silva et al. Reference de Silva, Marusic, Woodcock and Meneveau2015; Chamecki et al. Reference Chamecki, Dias, Salesky and Pan2017) and
 $B = 2.5$ in laboratory TBL (Davidson et al. Reference Davidson, Krogstad and Nickels2006a,Reference Davidson, Nickels and Krogstadb; de Silva et al. Reference de Silva, Marusic, Woodcock and Meneveau2015) and channel (Katul et al. Reference Katul, Ghannam, Bou-Zeid, Gerken and Chamecki2018; Xie et al. Reference Xie, de Silva, Baidya, Yang and Hu2021) flows at low and moderate Reynolds numbers, it is inferred that the parameter
 $B$ should be independent of the Reynolds number. This is consistent with the conclusion of de Silva et al. (Reference de Silva, Marusic, Woodcock and Meneveau2015) using datasets that span several orders of magnitude in Reynolds number, up to
 $Re_\tau \sim O(10^6)$. Therefore, it is not the Reynolds number, but rather the variability in multiple factors (dust concentration, thermal stability and flow acceleration) during the sandstorm that is responsible for the increase in
 $B$, that is, the more rapid increase in the cumulative TKE with increasing scale.
Sandstorms as a typical wind-blown-sand two-phase flow, the effect of particles on turbulence during sandstorms needs to be considered because the sand concentration changes dramatically. Therefore, figure 6(a) presents the resulting  $B$ at various PM10 concentrations
 $\bar {C}$. In the sandstorm steady stage with small
 $B$, where the acceleration and thermal stability close to zero,
 $B$ remains almost constant even if
 $\bar {C}$ varies by an order of magnitude. This indicates that the cumulative TKE scaling law in the energy-containing region is only minimally affected by sand particles in the sandstorm. In the early rising stage, where
 $\bar {C}$ is close to zero,
 $B$ changes across an order of magnitude, indicating that the flow acceleration and thermal stability may be the factors contributing to the change in
 $B$.
Variations in parameter  $B$ of the logarithmic scaling law with the (a) average PM10 dust concentration
 $\bar {C}$ at different heights, (b) acceleration
 $a$ of the incoming flow and (c) thermal stability parameter
 $z/L$ during the sandstorm. See figure 16 in Appendix B for the results of another sandstorm.

As shown in figure 1(a), in the rising stage, the velocity is increasing and the flow acceleration has a positive value because the local atmosphere gains energy from the cold air mass brought by the cold front. The exhaustion of the energy brought by the cold air mass leads to the reduced wind velocity and flow deceleration in the declining stage. The accelerated flow has previously been confirmed to be a key factor governing turbulence properties. The flow acceleration significantly enhances the near-wall Reynolds shear stresses (Fernholz & Waenack Reference Fernholz and Waenack1998; Piomelli, Balaras & Pascarelli Reference Piomelli, Balaras and Pascarelli2000; Joshi, Liu & Katz Reference Joshi, Liu and Katz2011; Piomelli & Yuan Reference Piomelli and Yuan2013), making the large-scale coherent structures more elongated (Talamelli et al. Reference Talamelli, Fornaciari, Westin and Alfredsson2002). The flow acceleration also reduces the burst frequency (Kline et al. Reference Kline, Reynolds, Schraub and Runstadler1967; Ichimiya, Nakamura & Yamashita Reference Ichimiya, Nakamura and Yamashita1998; Bourassa & Thomas Reference Bourassa and Thomas2009) and thus the number of near-wall cycles (Piomelli et al. Reference Piomelli, Balaras and Pascarelli2000; Joshi et al. Reference Joshi, Liu and Katz2011). Additionally, the acceleration process affects the Kármán constant (Emadzadeh, Chiew & Afzalimehr Reference Emadzadeh, Chiew and Afzalimehr2010; Joshi et al. Reference Joshi, Liu and Katz2011), enhances the turbulence anisotropy (Jung & Chung Reference Jung and Chung2012) and increases the transition Reynolds number (Costantini et al. Reference Costantini, Hein, Henne, Klein, Koch, Schojda, Ondrus and Schröder2016). Therefore, to explore the effects of flow acceleration on the logarithmic scaling law of the second-order structure function, figure 6(b) shows the variation in  $B$ with the flow acceleration (denoted as
 $a$) during the sandstorm process. The flow acceleration
 $a$ represents the changing rate of mean wind velocity and is defined as
 $a = \textrm {d}U/\textrm {d}t$. Here,
 $a$ is estimated from the average changing rate of velocity in the time-varying mean wind flow extracted by EMD in each segment obtained by the adaptive segmentation method. The magnitude of
 $a$ represents how quickly the sandstorm develops from the beginning to the steady stage and from the steady stage to its end. In addition, the flow acceleration indicates the amount of kinetic energy gain from the local synoptic system (such as, cold air mass) during the rising stage. The value of
 $a$ (
 ${\sim }O(10^{-3})$) involved in this study, while seemingly small, represents the development time from the beginning (
 $0\,\textrm {m}\,\textrm {s}^{-1}$) to the steady stage (10–15 m s
 $^{-1}$) of a sandstorm in real nature, which is approximately 3–5 h (approximately 90 % of all 79 sandstorm events with long-term observation), being more rapid than the development time (9 h) of typhoons recorded by Wang et al. (Reference Wang, Wu, Tao, Li and Kareem2016). The overall trend in figure 6(b) suggests an increasingly significant increase in
 $B$ with
 $a$, i.e.
 $B$ remains unchanged when
 $a$ is small, whereas the increase in
 $B$ with
 $a$ is pronounced at a large value of
 $a$. This indicates that the violent acceleration of the flow field changes the energy distribution of the multiscale structures and concentrates the TKE in large-scale energetic structures. Note that the profiles of
 $B$ varying with
 $a$ are not well collapsed. This is because the rising stage is accompanied by changes in thermal stability in addition to acceleration.
Therefore, figure 6(c) plots the change in  $B$ vs the Monin–Obukhov stability parameter
 $z/L$ for all of the sandstorm data. As expected, the variation in
 $B$ with
 $z/L$ is systematic, suggesting that thermal stability is also a key parameter affecting the TKE of energetic structures. Under the near-neutral stratified condition with
 $z/L$ close to zero, the significant change in
 $B$ is caused by the incoming flow that still dramatically changes when
 $z/L$ decreases rapidly to near zero in the rising stage. In the unstable stratified regime with negative
 $z/L$,
 $B$ increases with decreasing stability. This indicates that affected by thermal instability, the kinetic energy of eddies in the energy-containing region is enhanced.
Figure 6 suggests that the turbulent properties are potentially affected by thermal stratification, suspended particles and flow acceleration. However, the three factors vary simultaneously. To disentangle the various effects in a field study, more datasets from long-term observations were selected where only one parameter is different but other parameters are similar, and the results are shown in figure 7. The results obtained from the laboratory experiments (Davidson et al. Reference Davidson, Krogstad and Nickels2006a,Reference Davidson, Nickels and Krogstadb; de Silva et al. Reference de Silva, Marusic, Woodcock and Meneveau2015), the ASL observations (de Silva et al. Reference de Silva, Marusic, Woodcock and Meneveau2015; Chamecki et al. Reference Chamecki, Dias, Salesky and Pan2017; Katul et al. Reference Katul, Ghannam, Bou-Zeid, Gerken and Chamecki2018) and theoretical formulas (Chamecki et al. Reference Chamecki, Dias, Salesky and Pan2017; Xie et al. Reference Xie, de Silva, Baidya, Yang and Hu2021) are also included in figure 7 for comparison. Figure 7(a) considers the effect of only the PM10 dust concentration on parameter  $B$ based on datasets in near-neutral ASLs with steady wind. Although the current ASL results (shown as diamonds) are not well converged (the scatter would be smaller in a controlled laboratory experiment), the overall trend indicates that the parameter
 $B$ does not change significantly with PM10 concentration
 $\bar {C}$ and is generally consistent with the existing laboratory and ASL results. In addition, all of these experimental data fluctuate around the theoretical result shown by the red dashed line. It is predictable that the parameter
 $B$ does not change with
 $\bar {C}$ when the mass loading (
 $\varPhi _{m}$) is smaller than
 $7.78 \times 10^{-4}$ (corresponding average PM10 dust concentration of 1.96 mg m
 $^{-3}$). This condition belongs to the one-way coupling sparse two-phase flow (
 $\varPhi _m < 10^{-3}$) suggested by Elghobashi (Reference Elghobashi1994), Balachandar & Eaton (Reference Balachandar and Eaton2010) and Brandt & Coletti (Reference Brandt and Coletti2022), where the particle effects on turbulence are negligible. The result in figure 7(a) may provide support for the conclusion obtained from figure 6(a).
The effect on parameter  $B$ by the (a) average PM10 dust concentration
 $\bar {C}$; (b) acceleration
 $a$ of the incoming flow, where black solid circles denote the results of accelerating incoming flow and hollow circles are the results of decelerating incoming flow, and the red solid line is the fitting curve for acceleration
 $a > 0$; and(c) thermal stability parameter
 $z/L$, where black and blue squares are the results of unstable and stable surface-layer data, respectively. The black and blue dashed lines are the corresponding fitted curves. In all panels, the red dashed line represents the theoretical formulas based on the stationary atmospheric flow,
 $B = 4/3\kappa ^{-2/3} \approx 2.5$ (Chamecki et al. Reference Chamecki, Dias, Salesky and Pan2017; Xie et al. Reference Xie, de Silva, Baidya, Yang and Hu2021), the red asterisks are the laboratory (LAB) results from Davidson et al. (Reference Davidson, Krogstad and Nickels2006a,Reference Davidson, Nickels and Krogstadb), de Silva et al. (Reference de Silva, Marusic, Woodcock and Meneveau2015) and Chung et al. (Reference Chung, Marusic, Monty, Vallikivi and Smits2015) and the carmine stars are the ASL results from de Silva et al. (Reference de Silva, Marusic, Woodcock and Meneveau2015), Chamecki et al. (Reference Chamecki, Dias, Salesky and Pan2017) and Katul et al. (Reference Katul, Ghannam, Bou-Zeid, Gerken and Chamecki2018).

Figure 7(b) plots the individual effect of flow acceleration on the parameter  $B$ based on datasets in near-neutral sand-free ASL flows. The results of accelerating and decelerating incoming flow are shown by black solid and hollow circles, respectively. As shown by the black solid circles, the effect is remarkable when the velocity is increasing (with a positive acceleration
 $a$); that is, the parameter
 $B$ increases with increasing
 $a$. A parametric equation is fitted to the exponential trend of accelerated flow data to model the variation in
 $B$ with
 $a$ and is given as,
 \begin{equation} B = B_{0}+0.06\exp (3180 a),\quad a\ge 0, \end{equation}
where  $B_{0} = 2.5$ is the theoretical result. When the flow is stationary (with an acceleration of
 $a = 0$), the functional form of the fitted equation (5.10) approaches the invariant value of the parameter
 $B$ and is consistent with the existing results, while it depicts an increasing
 $B$ at high
 $a$. It is well known that the increase in wind velocity is attributed to the local atmospheric system gaining energy from the environment. Energy cascade theory (Richardson Reference Richardson1922) suggests that large-scale turbulence structures transfer kinetic energy gained from the mean flow field to small-scale turbulence structures, and the bispectrum analysis during sandstorm by Liu et al. (Reference Liu, Shi and Zheng2022) suggested that large-scale coherent structures gain energy from nonlinear interactions in the rising stage. Therefore, a higher acceleration
 $a$ indicates that large-scale turbulence structures in the local atmospheric system gain more kinetic energy from the mean flow field, which leads to an increase in
 $B$ because it is a measure of the kinetic energy of large structures in the energy-containing region. Meanwhile, flow acceleration increases the Reynolds shear stress at the near-wall surface (Piomelli et al. Reference Piomelli, Balaras and Pascarelli2000; Joshi et al. Reference Joshi, Liu and Katz2011), resulting in an increase in the velocity gradient and thus the streamwise spacing between different hairpin vortices in the hairpin vortex packet that form the large-scale coherent structure, consequently increasing the scale of the large-scale structure (Adrian et al. Reference Adrian, Meinhart and Tomkins2000; Volino Reference Volino2020). This provided evidence supporting the larger size of the energetic structure in the rising stage of the sandstorm shown in figure 5(b). However, for negative acceleration
 $a$, the effect of decelerated flow on parameter
 $B$ is not significant, as shown by the hollow circles in figure 7(b).
The effect of stratification stability on the parameter  $B$ is shown in figure 7(c) based on sand-free ASL flows with steady wind. As expected, the parameter
 $B$ increases with decreasing stability (increasing
 $-z/L$), and the variation follows an approximately linear increase in the unstable regime, as shown by black squares. Under stable conditions, a few cases show a slight linear increase in the parameter
 $B$ with increasing stability, as shown by blue squares. In the near-neutral ASL, the parameter
 $B$ results agree well with the existing results shown by red asterisks, carmine stars and red dashed lines in figure 7(c). The linear trend is fitted by an empirical correlation to model the variation in the parameter
 $B$ with
 $z/L$ and is given as
 \begin{equation} B = \left\{\begin{array}{@{}ll@{}} B_{0}+1.03 z / L, & z / L \geq 0, \\ B_{0}-9.42 z / L, & z / L<0. \end{array}\right. \end{equation}
The self-organized state of multiscale turbulent structures shows a stronger response to unstable conditions than to the stable conditions. A probable interpretation is that buoyant currents shred the synoptic-scale structures into large turbulence structures and further break those structures into small-scale structures (Hunt & Morrison Reference Hunt and Morrison2000; Lotfy et al. Reference Lotfy, Abbas, Zaki and Harun2019; Liu et al. Reference Liu, Shi and Zheng2022), which may cause the energy of large-scale structures to be more significant, that is, the cumulative TKE increases more rapidly with increasing scale in the energy-containing region. The enhanced energy fraction of large-scale structures under unstable conditions is also observed in other ASL measurements and numerical simulations (Kaimal et al. Reference Kaimal, Wyngaard, Izumi and Coté1972; Feigenwinter, Vogt & Parlow Reference Feigenwinter, Vogt and Parlow1999; Kim & Park Reference Kim and Park2003; Salesky et al. Reference Salesky, Katul and Chamecki2013; Banerjee et al. Reference Banerjee, Katul, Salesky and Chamecki2015; Lotfy et al. Reference Lotfy, Abbas, Zaki and Harun2019; Brilouet et al. Reference Brilouet, Durand, Canut and Fourrié2020; Liu et al. Reference Liu, Shi and Zheng2022). The slight increase in the parameter  $B$ in stably stratified ASLs indicates a focus of energy in the energetic structures, although the turbulence is suppressed by stable thermal conditions, providing further evidence supporting the results in figure 5(b).
6. Concluding remarks
Turbulence fluctuating data are extracted from the velocity time series over the entire sandstorm process by removing the time-varying mean flow with EMD and then the adaptive segmented processing is employed to ensure stationarity and statistical convergence. Statistical analyses of these turbulence signals indicate that thermal turbulence and shear turbulence exhibit a competitive evolutionary process in the rising and declining stages of the sandstorm due to the non-stationarity of sand-laden atmospheric turbulence. That is, the driving factor transitions from the dominant thermal turbulence in the rising stage to the weakened thermal turbulence and dominant shear turbulence in the steady stage and then to the suppressed turbulence motion in the declining stage due to the enhanced thermal stability.
With the evolution of this driving factor, the self-organized state of multiscale structures in the energy-containing region of the sand-laden turbulence also changes significantly as the sandstorm evolves. The logarithmic scaling law of cumulative TKE in the non-stationary rising and declining stages differs significantly from the existing theoretical results. The growth rate of the cumulative TKE in non-stationary stages is much higher than that in the middle stage of sandstorms with steady flow, and the scale of the energetic structures is larger in the rising stage and shorter in the declining stage. This suggests that the structural characteristics in the sandstorm process undergo an evolutionary process: at the beginning the sandstorm, the energy is mainly concentrated in larger energetic structures. Later on, as the sandstorm develops, the scale and kinetic energy of these structures is reduced because energy is transferred to smaller-scale vortices generated by strong shear. Eventually, at the end of the sandstorm, the energy re-focus on the shorter energetic structure because the suppressed shear leads to discontinuation of the generation of small-scale vortices and the difficulty in maintaining large-scale vortices.
By investigating the effects of independent environmental factors, it is found that the increase in the rate of increase in the cumulative TKE in the rising stage of the sandstorm is mainly caused by the flow acceleration (non-stationarity of the flow) and thermal instability, while it is due to the stable stratification in the declining stage. The influence of PM10 particles is negligible throughout the sandstorm process.
Funding
This study was supported by grants from the National Natural Science Foundation of China (92052202 and 12372217). The authors would like to express their sincere appreciation for the support.
Declaration of interests
The authors report no conflict of interest.
Appendix A. Details of the non-stationary data processing method
A.1. Non-stationary data processing method
In this appendix, we present the details of the non-stationary data processing method mentioned in § 3.1, and the resulting statistical results are compared with those of the stationary method.
The physical quantities in the turbulent field have the characteristics of random functions. That is, within a single experiment, physical quantities are irregular in space and time. However, once several experiments are performed under the same working conditions, the results obtained by arithmetic mean using multi-samples are deterministic. Therefore, the statistical average method is the most basic method to deal with turbulence.
According to the law of large number, statistical analysis requires a large number of samples for the ensemble average; taking the time series of streamwise velocity as an example
 \begin{equation} E\left [ U\left(t \right ) \right ] =\lim _{N \rightarrow \infty} \frac{1}{N} \sum_{i = 1}^{N} U_{i}(t) . \end{equation}
However, in practice, it is often difficult to acquire a large number of repeated experiments for obtaining the ensemble average. Alternatively, the time average is easier to achieve because it is convenient to perform continuous measurement in time at a fixed point in an experiment. This requires a stationary random process with ergodicity, whose time average (observation time is long enough) of any sample function approaches its statistical ensemble average, i.e.
 \begin{equation} P\left\{E[U(t)]=\overline{U(t)}=\lim _{\Delta T \rightarrow \infty} \frac{1}{\Delta T} \int_{t_{0}}^{t_{0}+\Delta T} U(t) \,{\rm d} t \right\}=1, \end{equation}
where the overbar represents the time average,  $\Delta T$ is the period of time and
 $t_{0}$ is the initial time. For the steady case, to acquire ergodic (statistically convergent) fluctuating turbulence signals of ASL flows, the observational data are usually divided into multiple hourly time series following the standard practice in the analysis of ASL data (Wyngaard Reference Wyngaard1992; Hutchins et al. Reference Hutchins, Chauhan, Marusic, Monty and Klewicki2012), and the turbulence fluctuations are obtained by removing the arithmetic mean from the data. The stationary data processing procedure is detailed in Wang & Zheng (Reference Wang and Zheng2016) and is consistent with Hutchins et al. (Reference Hutchins, Chauhan, Marusic, Monty and Klewicki2012) and Liu et al. (Reference Liu, He and Zheng2023). However, for the non-stationary case, the arithmetic mean of a fixed length time series may be inapplicable due to the time-varying characteristics. Therefore, the existing stationary data processing methods relating to the time average cannot be directly applied to non-stationary signal processing.
The Cramer decomposition theorem indicates that any time series can be decomposed into the sum of deterministic trend component and stationary zero mean fluctuating component. For a random time series, as long as one of the corresponding deterministic and random effects is non-stationary, the time series will be non-stationary. Therefore, the analysis of non-stationary random signals should start from these two aspects. Inspired by this theorem, a non-stationary data processing method based on removing the time-varying mean flow and adaptive segmented stationary is employed.
The non-stationary wind velocity series can be considered an ergodic stochastic process composed of a time-varying mean flow reflecting the overall trend and three fluctuating components of streamwise, spanwise and vertical velocity (Chen & Xu Reference Chen and Xu2004; Wang et al. Reference Wang, Wu, Tao, Li and Kareem2016). The gusting or drastic changes in mean flow during the sandstorm rising and declining stages are the main contributors to the non-stationarity, whereas the turbulence information concerned is contained in the fluctuating components. Therefore, it is necessary to remove time-varying mean flow from the wind velocity signals, where the key issue is how to extract an appropriate time-varying mean flow from a wind time history recorded. The EMD, as an adaptive signal processing technique, reduces the artificial selection of parameter because it is based on the local characteristics of data (Huang et al. Reference Huang, Shen, Long, Wu, Shih, Zheng, Yen, Tung and Liu1998). Therefore, EMD is employed to extract the time-varying mean flow in this study. The EMD can decompose a nonlinear and non-stationary time series into a finite number of component signals called IMFs and a residual term through an adaptive algorithm; that is, a non-stationary wind velocity series  $U(t)$ can be expressed as the sum of IMFs and the residual term
 \begin{equation} U(t)=\sum_{i=1}^{n} \operatorname{IMF}_{i}(t)+r_{n}(t), \end{equation}
where  $n$ is the number of IMFs and
 $r_{n(t)}$ is the residual term. The previous analysis of atmospheric flow data suggested that the fluctuations with period of the order of 1 h or less are considered as turbulence, while slower fluctuations are part of the mean field (Wyngaard Reference Wyngaard1992). Therefore, the residual term and IMFs with average fluctuation periods greater than 1 h are taken as the time-varying mean flow
 \begin{equation} \bar{U}\left ( t\right ) =r_{n}(t)+\left.\sum_{i=M}^{n} \operatorname{IMF}_{i}\right|_{\bar{T} \geq 1 h}, \end{equation}
where  $M$ is the first IMF component with a period greater than 1 h. Then, the turbulence fluctuations can be extracted from the wind velocity signals by removing the time-varying mean flow, i.e.
 \begin{equation} u(t) = U(t)-\bar{U}(t). \end{equation}
The time-varying mean flow extracted by EMD is compared with the hourly arithmetic mean, as shown in figure 8(a). As expected, there are significant differences between these two methods in the rising and declining stages. The mean flow extracted by EMD exhibits remarkable time-varying characteristics. Compared with the turbulence fluctuations extracted by removing the time-varying mean flow with EMD in figure 8(b), the result obtained by removing the hourly arithmetic mean remains a part of fluctuations relating to the mean field in the turbulence signal (as shown in figure 8c), and these residual fluctuations are more predominant with height (as shown in figure 8d). The residual fluctuation intensity accounts for 42 % ( $(u_{sm}-u_{nsm})/u_{sm}\times 100\,\%$, where
 $u_{nsm}$ and
 $u_{sm}$ denote the fluctuations extracted by removing the time-varying mean and hourly arithmetic mean, respectively) of the total intensity in the rising stage, 6 % in the steady stage, and 39 % in the declining stage, respectively. Therefore, the stationary method for calculating the steady incoming flow is not appropriate for the non-stationary processes of sandstorms.
(a) Comparisons of the time-varying mean flow and hourly arithmetic mean flow at  $z= 5$ m, where the black line is the streamwise wind velocity time series, the red line is the time-varying mean flow obtained by EMD and green line is the hourly arithmetic mean. (b) Turbulence fluctuations (
 $u_{nsm}$) extracted by removing the time-varying mean flow with EMD at
 $z = 5$ m. (c) Velocity fluctuations (
 $u_{sm}$) extracted by removing the hourly arithmetic mean at
 $z = 5$ m. (d) Residual fluctuations relating to the mean field (
 $u_{sm}-u_{nsm}$) at
 $z = 0.9$ m (black line) and 30 m (red line).

The time-varying characteristics of non-stationary signals may be reflected not only in the mean field, but also in the turbulence fluctuations  $u(t)$. For a non-stationary random process
 $u(t)$, if there is a set of instant points in the interval
 $[a, b]$
 \begin{equation} \left. \begin{gathered} a=t_{0}< t_{1}< t_{2}<\cdots< t_{n}=b, \\ \Delta t_{i}=t_{k+1}-t_{k}, \quad t_{k} \leqslant \tau_{k} \leqslant t_{k+1}, \quad k=1,2 \ldots, n, \end{gathered} \right\} \end{equation}
making the time series  $\{ u(t_{k}+1),\ldots,u(t_{k+1}) \}$ stationary, then
 $u(t)$ is piecewise stationary. Each stationary segment can be described by stationary random signal models (Djuric, Kay & Boudreaux-Bartels Reference Djuric, Kay and Boudreaux-Bartels1992; Lavielle Reference Lavielle1998). Segmentation of random processes is widely used in the analysis and processing of non-stationary signals. For example, the averaging interval is usually taken as 1 h in typhoon signal analysis (Chen & Xu Reference Chen and Xu2004; Wang et al. Reference Wang, Zhao, Cao, Zhang, Yin and Ge2018), 30 min in thunderstorm signal analysis (Schulz & Sanderson Reference Schulz and Sanderson2004), 10 min in wind load analysis of building (Tamura et al. Reference Tamura, Kawai, Uematsu, Marukawa, Fujii and Taniike1996; Wang et al. Reference Wang, Wu, Tao, Li and Kareem2016) and 1 h or 10 min for the analysis of wind field above ocean (Cheynet, Jakobsen & Obhrai Reference Cheynet, Jakobsen and Obhrai2017; Mahrt et al. Reference Mahrt, Nilsson, Rutgersson and Pettersson2020). These averaging intervals are empirical and cannot guarantee that every segment of data satisfies the stationarity condition (Chen & Xu Reference Chen and Xu2004). Moreover, a fixed length may defeat the purpose of segmentation (Hassanpour, Shahiri & IEEE Reference Hassanpour and Shahiri2007; Azami et al. Reference Azami, Sanei, Mohammadi and Hassanpour2013). Therefore, different from the usual segmentation of atmospheric flow with a fixed interval length, an adaptive segmentation method is employed in this study to divide the turbulence fluctuations extracted by removing the time-varying mean flow in the sandstorm into several segments satisfying the stationarity conditions (Liu et al. Reference Liu, Shi and Zheng2022).
A data segment that can be used to study turbulence should contains at least one typical energetic vortex convective period. In the outer region of the wall-bounded turbulence, very-large-scale coherent structures with lengths up to 10 $\delta$ have been verified to be an important and perhaps dominant feature (Hutchins & Marusic Reference Hutchins and Marusic2007). Therefore, the period of the minimum segment
 $\Delta t$ is estimated according to the characteristic time of typical energetic eddies, i.e.
 $\Delta t = 10\delta /U_{c}$ (where
 $U_{c}$ is the convection velocity taken as the local mean). On this basis, taking the stationary data condition of
 $IST <$ 30 % (Foken et al. Reference Foken, Gockede, Mauder, Mahrt, Amiro and Munger2004) as a threshold, iterations are performed to extend the period such that
 $u(N_{i}\Delta t)$ does not satisfy the stationary data condition while
 $u\{(N_{i}-1)\Delta t\}$ satisfies the condition. Then, the adaptive segmented stationary data are taken as
 $u(\Delta T_{i})=u\{(N_{i}-1)\Delta t\}$. Repeating the above steps, a non-stationary signal can thus be divided into several segments of stationary signals
 \begin{equation} u(t) = \left\{u_{1}\left(\Delta T_{1}\right), u_{2}\left(\Delta T_{2}\right), \ldots, u_{i}\left(\Delta T_{i}\right), \ldots, u_{m}\left(\Delta T_{m}\right)\right\}\!, \end{equation}
where  $\Delta T_{i}=(N_{i}-1)\Delta t$ and
 $t=\Delta T_{1}+\Delta T_{2}+\cdots +\Delta T_{m}$. In addition, different degrees of overlap can be set between two adjacent segments to increase the continuity of evolution. To ensure ergodicity, it is prudent to confirm statistical convergence. The Ogive analysis describes the probability distribution of a real random variable, which can be used to test the statistical convergence of data. The segment of data is statistically convergent when the cumulative probability distribution of fluctuating velocity satisfies
 \begin{equation} \left.F_{U}\left(U_{t h}\right)\right|_{t} = \left.P\left(U< U_{t h}\right)\right|_{t} = \left.F_{U}\left(U_{t h}\right)\right|_{t+\Delta t}\!, \end{equation}
where  $U_{th}$ denotes the threshold wind speed.
After applying the adaptive segmentation procedure to the turbulence signals extracted by removing the time-varying mean, the intervals of each segment of the present sandstorm data are 45, 40, 55 and 40 min in the rising stage, and 25, 30, 45, 20, 25, 30, 35, 45, 35, 25 and 45 min in the declining stage. The Ogive analysis is performed on each segment in the rising and declining stages and the result are shown in figures 9 and 10, respectively. After reaching a certain length, the cumulative probability distribution of each segment will not change with the increasing length. This indicates that each segmented turbulence signal satisfies the statistical convergence and can be used for subsequent statistical analysis.
The duration of the rising stage in the sandstorm process selected in this work is 3 h and it is divided into 4 four segments, with time intervals of 45, 40, 55 and 40 min. The cumulative frequencies of these segments for streamwise velocity fluctuations at  $z = 5$ m are shown in (a–d).

The declining stage of the sandstorm lasts 6 hours and is divided into 11 segments with time intervals of 25, 30, 45, 20, 25, 30, 35, 45, 35, 25 and 45 min. The cumulative frequencies of these segments for streamwise velocity fluctuations at  $z = 5$ m are shown in (a–k).

A.2. Comparison with the stationary data model
Comparisons of the statistical results obtained with the non-stationary method and those obtained with the stationary method are provided in this sub-section. It is noted that this subsection pays attention to the difference between the results of the two methods, while the evolution of these results over time or the difference between different stages of sandstorm can be found in Liu et al. (Reference Liu, Shi and Zheng2022). First, the streamwise turbulent intensity is shown in figure 11, where figure 11(a) plots the evolution of the streamwise turbulent intensity normalized by the friction velocity  $\overline {uu}/u_{\tau }^{2}$ over time during the sandstorm, and figure 11(b) shows variations in the energy fraction contributed by VLSMs to the total kinetic energy with the outer-scaled wall-normal distance. It is seen in figure 11(a) that in the rising and declining stages of the sandstorm, the stationary method overestimates the turbulence intensity (with an average of approximately 20 % and a maximum of up to 73 %) compared with the non-stationary method. This is because the stationary method remains a part of low-frequency fluctuations related to the mean field in the turbulence signal, and the residual fluctuation intensity accounts for a large proportion of the total intensity (as mentioned in the descriptions of figure 8). In addition, the residual low-frequency fluctuations also result in the overestimated energy fraction of the VLSMs, as shown in figure 11(b). The variations in the energy fraction with the wall-normal distance and the differences between the three different stages of the sandstorm are detailed in Liu et al. (Reference Liu, Shi and Zheng2022).
Statistical results of the streamwise turbulent intensity: (a) evolutions of the streamwise turbulence intensity normalized by the friction velocity  $\overline {uu}/u_{\tau }^{2}$ with time during the sandstorm at 5 m height, where the black and red solid lines represent the result of non-stationary and stationary method, respectively; the blue line is the deviation between the results of non-stationary and stationary method; (b) variations in the energy fraction contributed by VLSMs to the total streamwise TKE with outer-scaled height
 $z / \delta$ at different stages of the sandstorm, where the filled symbols are results obtained with the non-stationary method and hollow symbols are results obtained with the stationary method; the previously documented laboratory TBL results at
 ${Re_{\tau } = 2395}$ (Balakumar & Adrian Reference Balakumar and Adrian2007) and the sand-laden atmospheric stationary flow results at
 ${Re_{\tau } = 4.2 \times 10^{6}}$ (Wang, Gu & Zheng Reference Wang, Gu and Zheng2020) are also included in the figure for comparison.

Second, figure 12 shows pre-multiplied energy spectra of the streamwise velocity fluctuations at different stages of the sandstorm to gain insight into the distribution of energy between multiscale turbulent motions. As expected, the most striking aspect is the significantly overestimated energy obtained with the stationary method in the lower wavenumber region in the rising and declining stages. This may provide evidence for the plausible explanation that the residual low-frequency fluctuations by removing the hourly arithmetic mean cause the turbulence intensity to be overestimated.
Pre-multiplied spectra of streamwise velocity fluctuations vs streamwise wavenumber during the sandstorm process at heights of 0.9 and 30 m: (a) rising stage, (b) steady stage and (c) declining stage, where the dashed and solid lines represent the results obtained with the stationary method and non-stationary method, respectively.

Third, to compare the length scale of the most energetic structure estimated by these two methods, the wavelength corresponding to the distinct peak in the pre-multiplied energy spectra is extracted. The resulting most energetic structural scale at different heights during the entire sandstorm process is plotted in figure 13. At the beginning of the sandstorm, with the intrusion of cold air, strong convection occurs due to the interaction between cold and warm air. The small changes in the incoming flow result in the negligible difference in the most energetic structural scale obtained with the two methods. As the sandstorm develops, the rapid increase in wind velocity enhances the non-stationarity of the flow. The gusting or drastic changes in the mean field (i.e. synoptic-scale structures) are incorrectly regarded as the most energetic turbulent structure determined with the stationary method, which results in a significant overestimation of scale in the rising stage. After full development, the wind velocity is basically stable. For stationary flow, the results obtained with the non-stationary method agree well with those obtained with stationary method. At the end of the sandstorm, with the departure of the cold air mass, the energy is gradually exhausted, which leads to a decrease in the wind velocity. Thus, flow structures, especially large structures, are difficult to maintain. However, the stationary method misjudges the attenuation of the structure scale as increasing in the declining stage since the residual gusting or drastic changes in the mean field mask the turbulence attenuation.
Evolution of the outer-scaled wavelength  $(\lambda _{x})_{max}/\delta$ corresponding to the distinct peak in the pre-multiplied energy spectra with time at heights of 0.9, 5 and 30 m in the entire sandstorm process, where the solid line and dashed line represent the results obtained with the non-stationary and stationary method, respectively.

Appendix B. Further evidence supporting the present results from another sandstorm
To verify the reliability of the results described in the main text, this section provides results from other sandstorm data (starting at 13:00 local time on 16 April 2016 and ending at 03:00 on 17 April 2016) available in Liu et al. (Reference Liu, Shi and Zheng2022), as shown in figures 14–16.
Quadrant distributions of the streamwise and vertical velocity fluctuations ( $u$,
 $w$) in different stages of the sandstorm at 5 m height (dot symbols), and the corresponding joint probability density function
 $P(u, w)$ (white lines). (a) Rising stage, (b) steady stage, (c) declining stage. The evolution of (e) the probability of each quadrant event
 $N_{Q_i}/N_{total}$, (e) the intensity of contributions to the Reynolds shear stress of each quadrant event
 $\overline {uw}_{Q_i}/\overline {uw}$ and the Reynolds shear stress
 $\overline {uw}$ with time during the sandstorm.

(a) Plots of the second-order structure function of the streamwise velocity fluctuations  $\langle \Delta u^{2+}\rangle$, where the inset shows the results at a log–log scale; (b) the corresponding pre-multiplied derivative
 $(r / z)[\textrm {d}\langle \Delta u^{2+}\rangle / \textrm {d}(r / z)]$ vs
 $r/z$ in the rising (red line), steady (blue line) and declining (green line) stages of the sandstorm at a 5 m height, where the plateau magnitude is the value of
 $B$, ‘
 $+$’ denotes the inner scaling,
 $u^{2+}=u^{2} / u_{\tau }^{2}$,
 $\langle {\cdot } \rangle$ denotes the time average, the black lines represent the theoretical formulas based on the stationary atmospheric flow,
 $B = 4/3\kappa ^{-2/3} \approx 2.5$ (Chamecki et al. Reference Chamecki, Dias, Salesky and Pan2017; Xie et al. Reference Xie, de Silva, Baidya, Yang and Hu2021),
 $A = 2.95$ and
 $M_{p} = 3.12$ (de Silva et al. Reference de Silva, Marusic, Woodcock and Meneveau2015). The illustration shows the evolution of
 $B$ obtained from the plateau value over time.

Variations in parameter  $B$ of the logarithmic scaling law with the (a) average PM10 dust concentration
 $\bar {C}$ at different heights, (b) acceleration
 $a$ of the incoming flow and (c) thermal stability parameter
 $z/L$.



