


1. Outline and Set-Up of Study
Global sea level is rising at a rate of 10–20cm per century (Reference Church and HoughtonChurch and others, 2001). There is concern that anthropogenic forcing of climate may lead to significant global warming and, as a consequence, to an increasing rate of sea-level rise. Thermal expansion of the oceans and changes in the volume of land ice are supposed to be the most important factors that affect sea level on the decadal to century timescale.
The rise of sea level during the last 100–150 years is partly understood. Estimates of the contribution from thermal expansion, obtained by running ocean models with appropriate forcing, are in the 3–7 cm range for the period 1865– 1990 (e.g. de Wolde and others, 1995; Reference Church and HoughtonChurch and others, 2001). Meteorological records can be used to estimate the melt from glaciers, ice caps and the Greenland ice sheet (GIS). By using modelled sensitivities of glacier mass balance, Reference Zuo and OerlemansZuo and Oerlemans (1997) calculated a contribution of 5–8 cm to sea-level rise for the period 1865–1990 (glaciers + GIS). Reference Church and HoughtonChurch and others (2001) report estimates in the 2–4 cm range for the 20th century from glaciers only. It therefore appears that the observed sea-level rise can be explained partly by thermal expansion and melting of glaciers and small ice caps. It is also very possible that long-term changes in the large polar ice sheets (Antarctica and Greenland) are large enough to make a significant contribution to sea-level change. Model calculations with a three-dimensional thermomechanical model of the Antarctic ice sheet suggest that this might be the case (e.g. Reference Huybrechts and de WoldeHuybrechts and de Wolde, 1999). The Antarctic ice sheet would still be losing mass in response to the large rise in sea level associated with the waning of the Northern Hemisphere ice sheets during the last deglaciation. Similar studies for the Greenland ice sheet point to a situation in which the ice sheet would be in rather close balance with the current climatic conditions (Reference HuybrechtsHuybrechts, 1994; Reference Van de WalVan de Wal, 1999; Reference Church and HoughtonChurch and others, 2001).
All these calculations and estimates are subject to a considerable uncertainty. Results depend on the choice of initial conditions, but these are poorly known. Glacier mass-balance models have been tested mainly against observations on mid-latitude glaciers, but most of the ice outside Greenland and Antarctica is found in the Arctic regions (Reference DowdeswellDowdeswell and others, 1997). The dynamic models of the Antarctic and Greenland ice sheets mentioned above are not very well constrained, either with respect to model parameters or with respect to the geological and geomorphological evidence that can be used to judge the simulated late-Pleistocene/ Holocene response (e.g. Reference Ritz, Fabre and LetréguillyRitz and others, 1997).
Altogether there is a great need for further study of the larger ice bodies. With regard to the globally integrated effect of glaciers, ice sheets and ice caps, the Arctic region is of particular importance. Although it has a relatively cold climate, all glaciers and ice caps found there are subject to considerable melting and runoff in summer. Therefore Arctic glaciers and ice caps are sensitive to climatic change: a small increase in temperature will have an immediate effect on the melting and runoff. In view of the expected enhanced greenhouse warming, relatively large changes in the volume of Arctic ice bodies can be expected. In this paper, we attempt to estimate the additional runoff from Arctic glaciers for climate scenarios produced by coupled ocean–atmosphere models. This work was initiated by the Arctic Climate Impact Assessment, for which such an estimate was required.
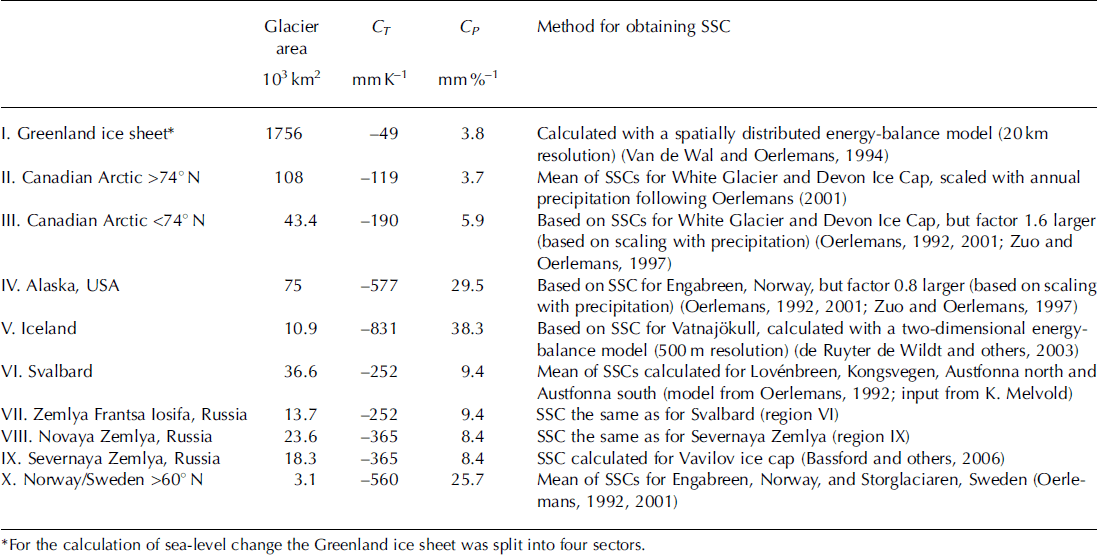
During the last few decades, Arctic ice masses have been investigated with very different methods. In many cases, only basic parameters have been measured, because logistic constraints did not allow thorough studies to be made. In other cases, a large amount of data on geometry, mass balance and ice dynamics has been collected. The diversity of the data available implies that it is difficult to obtain a well-balanced picture of what is known and what is unknown. Nevertheless, in this contribution we want to make an estimate of the climate sensitivity of all ice bodies in the Arctic (Table 1). We have chosen to do this by using results from energy-balance modelling, in which the most important processes that regulate the exchange of mass and energy between glacier surface and atmosphere are described. The dynamic response of glaciers is not considered (further comments on this are given below).
Overview of the glacier regions used in the calculations. Climate sensitivity of the mean surface balance to an annual change in temperature and precipitation, respectively, is given in the third and fourth columns. The last column describes how the seasonal sensitivity characteristic (SSC) of the various regions was obtained
For some of the ice bodies, extensive studies with energy-balance models have been made already (e.g. for the Greenland ice sheet (Reference Van de Wal and OerlemansVan de Wal and Oerlemans, 1994; Reference Van de WalVan de Wal, 1996); for Svalbard glaciers (Reference Fleming, Dowdeswell and OerlemansFleming and others, 1997); and for Vatnajökull, Iceland (Reference De Ruyter de Wildt, Oerlemans and Björnssonde Ruyter de Wildt and others, 2003)), and we will incorporate these to arrive at a more complete picture. In some cases, the input data for the energy-balance modelling are extremely limited, and first-order estimates of quantities like altitudinal precipitation gradients have to be made.
In the calculation reported here, monthly output is used from the climate models of the Hadley Centre, UK (HADLEY), of the Canadian Climate Center (CCC), of the Max-Planck-Institut für Meteorologie, Hamburg, Germany (ECHAM), of the Geophysical Fluid Dynamics Laboratory, Princeton, NJ, USA (GFDL), and of the National Center for Atmospheric Research, Boulder, CO, USA (NCAR CSM). The basic characteristics of these models and the experiments carried out are described by Reference HoughtonHoughton and others (2001). All results shown in this paper are for the IPCC-B2 scenario of the Intergovernmental Panel on Climate Change. The B2 scenario refers to a world with a steadily increasing population, intermediate levels of economic development, and diverse technological change (Reference HoughtonHoughton and others, 2001, p.63). It is the most commonly used scenario for climate impact studies.
2. Climate Sensitivity of Glacier Mass Balance
To facilitate the discussion, we first review briefly some basic concepts. The net mass budget N of a glacier or ice sheet can be written as

Here b is the specific balance rate (net gain or loss of mass per unit area per unit of time), x and y are the horizontal coordinates, and C is the rate at which mass is lost by calving into the sea or into lakes.
 is the specific balance averaged over the entire glacier surface (which has area A).
also includes melting or accretion of ice at the glacier base. Clearly, a glacier can only be in equilibrium when N = 0, which is generally not the case.
We now define monthly sensitivities of the mean surface balance to a change in atmospheric temperature as
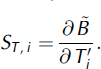
Here ST, i
is the change in
due to the effect of a temperature perturbation in month i. The temperature perturbation is defined as the difference between the temperature of a month and its long-term mean.
Similarly, the sensitivity to changes in precipitation can be expressed as
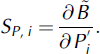
The precipitation perturbation is defined as
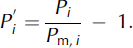
Here Pi is the precipitation in month i and Pm,i its long-term mean value.
The definitions of the sensitivities imply that a reference state should be defined. The most straightforward approach is to take a state for which N = 0, although this may be far from the actual situation (which is not very well known for most glaciers). Moreover, the sensitivities as defined above are for a fixed glacier geometry and it will be assumed that calving rates remain constant.
The 24 sensitivity values defined by Equations (3) and (4) form a 2 × 12 matrix, which has been termed the seasonal sensitivity characteristic (SSC) by Reference Oerlemans and ReichertOerlemans and Reichert (2000). Once the SSC is known, it is possible to calculate the consequence of any future climate scenario given as monthly anomalies in temperature and precipitation:

Here the quantities θ and ζ are introduced to allow for an imbalance between climate and glacier state. The volume of ice lost or gained in the course of time is now obtained from
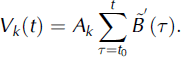
The index k refers to the region (Table 1). Ak is the total glacier area in region k. The volume change in region k is denoted by Vk .
The glaciers and ice caps to which energy-balance models were applied are mentioned in Table 1 (last column). The climatic setting of these glaciers ranges from very dry (White Glacier and Devon Ice Cap, Canada; Greenland ice sheet) to very humid (Vatnajökull; Engabreen, Norway). There are also large differences in the annual temperature range. For Vatnajökull this range is small (∼15 K), and for White Glacier very large (∼35 K). These differences in climatic setting are the main reason for the different shapes of the SSCs. In Figure 1, SSCs are shown for six glaciers/ice caps. In these graphs each bar represents a contribution to the change in the mean specific balance due to a 1 K temperature perturbation or a 10% precipitation increase in that particular month (1 is January, etc.).
The SSC for a selection of glaciers and ice caps.
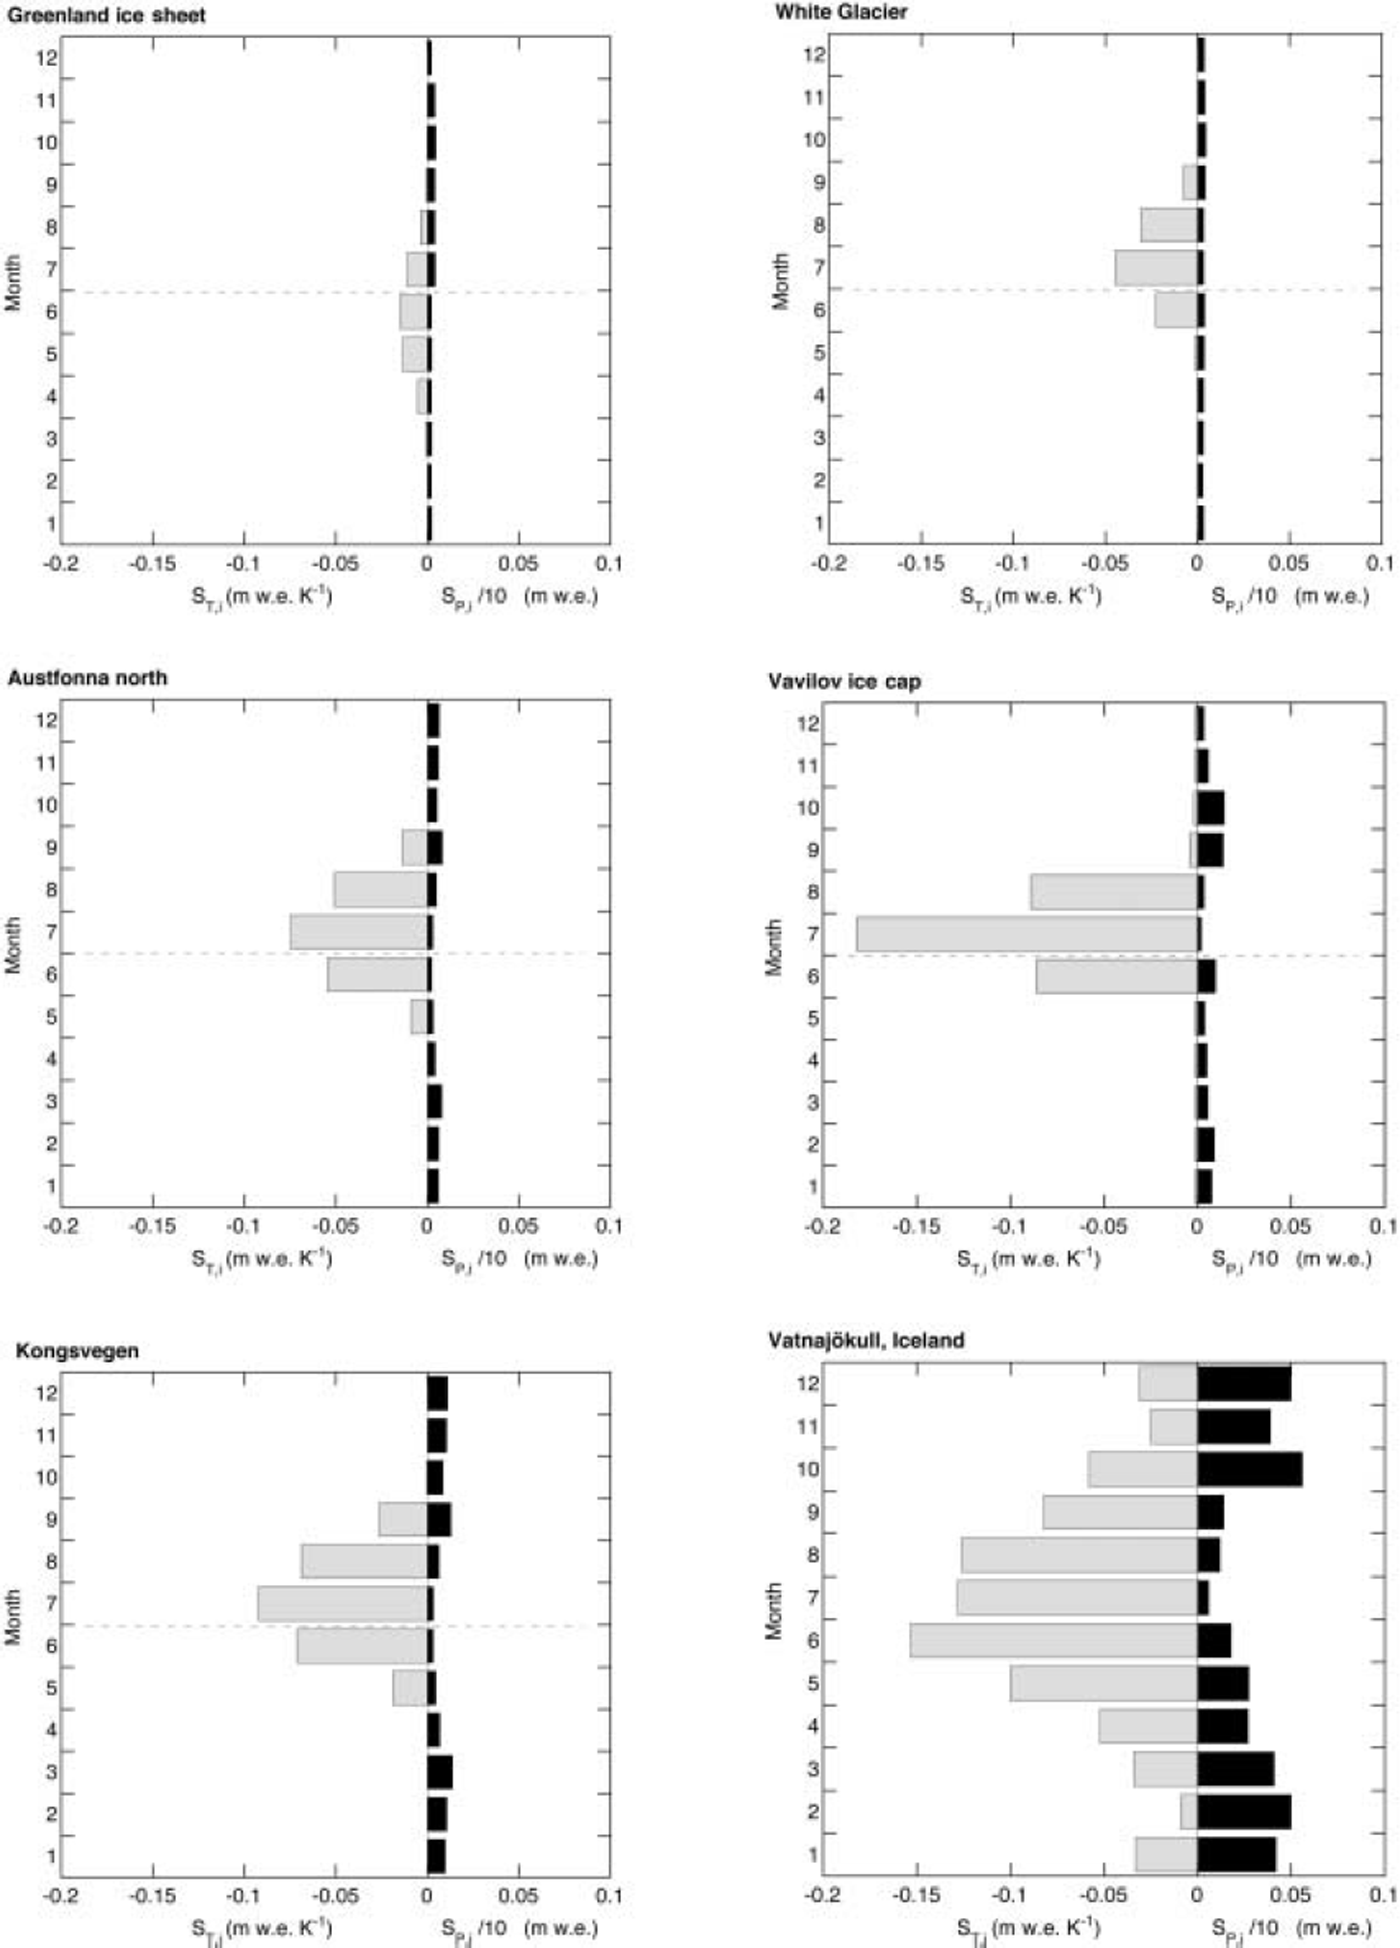
The contrast between the continental and maritime ice caps is striking. The mean specific balance of the Greenland ice sheet is least sensitive to temperature change, whereas Vatnajökull shows the largest sensitivity. It can also be seen that, for the Arctic ice caps, only the summer months contribute to the temperature sensitivity. For Vatnajökull, on the other hand, temperature anomalies in the winter half-year also make a significant contribution to the total sensitivity.
Some of the SSCs show a more regular pattern through the year than others, notably concerning the sensitivity to changes in precipitation. This is related to the type of input data. For White Glacier, for instance, the precipitation rate through the year follows a smooth sine function, simply because the paucity of data does not allow a more sophisticated scheme. On the other hand, the Vatnajökull model is driven by detailed daily meteorological input from nearby weather stations. The sensitivity of the specific balance to a fractional change in precipitation will therefore also reflect the monthly precipitation differences in the climatology.
The next step is to estimate the climate sensitivity of all Arctic ice masses, based on the modelling studies described above. For the Greenland ice sheet we simply take the values from the two-dimensional energy-balance model, but for the other ice masses extrapolation has to be carried out. Table 1 summarizes how this has been done for the various regions.
It is also instructive to look at annual sensitivities, defined as
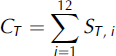
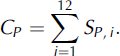
The sensitivity of the mean specific balance to a uniform temperature change (CT ) is thus obtained by summing up the monthly values (which is a good approximation; see Reference Oerlemans and ReichertOerlemans and Reichert, 2000). The same procedure applies to the sensitivity to changes in precipitation (CP ). Values of CT and CP are given in Table 1.
To put the results for the different regions in a better context, we can also consider the climate sensitivity of ice caps in terms of sea-level change (denoted by SL T for temperature change and by SL P for precipitation change). This merely involves multiplying CT and CP by the area of the ice masses involved and dividing the resulting number by the total area of the world ocean. Values of CT , SL T , CP and SL P for the major glacier regions in the Arctic are shown in Figure 2. Whereas Iceland has the largest sensitivity for both temperature and precipitation, the Greenland ice sheet has the largest potential impact on sea level, in spite of its low sensitivity. For a uniform 1 K warming, the contribution from the Greenland ice sheet to sea-level rise would be about the same as that from the other glaciers and ice caps together. The picture for an increase in precipitation appears as the mirror image of the picture for an increase in temperature. Again, Iceland and Alaska have the largest sensitivity, but Greenland is still the most important with respect to sea-level change because of its size.
Sensitivity of the mean surface balance to changes in annual temperature (a) and annual precipitation (b). The resulting effects on sea-level change (SL P and SL T ) are also shown (in black). Note that the scales are different.
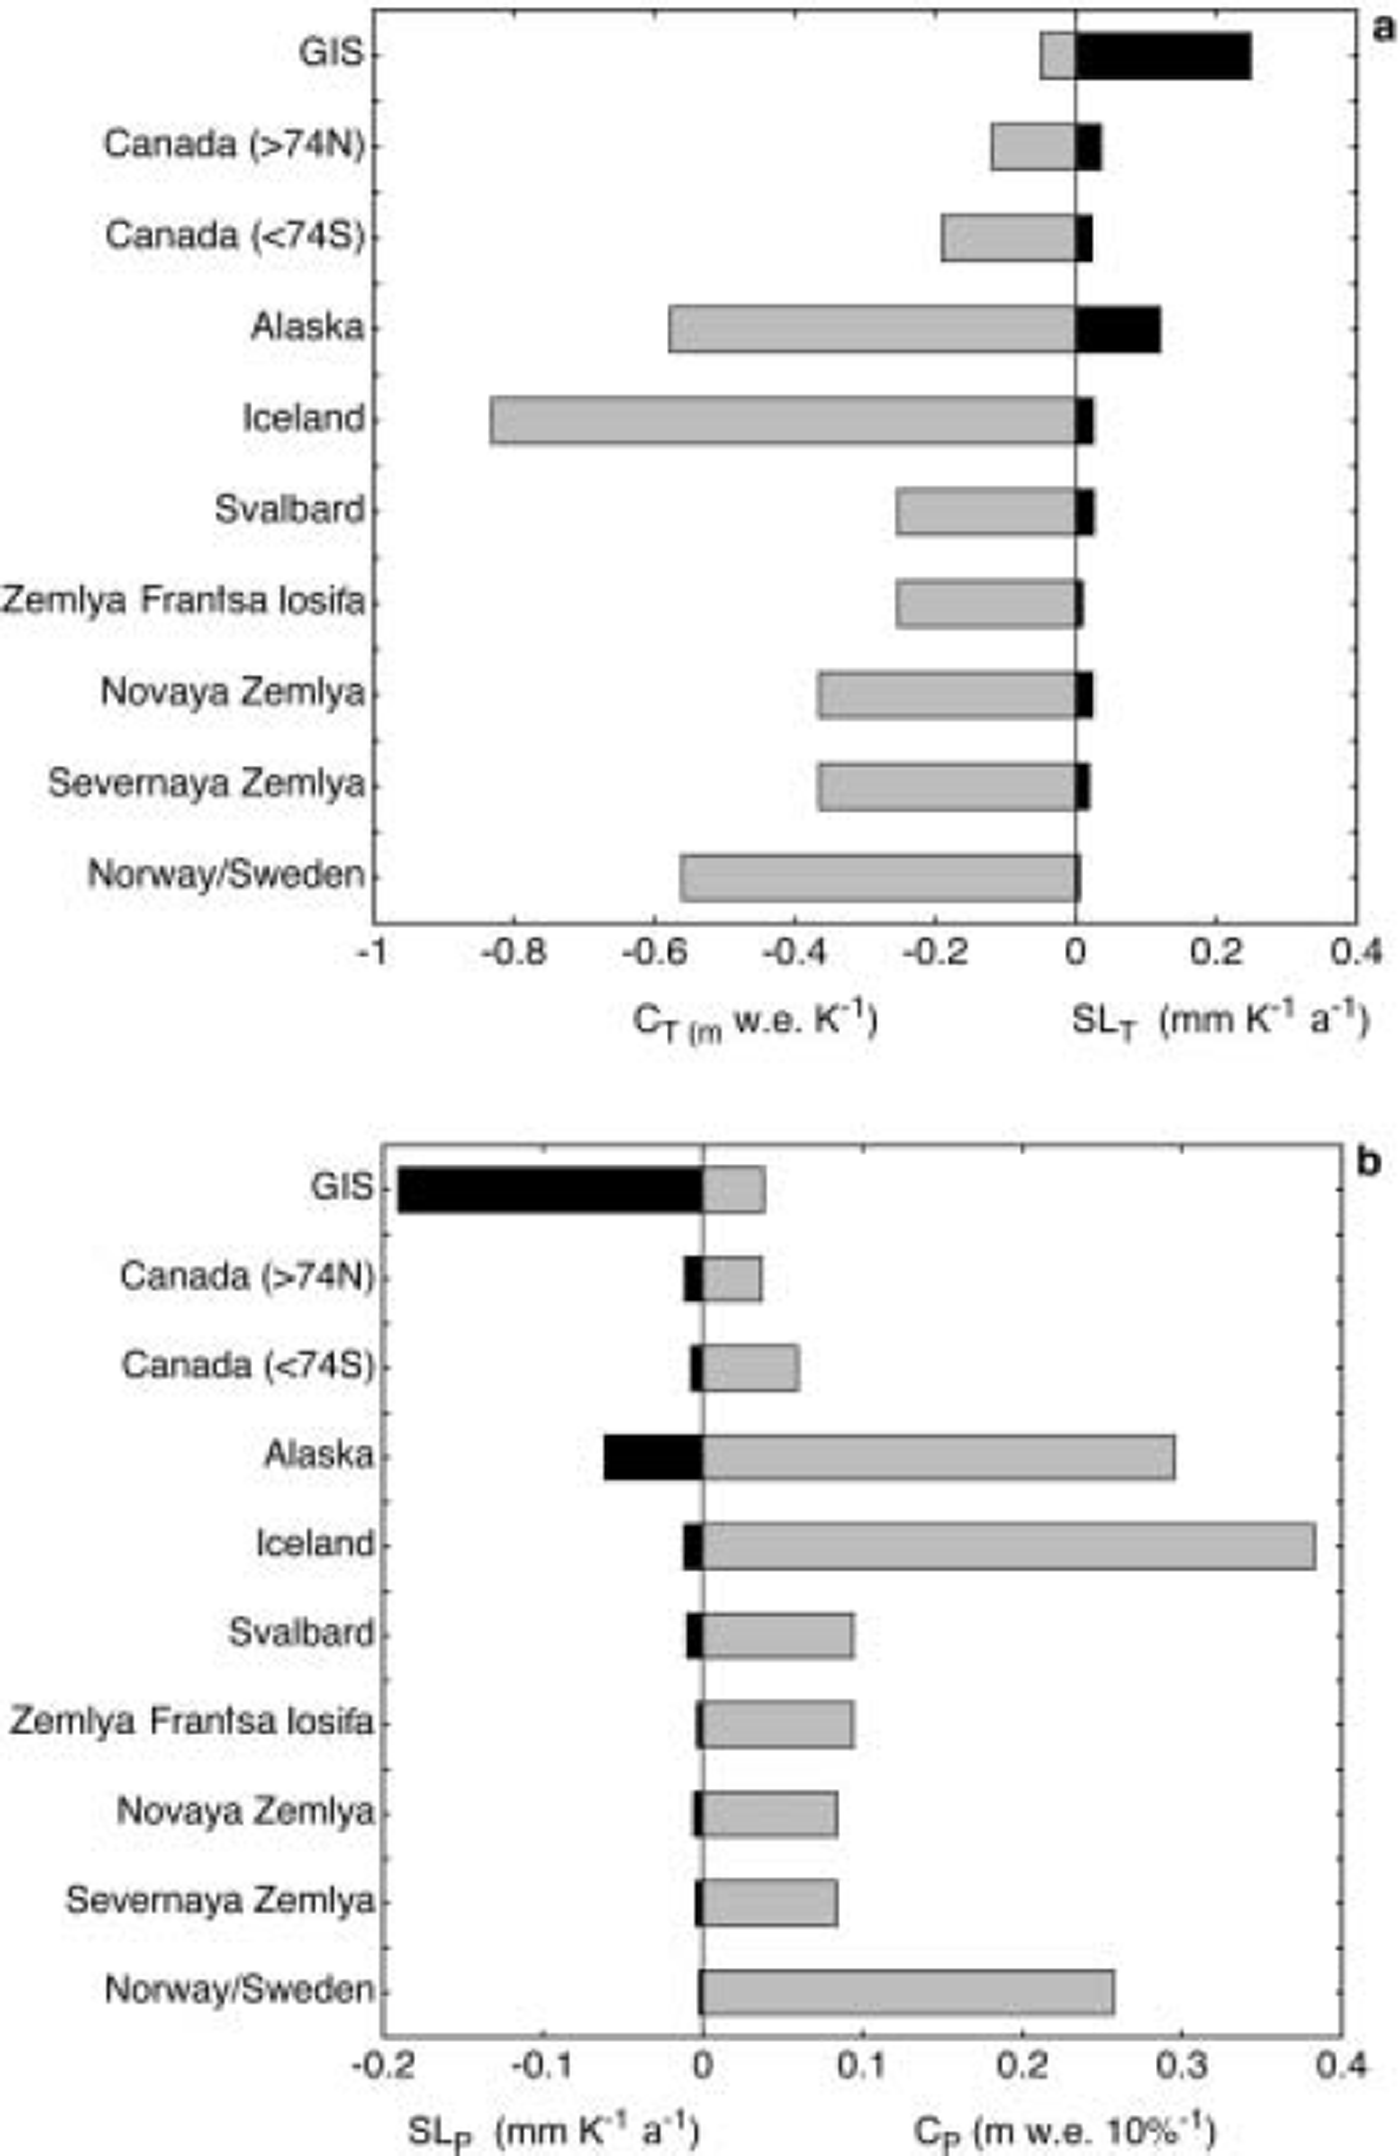
By summing up the values for the different regions we find a sensitivity for a (uniform) temperature change of 0.53 mm sea-level rise a–1 K–1 and for a uniform change in precipitation of 0.31 mm sea-level drop a–1 (10%)–1. This implies that sea-level rise due to a 1 K warming could be cancelled by an increase in precipitation of about 17%.
3. Results
We now turn to the calculation of the mean balance of the various glacier regions for the next 100 years. As input for Equation (5) we used monthly temperature and precipitation anomalies from runs with the coupled ocean–atmosphere models mentioned in section 1 . These models and experiments are described in Reference HoughtonHoughton and others (2001). We do not give a general discussion here on the outcome of the transient model runs, because these have been described and used elsewhere. Instead, we concentrate on the implications for Arctic glaciers. All results shown in this paper are for the IPCC-B2 scenario, which is the most commonly used. Data have been averaged over the respective glacier regions (Table 1). The Greenland ice sheet was split into four sectors, because it covers a larger area over which monthly anomalies vary significantly. These sectors were chosen as in Reference OerlemansOerlemans (1991) and represent to some extent climatic entities: the wet south and southeast sector with a maritime climate; the cold, dry northeast sector; the cold but wetter northwest sector; and the dry west sector with a very continental climate (cold winters and warm summers).
Unfortunately, the current state of balance of most glaciers and ice caps in the Arctic is not known. For some glaciers and ice caps, information on changes in extent over the last few decades is available, but even then it is difficult to quantify this in terms of θ and ζ and to generalize this for an entire region. In the calculations reported here we have therefore set θ and ζ to zero.
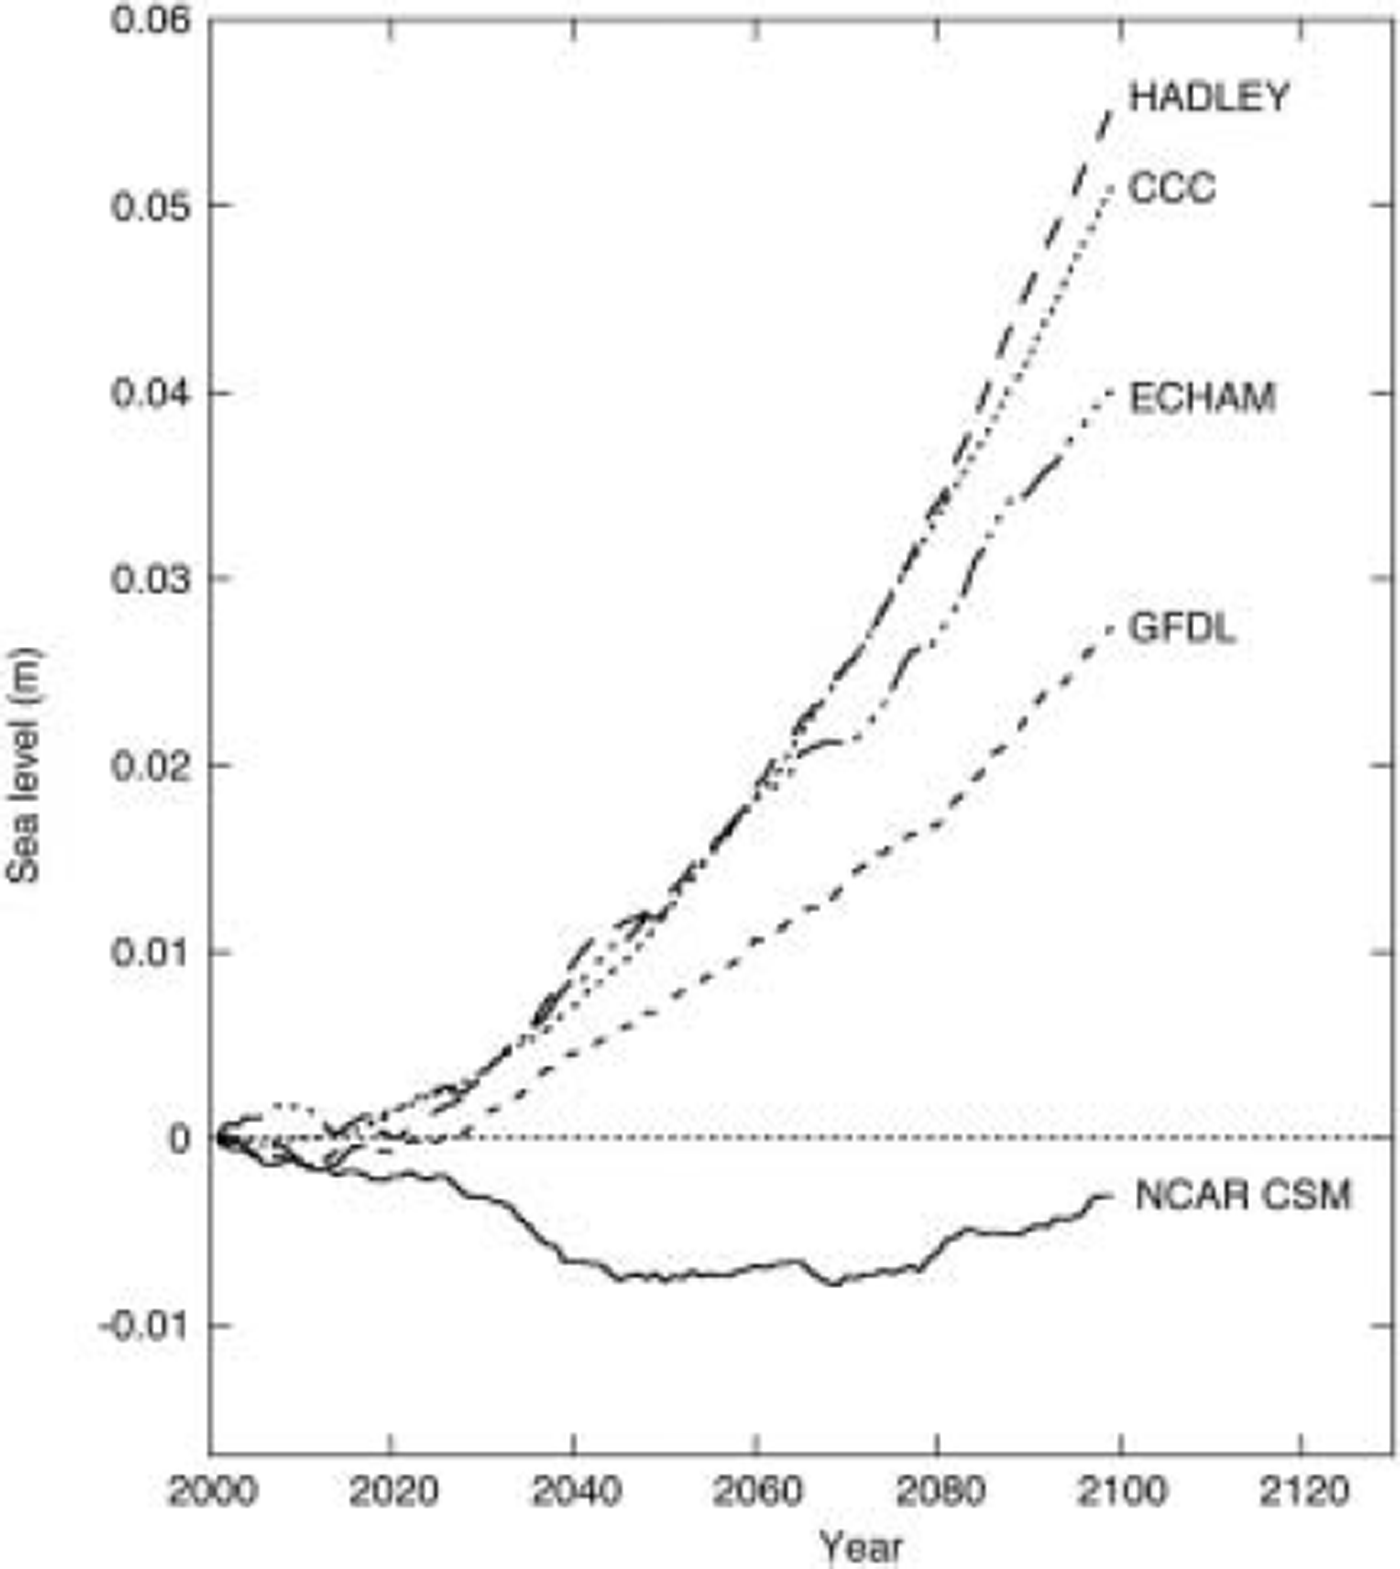
Figure 3 shows the total contribution of Arctic glaciers to sea-level rise calculated for the various models. Apparently, the differences are very large. Most models predict that Arctic glaciers will make a contribution to sea-level rise, but the NCAR CSM model predicts little change. Further analysis shows that this is due to a very large increase in precipitation in the NCAR CSM model. In contrast, the Hadley Centre model yields an almost 6 cm contribution to sea-level rise in 2100.
Contribution of Arctic glaciers to sea-level change as calculated from the output of five different climate models.
In Figure 4 the contributions from precipitation and temperature changes are considered separately (for the year 2100). This figure reveals that the inter-model differences are first of all due to differences in the simulated precipitation. For instance, in the Hadley Centre model the precipitation over the Arctic glaciers in 2100 is not larger than today. At the same time, the NCAR CSM model predicts a substantial increase that cancels the increase in ablation. The large differences among the various models are a consequence of different schemes for key processes in the (sub-)Arctic regions, notably the formation of sea ice. The response of the sea-ice pack to increased radiative forcing varies strongly in the models (Reference HoughtonHoughton and others, 2001), and this has an immediate feedback on precipitation patterns.
Contributions of temperature and precipitation effects to sea-level change in 2100 (with respect to 2000) for the five climate models.
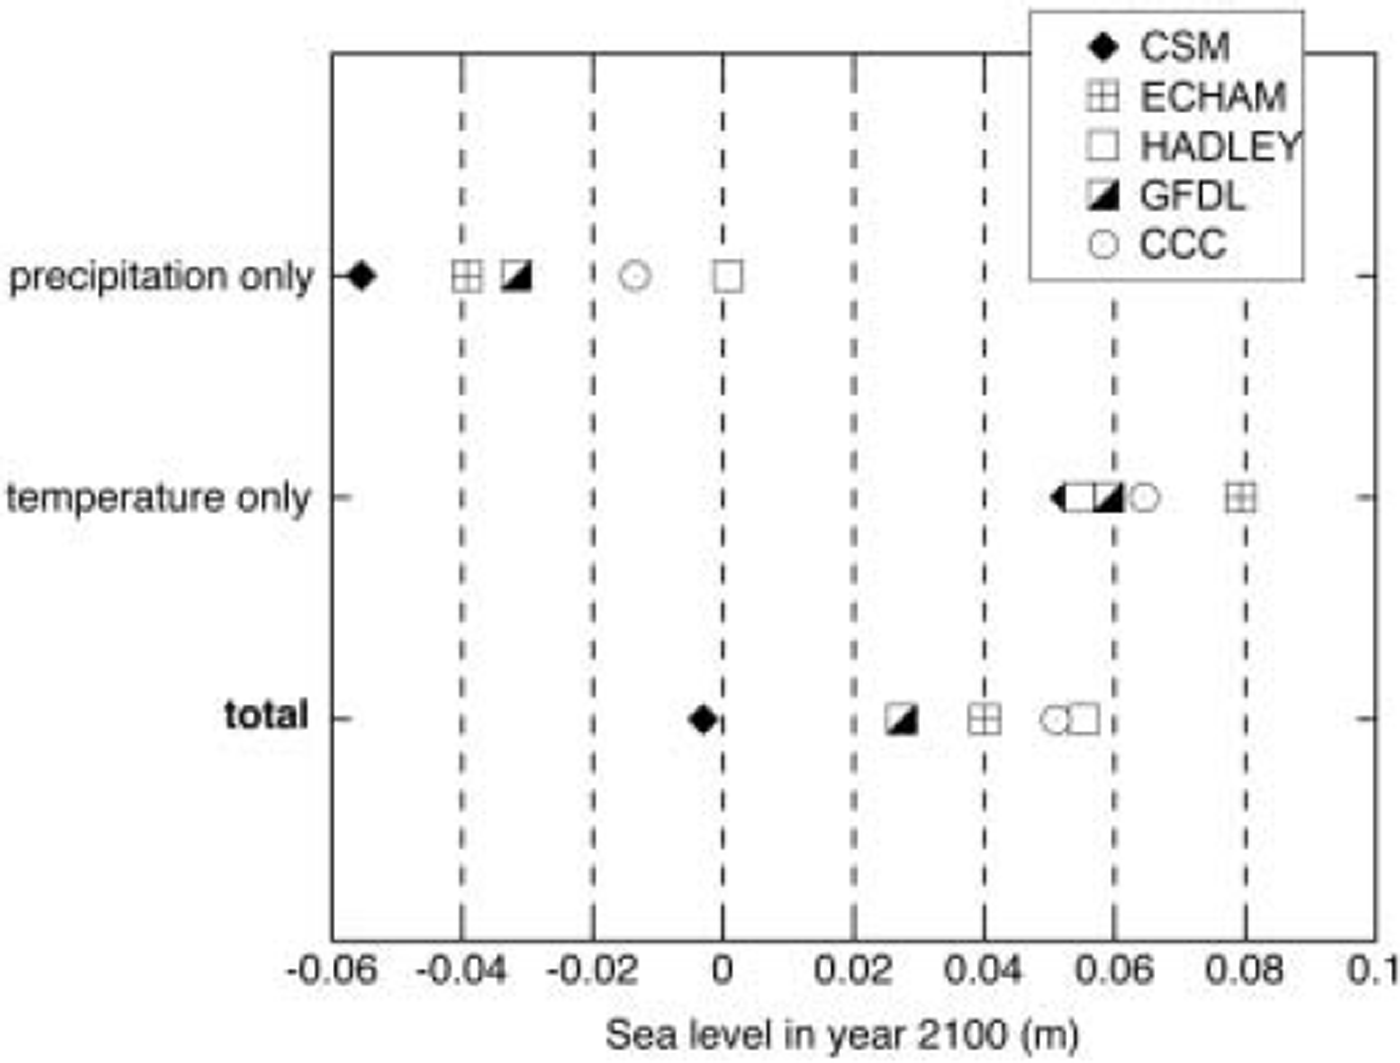
The effect of temperature change on the Arctic glaciers is rather similar for the various models. Only the ECHAM model gives somewhat larger values.
An issue that has drawn a lot of attention is the increase in snow accumulation over the Greenland ice sheet that could be expected in a warming world (e.g. Reference Ohmura, Wild and BengtssonOhmura and others, 1996; Reference Van de Wal, Wild and de WoldeVan de Wal and others, 2001). Figure 5a illustrates the differences among the models, which once more appear to be very large. The Hadley model does not predict an increase in accumulation, but in fact a small decrease. In contrast, the NCAR CSM model predicts a very large increase in accumulation, equivalent to a 5 cm sea-level drop by 2100.
The effect of precipitation changes only on sea level for Greenland (a) and Svalbard (b).
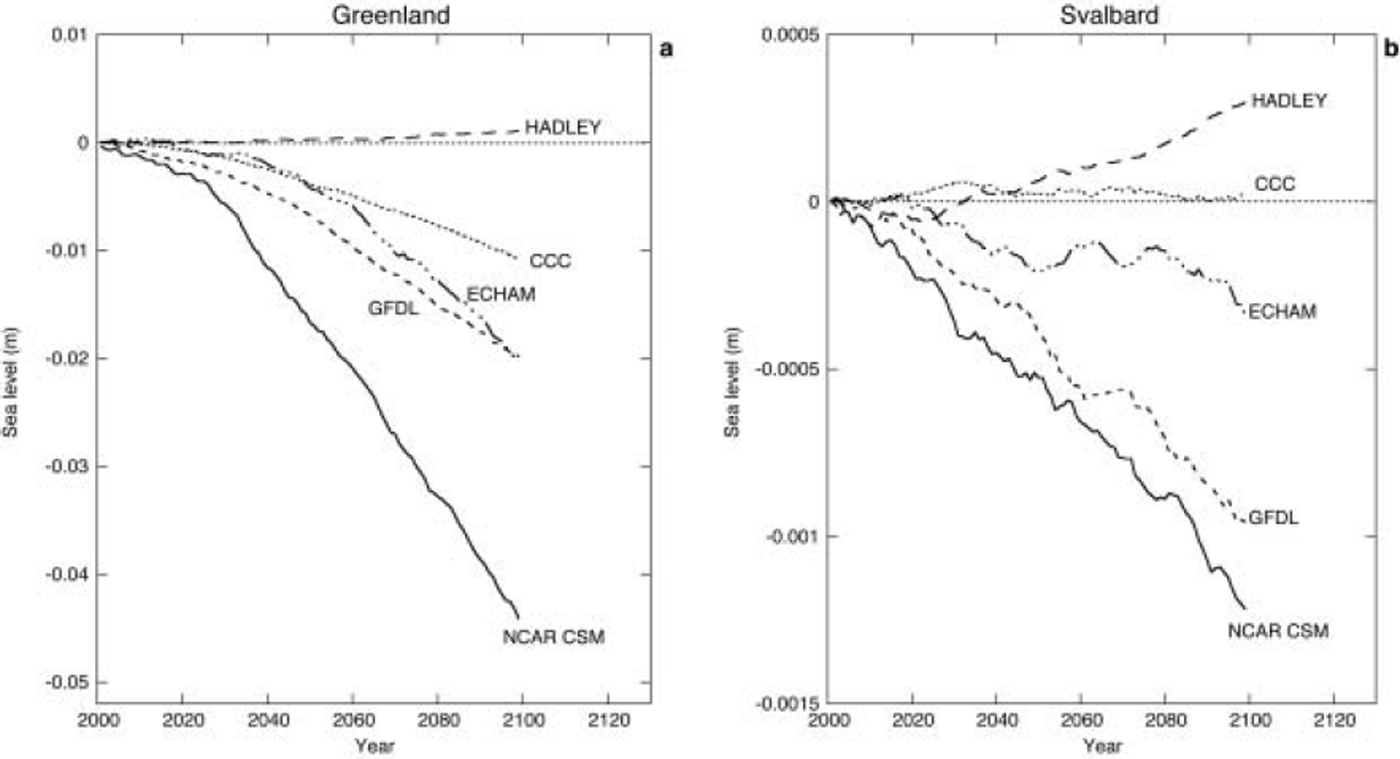
The changes in precipitation are not, of course, spatially uniform. Even between the Greenland ice sheet and Svalbard, which are not so far apart, differences are evident. This is illustrated in Figure 5b. Now the changes predicted by the GFDL model are rather similar to that predicted by the NCAR CSM model, while the Canadian model (CCC) seems to be more in agreement with the Hadley Centre model.
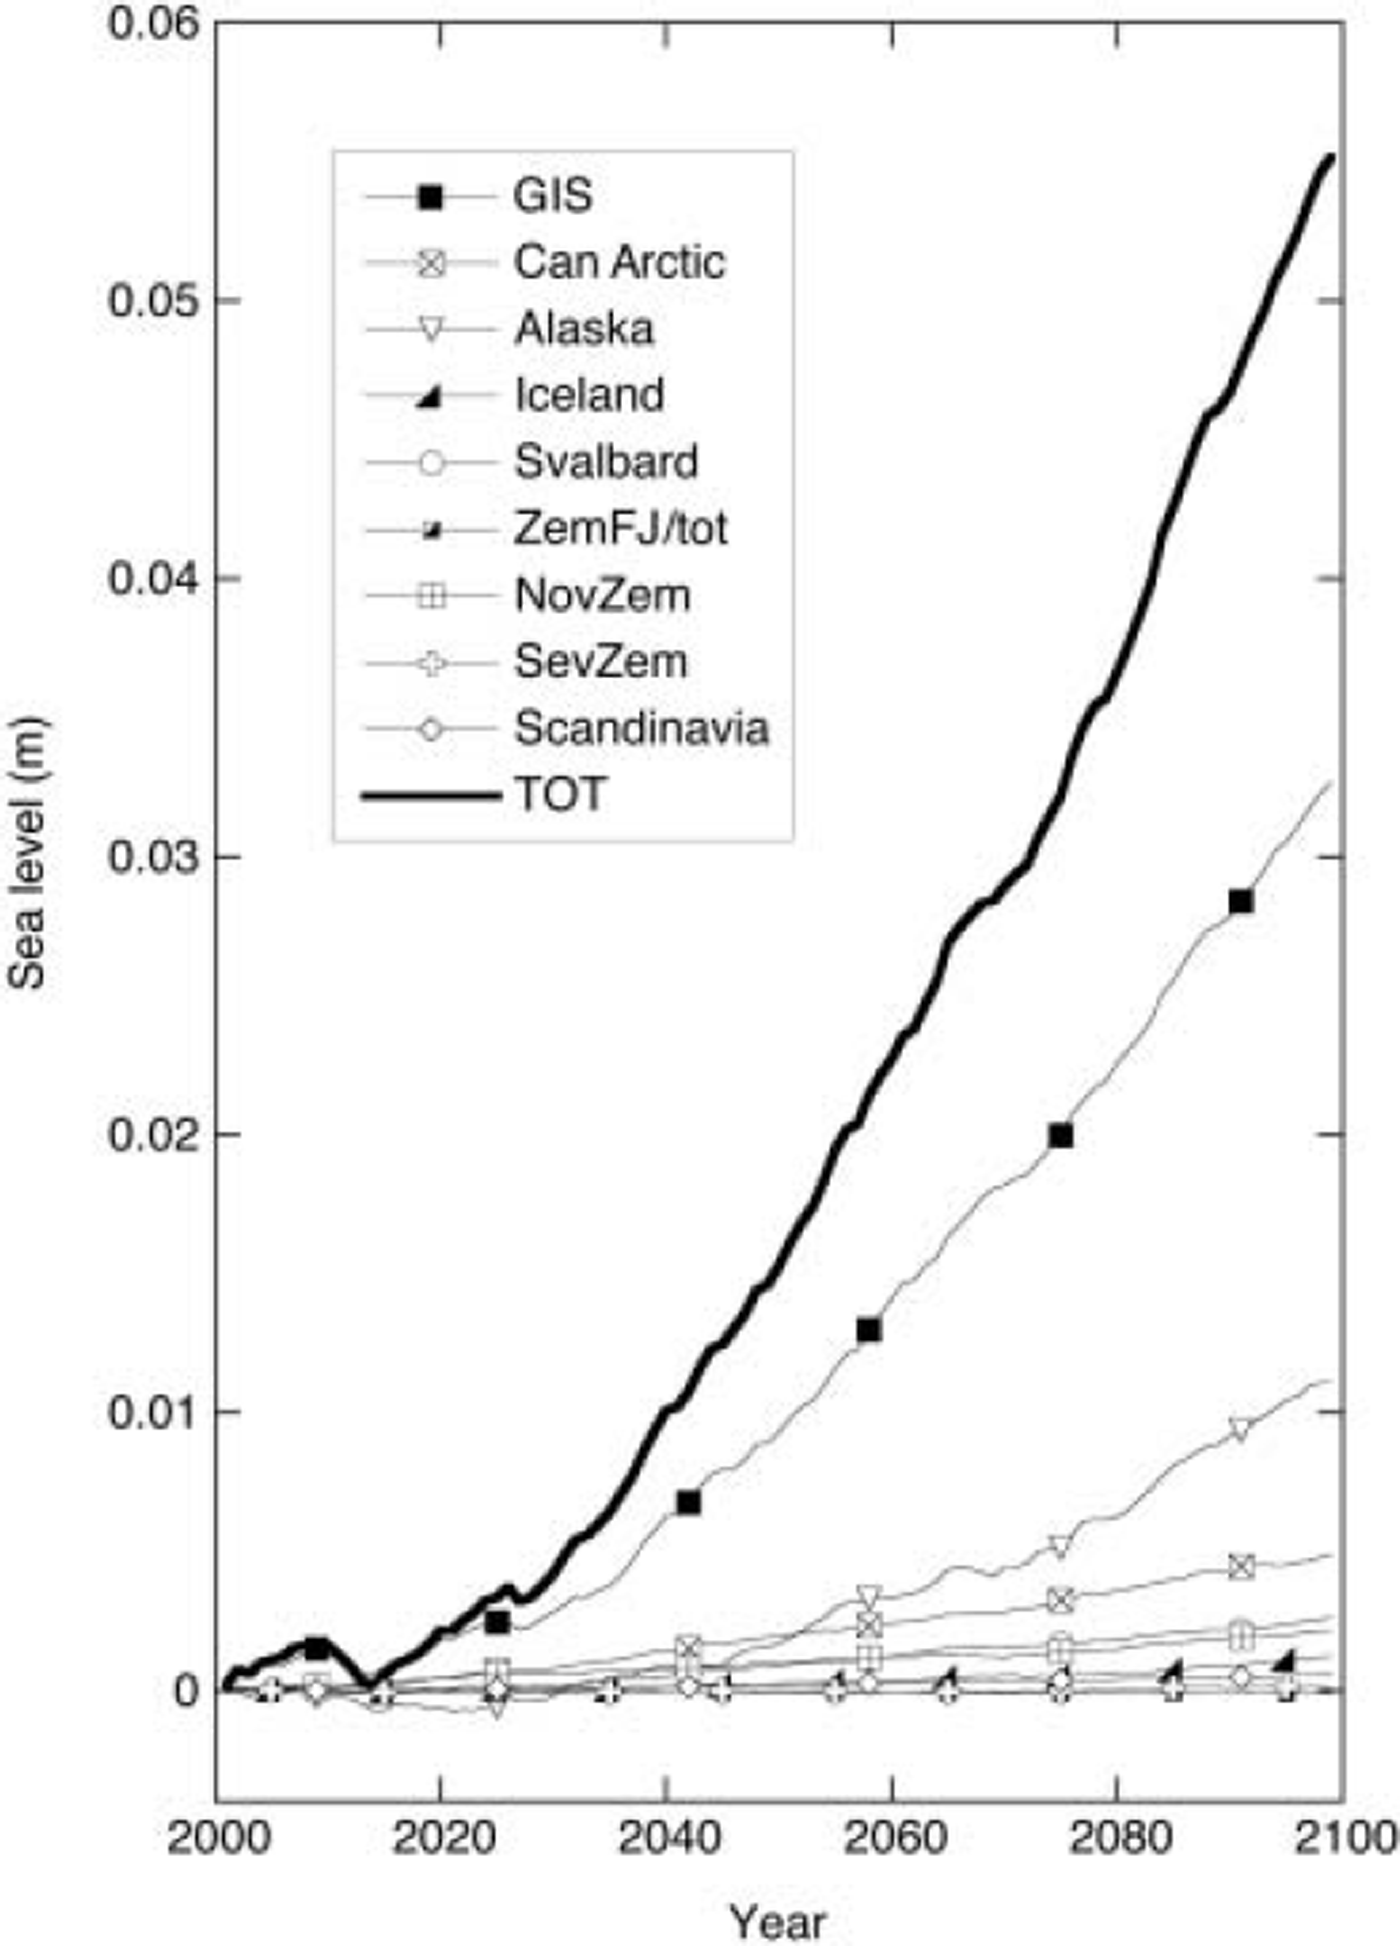
Finally, we look at the relative contributions from the different regions. Figure 6 shows the result from the ECHAM model (precipitation + temperature) as a function of time. Clearly, the largest contribution comes from the Greenland ice sheet. The glaciers in Alaska also play an important role, primarily because they are quite sensitive (Fig. 2). This is in line with the study of Reference Arendt, Echelmeyer, Harrison, Lingle and ValentineArendt and others (2002), who showed that glacier thinning in Alaska is now making a significant contribution to global sea-level rise. The individual contributions from the other regions are significantly smaller. This is a result either of the smaller area involved (e.g. Severnaya Zemlya) or of the smaller climate sensitivity (Canadian Arctic). Altogether the glaciers and ice caps of northern Canada and the Arctic islands make a contribution that is comparable to that of Alaska alone.
Contributions of the different glacier regions to sea-level change as calculated from the output of the ECHAM model (precipitation and temperature effects).
4. Concluding Remarks
The results of our calculations suggest that in the next 100 years Arctic glaciers will make a contribution to sea-level rise of 3.4 ± 2.4 cm. The large uncertainty in this value is mainly due to the differences in precipitation as predicted by the various models.
It is likely that 3.4 cm is a lower estimate since it is based on the assumption that the Arctic glaciers are currently in balance with the prevailing climate. If the imbalance corresponded to a value of 0.5 K of 6 (uniform over the Arctic region), the projected sea-level rise for 2100 would be 2.5 cm larger.
As explained in section 1 , our approach is purely static, i.e. we do not allow ice masses to change their geometry in response to a changing mass balance. We expect that for the larger ice masses this is a valid assumption in view of all the other uncertainties. For smaller glaciers, large errors may result (see also Reference OerlemansOerlemans and others, 1998). A difficult aspect of Arctic glaciers is the fact that many of them are calving glaciers. For many ice caps the loss of mass by calving is comparable in magnitude with ablation and runoff (e.g. Reference DowdeswellDowdeswell and others, 2002). So far little work has been done on the modelling of calving glaciers, and the current state of the art does not allow a meaningful estimate of how calving would increase for a given climate-change scenario and how this would work out on the geometry and surface mass balance of a glacier. However, changes are likely to be towards greater calving because greater surface melting would usually mean greater water supply to the bed and thus greater lubrication, velocity and calving (e.g. Reference Zwally, Abdalati, Herring, Larson, Saba and SteffenZwally and others, 2002).
In our calculations we used output from climate models for just one greenhouse-gas emission scenario (IPCC-B2), which is considered to be the most likely to occur. However, it is clear that other scenarios will give different estimates. Broadly speaking, we believe that the uncertainty in the estimate of sea-level rise from Arctic glaciers introduced by our simplified approach is probably smaller than the uncertainty related to the climatic forcing.
Acknowledgement
This paper is a contribution to MAGICS (Mass balance of Arctic Glaciers and Ice sheets in relation to Climate and Sea level changes), a project of the Working Group on Arctic Glaciology of the International Arctic Science Committee (IASC). This work was partly supported by the European Union through the SPICE project (EVK2-2001-00262 SPICE).



