Introduction
Antarctic snow and ice represent one of the most pristine archives for environmental studies. Studies on the Antarctic snow and ice chemistry therefore, not only provide information on the aerosol sources, but also the tropospheric transformation processes and prevailing long-range transport mechanisms and patterns. However, various scavenging processes as well as post-depositional effects influencing the atmospheric chemistry have been recorded in the snow (Whitlow et al. Reference Whitlow, Mayewski and Dibb1992, Legrand & Mayewski Reference Legrand and Mayewski1997, Röthlisberger et al. Reference Röthlisberger, Hutterli, Sommer, Wolff and Mulvaney2000, Traversi et al. Reference Traversi, Becagli, Castellano, Largiuni, Migliori, Severi, Frezzotti and Udisti2004, Kärkäs et al. 2005, among others). It is also well known that Antarctica exhibits large-scale spatial and seasonal variations in snow accumulation and chemical properties (Bertler et al. Reference Bertler, Mayewski, Aristarain, Barrett, Becagli, Bernardo, Bo, Xiao, Curran, Qin, Dixon, Ferron, Fischer, Frey, Frezzotti, Fundel, Genthon, Gragnani, Hamilton, Handley, Hong, Isaksson, Kang, Ren, Kamiyama, Kanamori, Kärkäs, Karlöf, Kaspari, Kreutz, Kurbatov, Meyerson, Ming, Zhang, Motoyama, Mulvaney, Oerter, Osterberg, Proposito, Pyne, Ruth, Simões, Smith, Sneed, Teinilä, Traufetter, Udisti, Virkkula, Watanabe, Williamson, Winther, Li, Wolff, Li and Zielinski2005). Continental-wide studies of snow deposits are thus imperative for an accurate understanding of the Antarctic variability and its influence on the climate records (Kreutz & Mayewski Reference Kreutz and Mayewski1999, Udisti et al. Reference Udisti, Becagli, Benassai, Castellano, Fattori, Innocenti, Migliori and Traversi2004, Bertler et al. Reference Bertler, Mayewski, Aristarain, Barrett, Becagli, Bernardo, Bo, Xiao, Curran, Qin, Dixon, Ferron, Fischer, Frey, Frezzotti, Fundel, Genthon, Gragnani, Hamilton, Handley, Hong, Isaksson, Kang, Ren, Kamiyama, Kanamori, Kärkäs, Karlöf, Kaspari, Kreutz, Kurbatov, Meyerson, Ming, Zhang, Motoyama, Mulvaney, Oerter, Osterberg, Proposito, Pyne, Ruth, Simões, Smith, Sneed, Teinilä, Traufetter, Udisti, Virkkula, Watanabe, Williamson, Winther, Li, Wolff, Li and Zielinski2005).
Among the various aerosol species found in coastal Antarctica, the primary aerosols are comprised essentially of sea spray and crustal components, whereas the secondary aerosols are mainly of biogenic origin since anthropogenic activities are negligible in Antarctica (e.g. Legrand & Mayewski Reference Legrand and Mayewski1997, Udisti et al. Reference Udisti, Becagli, Castellano, Traversi, Vermigli and Piccardi1999). Sea spray is the main contributor to the ionic budget of coastal Antarctic aerosols and has immense importance due to its potential role as reaction sites for reactive gases (Wagenbach et al. Reference Wagenbach, Ducroz, Mulvaney, Keck, Minikin, Legrand, Hall and Wolff1998). Although sea spray is mainly produced by bubble bursting, it could also be influenced by the wind and wind direction, as well as seasonal variations in the sea ice cover (Keene et al. Reference Keene, Pszenny, Galloway and Hawley1986, Legrand & Delmas Reference Legrand and Delmas1988, Wagenbach et al. Reference Wagenbach, Ducroz, Mulvaney, Keck, Minikin, Legrand, Hall and Wolff1998, Rankin et al. Reference Rankin, Wolff and Martin2002). The ionic composition of sea spray in Antarctic snow shows large spatial and temporal variations and is influenced by various factors like accumulation rates, elevation and relative distance from sea (Hall & Wolff Reference Hall and Wolff1998, Becagli et al. Reference Becagli, Proposito, Benassai, Flora, Genoni, Gragnani, Largiuni, Pili, Severi, Stenni, Traversi, Udisti and Frezzotti2004, Benassai et al. Reference Benassai, Becagli, Gragnani, Magand, Proposito, Fattori, Traversi and Udisti2005, Bertler et al. Reference Bertler, Mayewski, Aristarain, Barrett, Becagli, Bernardo, Bo, Xiao, Curran, Qin, Dixon, Ferron, Fischer, Frey, Frezzotti, Fundel, Genthon, Gragnani, Hamilton, Handley, Hong, Isaksson, Kang, Ren, Kamiyama, Kanamori, Kärkäs, Karlöf, Kaspari, Kreutz, Kurbatov, Meyerson, Ming, Zhang, Motoyama, Mulvaney, Oerter, Osterberg, Proposito, Pyne, Ruth, Simões, Smith, Sneed, Teinilä, Traufetter, Udisti, Virkkula, Watanabe, Williamson, Winther, Li, Wolff, Li and Zielinski2005). However, our understanding of the seasonal extent and spatial variations in the fractionation of sea spray and its interaction with secondary ionic sources is very limited.
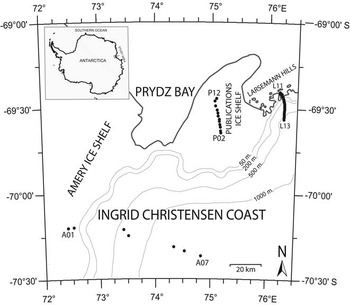
It is in this context that the present study was undertaken in order to study the major ion composition of surface snow along three transects along the Ingrid Christensen Coast of East Antarctica during the late summer of 2006–07 (Fig. 1). The main objective of the study was to evaluate the spatial variability of major ion species in snow and its implications for the atmospheric and oceanic biogeochemical processes in coastal Antarctica.
Snow sampling locations along three transects in the Ingrid Christensen Coast. Sites L11 and L13 represent the coastal and inland end members in the Larsemann transect. On the Publications Ice Shelf, P12 represents the coastal site and P02 the inland site and in the Amery transect, A01 represents the ice shelf and A07 the inland glaciers.

Materials and methods
The study region is comprised of three coastal transects (Larsemann, Publications and Amery) along the Ingrid Christensen Coast of East Antarctica (Fig. 1). The study region is influenced by marine processes and is characterized by open sea conditions until late summer with an extended sea ice season. The Larsemann Hills is an ice-free oasis on the Ingrid Christensen Coast, representing a significant portion of the ice-free area of the East Antarctic coastline. According to the Committee on Environmental Protocol of the Antarctic Treaty System, the area is environmentally fragile and falls within Antarctic Specially Managed Area No. 6 (ATCM Measure 2 (2007) Annex B). Since the mid-1980s, the Larsemann Hills region has been experiencing human interferences related to logistic activities of research stations like Progress (Russia), Zhongshan (China) as well as the summer research base of Australia (Law Base).
Since the Larsemann transect consists of both ice-free and ice-covered areas, snow sampling was also conducted along the Publications and Amery transects, which have different environmental settings. The Amery Ice Shelf is one of the major floating platforms of ice that flows down to the Prydz Bay. The Publications is a tiny ice shelf that is located between the Larsemann Hills and Amery Ice Shelf. Within the c. 20 km long Larsemann transect, closely spaced sampling was made with 12 surface snow samples from the ice-free region and 25 snow samples from the inland ice cap. This transect extended from the coast up to 550 m altitude. In the Publications transect that covered a distance of c. 24 km, 11 snow samples were collected at near sea level and are thus directly influenced by the oceanic processes. Within the Amery transect, seven samples were collected along the c. 100 km long transect from the interior ice cap away from the immediate influence of sea and at higher altitudes (up to 1200 m).
Surface snow samples were collected from 8–11 March 2007, following a major snow deposition in the area. In order to collect fresh snow samples, a helicopter was used for logistic support. Before finalising the sampling sites, an aerial reconnaissance survey was conducted to avoid areas affected by large-scale wind scouring and related glacial surface morphologies. Day time temperatures during the sampling period were within -5 to -10°C. Using oxygen isotope profiling of snow cores (c. 1 m long) collected from Larsemann transect, it was found that the region was characterized by relatively high annual snow accumulation (70–80 cm).
Sampling sites were carefully selected to avoid areas of human activity and the samples were collected at least 50 m upwind from the helicopter landing site to avoid any associated contamination. At each site, the soft snow samples were collected up to a depth of 10 cm after wearing sterile, powder-free, polymer-coated latex gloves. In order to minimize contamination, fresh sterile gloves were used for each sampling. Since the sampling was made during the late summer period and considering the high snow accumulation rate in the region, it is presumed that the samples studied represent only the summer deposition events. In the ice-free regions of the Larsemann transect (sample nos L11–L7), the samples were very fresh and soft and could belong to a single snowfall event. The snow samples were carefully collected in labelled and pre-cleaned LDPE bags, having airtight sealing. The sealed sample bags were stored in custom-made clean expanded polypropylene boxes and stored at -20°C until analysis at the National Centre for Antarctic and Ocean Research, Goa.
Sample preparation and analyses were performed following standard international protocols. Extreme care was taken to minimize contamination during processing and subsequent analysis. All tools and containers used during sample processing and analyses were pre-cleaned with Milli-Q Element water. Prior to the chemical analysis, samples were melted at room temperature in a Class 100 clean room. Major soluble anions (SO42-, Cl-, CH3SO3- and NO3-) and cations (Na+, K+, Ca2+, Mg2+ and NH4+) were measured in the melted snow samples using ion chromatographic techniques. A Dionex ICS-2500 reagent-free ion chromatography (RF-IC) system placed in a Class 100 clean room and equipped with an automated EG50 Eluent Generator Module and CD25 conductivity detector was used for the major ion analysis. The cations were separated on an IonPac CS17 (4 mm) column with Methanesulfonic acid (MSA) as eluent at a flow rate of 1.0 ml min-1, using the standard gradient method and an IonPac CG17 Guard column with a CSRS-ULTRA Cation Self Regenerating Suppressor. The anions were separated on an IonPac AS11-HC (4 mm) column with Potassium Hydroxide (KOH) at 1.2 ml min-1 as eluent, using gradient method and an IonPac AG11-HC Guard column, with an ASRS-ULTRA (4 mm) Anion Self Regenerating Suppressor. The sample injection volume for both the analyses was 100 μl. Calibration was done using IV (Inorganic Ventures) high-purity standards. Since the chemical analyses were carried out on melted snow samples, for convenience of reporting, the concentrations are given here in micrograms per litre (μg l-1). The detection limits of the RF-IC system based on bottle blanks for all ions reported were ⩾1 μg l-1 and the approximate blank levels of the cleaned LDPE bags were measured at 1–5 μg l-1. In order to confirm the quality of measurements, chromatographic standards were analysed on a daily basis throughout the study. The estimated analytical precision based on the daily scrutiny of standards was better than 10%.
Results and discussion
Sea-salt components and the crustal contribution
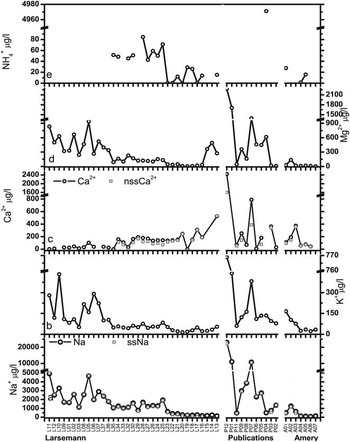
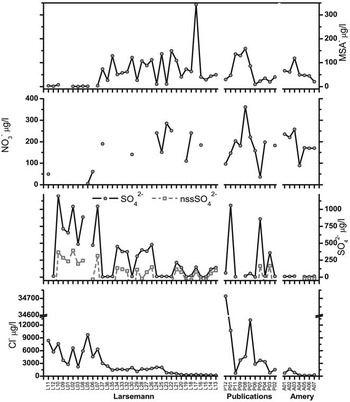
The major ionic concentrations along the three transects are given in Figs 2 & 3. Concentrations of sea-salt ions such as Na+, Cl-, K+ and Mg2+ showed identical variations in all three transects. Within the Larsemann transect, the concentrations were the highest in samples collected close to the sea (L11) and decreased with distance from the coast and increase in altitude. This region is characterized by open sea without any sea ice cover and the sampling sites were on top of steep cliffs. Snow samples from the Publications Ice Shelf showing anomalously high sea spray ions were collected from locations at mean sea level and very close to the ice edge. The Publications transect is characterized by the occurrence of stretches of sea ice in the region even during the sampling period (late summer). A steep gradient in the sea-salt ion concentrations was observed from ice edge to interior sites of the Publications transect, with very low values at stations P11 and P07. Such a discontinuity within the short distance from sea could be due to local wind scouring, leading to sampling artefacts. Snow samples from the Amery transect contained relatively lower concentrations of sea-salt ions, with a slight decrease from A01–A07 samples, consistent with increased distance from the sea. The observed slight decrease in sea-salt content was due to the change in altitude from <50 m to 1200 m. Therefore, the ionic data from all three transects confirm that the distance from the ice edge and presence or absence of sea ice are important factors that control the marine aerosol composition in the coastal snow deposits.
Concentrations (in μg l-1) of major cations (Na+, K+, Ca2+, Mg2+ and NH4+) along the Larsemann (L11–L13), Publications (P12–P02) and Amery (A01–A07) transects (see Fig. 1). The estimated sea-salt sodium (ssNa+) concentrations are plotted along with the Na+ record, as well as the non-sea-salt calcium (nssCa2+) along with the Ca2+ record for comparison. Note the break in scales.

Concentrations (in μg l-1) of major anions (Cl-, SO42-, NO3- and MSA) along the Larsemann, Publications and Amery transects (see Fig. 1). The estimated non-sea-salt sulphate (nssSO42-) concentrations are plotted along with the SO42- record. Note the break in scale for Cl- data.

Among the primary aerosols, the concentration of Na+ and Cl- are directly related to proximity to the sea and Na+ is considered to be the most conservative ionic proxy for the sea spray in coastal Antarctica (Traversi et al. Reference Traversi, Becagli, Castellano, Largiuni, Migliori, Severi, Frezzotti and Udisti2004, Kärkäs et al. Reference Kärkäs, Teinila, Virkkula and Aurela2005). Ca2+ has mainly two sources in Antarctica: continental dust and sea spray (Legrand & Mayewski Reference Legrand and Mayewski1997). Recent studies have indicated that Na+ in Antarctic snow may also have dust as an additional source (Röthlisberger et al. Reference Röthlisberger, Mulvaney, Wolff, Hutterli, Bigler, Sommer and Jouzel2002, Benassai et al. Reference Benassai, Becagli, Gragnani, Magand, Proposito, Fattori, Traversi and Udisti2005) and are estimated as follows:


where nssCa2+ is the non-sea-salt Ca2+, ssNa+ is the sea-salt Na+, Ca+ and Na+ are the measured concentrations of these ions in snow and Rm and Rt are the mean ratios of Ca2+/Na+ in the marine aerosols and average crust, respectively. The values of Ca2+/Na+ in the marine aerosols (Rm) and crust (Rt) are assumed to be 0.038 and 1.78 (Bowen Reference Bowen1979).
The ssNa+ content of the snow samples from the study region closely mimicked the total Na+ content, suggesting that the sea spray predominantly contributed to the Na+ measured in the snow samples (Fig. 2a). Compared to this, the nssCa2+ data revealed that the crustal contribution dominated the Ca2+ record in all sites except at some coastal stations of the Larsemann transect, where the Ca2+ content was very low (Fig. 2c). The present study thus confirms that continental dust primarily contributes to the Ca2+ in Antarctic snow during the summer (Legrand & Mayewski Reference Legrand and Mayewski1997).
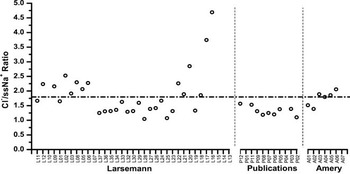
The Cl-/ssNa+ ratios were estimated to evaluate the relative fractionations among the key sea-salt species. Within the study region, the ratios were found to vary between 4.7–1.05, with the highest values measured for a few samples from the interior Larsemann transect (Fig. 4). Some samples from the ice-free areas of the Larsemann transect also contained relatively higher Cl-/ssNa+ ratios than that in seawater (1.8). However, in several inland sites of the Larsemann and Publication transects, slightly lower ratios were observed. High Cl-/ssNa+ ratios in coastal Antarctic snow or ice deposits have been attributed to scavenging of gaseous HCl present in the air, and/or fractionation of sea-salt particles during more intense circulation (Udisti et al. Reference Udisti, Becagli, Castellano, Traversi, Vermigli and Piccardi1999, Benassai et al. Reference Benassai, Becagli, Gragnani, Magand, Proposito, Fattori, Traversi and Udisti2005, Thamban et al. Reference Thamban, Chaturvedi, Rajkumar, Naik, D’Souza, Singh, Rajan and Ravindra2006). Considering the fact that Cl-/ssNa+ ratios show significant variability within short distances in the region, the localized crustal contribution appears to be influencing the Cl-/ssNa+ ratios in the study area. It is proposed that the soil dust material in the coastal ice-free area as well as the nunataks in the inland sites might have contributed some Cl- to the snow, leading to the increased Cl-/ssNa+ ratios in these sites. The high Cl-/ssNa+ ratios (up to 4.7) in the interior sites of the Larsemann transect were also characterized by very high crustal contribution as reflected in the nssCa2+ concentration. Another probable reason for the enhanced Cl-/ssNa+ ratios in the coastal ice-free sites of the Larsemann transect could be the localized anthropogenic input of Cl- due to increased human activities by various research communities in the Larsemann Hills region.
Spatial distribution of Cl-/ssNa+ ratios along the Larsemann, Publications and Amery transects. The dotted horizontal line represents the seawater reference Cl-/Na+ ratio (1.8).

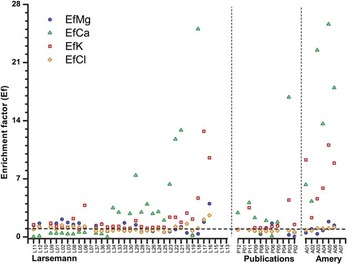
Estimation of the enrichment factors (Ef) of sea-salt ions provides a quantitative measure of any addition or depletion of the ions with respect to its reference values in the seawater. The Ef of an ionic component A is estimated as follows:

where ([A]/[ssNa+])snow is the ratio of concentrations of any ionic component and ssNa+ in the studied snow and ([A]/[Na+])seawater are the reference values of these in the seawater. Based on the generalized major ion composition of seawater (Chester Reference Chester2003), the reference values of ([A]/[Na+])seawater used in this study are: 1.8 (Cl-/Na+), 0.037 (K+/Na+), 0.12 (Mg2+/Na+), 0.038 (Ca2+/Na+) and 0.25 (SO42-/Na+).
The Ef(K+) data revealed that at the coastal stations of the Larsemann and Publications transects (Fig. 5), K+ is supplied mainly from the sea spray. Samples from the Amery transect as well as some few inland stations of the Larsemann and Publication transects showed enrichment by a factor of 13, suggesting some local sources of K+. Such local crustal inputs are supported by the nssCa2+ data in these areas. The Ef(Mg2+) values did not indicate any significant enrichment compared to seawater values, except at some stations in the inland Larsemann and Amery transects (Fig. 5). The Ef(Ca2+) data showed significant Ca2+ enrichment in several samples from the Larsemann, Publication and Amery transects (Fig. 5). It has been suggested that areas of locally exposed bedrock can affect the chemistry of surface snow, in addition to the long-range transport of crustal material (Kreutz & Mayewski Reference Kreutz and Mayewski1999). Within the summer snow deposits of the study area, the Ef(Ca2+) data also confirms a dominant crustal source for Ca2+ and the contribution from sea spray appears to be relatively minor. The enhanced Ca2+ content in snow samples from inland sites adjacent to the nunataks suggests that the contribution is predominantly local and long-range transport may not be significant in the region. The Ef (Cl-) also confirms some additional sources of Cl- in the inland sites of the Larsemann transect.
Enrichment factors (Ef) of Mg2+, K+, Ca2+ and Cl- in snow samples from the Larsemann, Publications and Amery transects. The dotted horizontal line represents the reference line above which the values are indicative of the order of enrichment.

Sulphur aerosol components in the snow and its implications
Since both natural and anthropogenic sulphur compounds closely interact with the global climate system, knowledge of distribution of various sulphur species in snow deposits in coastal Antarctica is useful in understanding the biogeochemical pathways. Among the various sulphur compounds, dimethylsulphide (DMS) is the most important species in the atmosphere having immense climatic implications. The atmospheric oxidation of DMS through complex pathways leads to the formation of H2SO4 and CH3SO3H (methanesulphonic acid, MSA). While MSA is exclusively produced by marine biological productivity, SO42- can have inputs from volcanic eruption and anthropogenic sources, in addition to the well known contribution from sea spray (Legrand & Pasteur Reference Legrand and Pasteur1998).
Distribution of SO42- and MSA in the surface snow in the study region are given in Fig. 3. The excess sulphate (nssSO42-) content unrelated to the sea spray from the total sulphate concentration can be estimated using sea-salt sodium (ssNa+) as reference species:

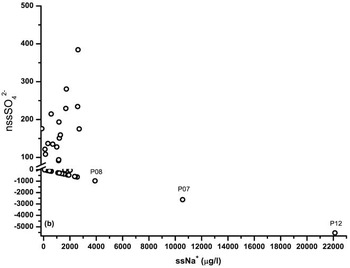
where 0.252 is the SO42-/Na+ ratio in seawater (Chester Reference Chester2003) and SO42- and ssNa+ are the concentrations of these ions in snow. The estimated nssSO42- values broadly mimicked variations of the SO42- data (Fig. 3b). However, many samples from the Publications and Amery transects indicated extremely negative values, suggesting a complicated relationship between Na+ and SO42- in coastal Antarctica. For samples with positive nssSO42- values the ssNa+ vs nssSO42- plot showed a positive relationship (r 2 = 0.5, not shown), suggesting a common source (ocean). Minikin et al. (Reference Minikin, Legrand, Hall, Wagenbach, Kleefeld, Wolff, Pasteur and Ducroz1998) have shown that the concentrations of nssSO42- at coastal Antarctic sites are synchronous with the biological productivity south of 60°S.
Compared to the above, an overriding negative correlation was shown between the ssNa+ and nssSO42- data for samples that are characterized by exceptionally high ssNa+ concentration (Fig. 6). Similar sea-salt fractionation in coastal Antarctic snow has been reported earlier, which was attributed to an overestimation of SO42-/Na+ ratio in seawater, especially during the formation of frost flowers during the winter (Wagenbach et al. Reference Wagenbach, Ducroz, Mulvaney, Keck, Minikin, Legrand, Hall and Wolff1998). Studies from coastal Antarctica revealed that the frost flowers are extremely saline and fractionated in sea-salt ions, with SO42- being highly depleted in relation to Na+ (Wagenbach et al. Reference Wagenbach, Ducroz, Mulvaney, Keck, Minikin, Legrand, Hall and Wolff1998, Rankin et al. Reference Rankin, Wolff and Martin2002). The estimation of nssSO42- in such regions using bulk seawater composition would be inaccurate and it is necessary to correct the estimated nssSO42- using a much lower than normal bulk seawater SO42-/Na+ ratio (Minikin et al. Reference Minikin, Legrand, Hall, Wagenbach, Kleefeld, Wolff, Pasteur and Ducroz1998, Wagenbach et al. Reference Wagenbach, Ducroz, Mulvaney, Keck, Minikin, Legrand, Hall and Wolff1998).
Plot of sea-salt sodium (ssNa+) vs non-sea-salt sulphate (nssSO42-) for all samples from the study area. Samples with extreme negative values are identified.

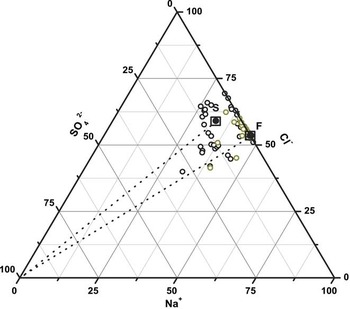
To further understand the SO42-/Na+ ratio fractionation in the snow samples, a ternary diagram of Na+-Cl--SO42- was plotted (Fig. 7). In this diagram, the reference ion composition of seawater based on the data given in Chester (Reference Chester2003) is denoted as ‘S’, and the composition of frost flowers as given by Rankin et al. (Reference Rankin, Wolff and Martin2002) is marked ‘F’. The plot revealed large scatter among the data and confirms that several samples significantly deviate from the reference value of seawater (Fig. 7). The majority of the snow samples from the Publication and Amery transects as well as some from the Larsemann transect were extremely fractionated and clustered around ‘F’ in the ternary diagram. It is evident that although samples in the present study represent only summer snowfall events, the SO42- (and Na+) are fractionated substantially with reference to its source (seawater). The study area is characterized by delayed open sea conditions and extended sea ice season that could provide favourable conditions for frost flower formation and associated SO42-/Na+ fractionation. Such significant sea-salt fractionation in the region also cautions against using the generalized seawater SO42-/Na+ values in coastal Antarctica.
Ternary diagram of Na+, Cl- and SO42-. The reference ion composition of seawater is denoted as ‘S’ and the composition of frost flowers (see text) is marked ‘F’. The light coloured circles represent samples from the Publications and Amery transects.

Within the samples from ice free areas of Larsemann Hills, the MSA concentrations were below the detection limit and the values increased substantially (up to 343 μg l-1) for samples from the ice cap region. The extremely low values of MSA in the ice-free areas of the Larsemann transect may be due to the fact that the snow samples of this transect represent a single event, compared to possibly more events in the summer deposits at inland sites. The MSA is a complex sulphur component affected by the migration and re-emission processes (Becagli et al. Reference Becagli, Proposito, Benassai, Gragnani, Magand, Traversi and Udisti2005). The locally increased wind activity in this region and resultant loss of MSA from snow in the area could also be another possible explanation for the low MSA values.
Comparison of nssSO42- and MSA concentration in the snow samples revealed that both fluctuated independently of each other (Fig. 3). Such a poor relationship in the study region may be due to: 1) the complicated relationship between the sea-salt Na+ and SO42- in the region and subsequent error in the estimation of nssSO42-, 2) conditions that influence primary productivity and phytoplankton dynamics, 3) atmospheric conditions that influence the oxidation pathways of DMS (O’Dwyer et al. Reference O’Dwyer, Isaksson, Vinje, Juahiainen, Moore, Pohjola, Vaikmäe and van de Wal2000), and 4) possible localized biological sources of sulphur components (Schall et al. Reference Schall, Heumann, DE Mora and Lee1996). In order to identify the actual biogeochemical process influencing the complicated relationships between nssSO42- and MSA in coastal snow samples, a detailed analysis of the biological components of snow samples is necessary. Furthermore, it would also be crucial to investigate snow deposits covering an entire season or longer along a longer transect, reaching to higher altitudes.
Conclusions
Glacio-chemical analysis of surface snow deposits from the Ingrid Christensen Coast revealed that the sea spray contribution dominated the supply of Na+, Cl-, K+ and Mg2+, whereas the estimated enrichment factors suggest that crustal input was the primary source for Ca2+. The distribution pattern of sea spray constituents was influenced by distance from the sea as well as altitude. Significant shifts in Cl-/ssNa+ ratios among the inland sites suggest that fractionation of Cl- is active and Na+ is the most conservative proxy of sea spray contribution. The estimated non-sea-salt sulphate (nssSO42-) in the snow samples revealed large variations with significant fractionation similar to that observed in frost flowers. The sulphur components (nssSO42- and MSA) in snow deposits varied independently of each other, possibly influenced by local processes and biological activities. A quantitative understanding of the biogeochemical cycling in Antarctic snow layers requires snow sampling that extends for a few seasons along coastal to inland transects reaching to higher altitudes.
Acknowledgments
We thank the Ministry of Earth Sciences, Government of India, for the support and members of the XXVI InSEA, particularly K.P. Krishnan and P.C. George, for field assistance. We also thank Ashish Paiginkar and Anand Chodankar for the analytical support and Yatheesh (NIO) for help with Generic Mapping Tools (GMT). The constructive comments of the reviewers are also gratefully acknowledged.