Introduction
Alloys with optimum density and superior high-temperature properties are in great demand in the aero engines. Recently, a new class of materials with multiple elements of equi-atomic or near-equi-atomic proportion are known to form simple crystal structures (FCC/BCC) and exhibit better properties. These are called high-entropy alloys (HEAs) or multicomponent alloys (MCAs) or complex concentrated alloys (CCAs) [Reference Yeh, Chen, Lin, Gan, Chin, Shun, Tsau and Chang1, Reference Cantor, Chang, Knight and Vincent2]. Recently, refractory high-entropy alloys (RHEAs) have been considered as promising materials for high-temperature applications [Reference Senkov, Miracle, Chaput and Couzinie3]. A generic way of defining the refractory alloys is as those which comprise elements whose melting point is above 2000 °C. Those alloys which fulfill this criterion are called the first-generation refractory alloys. The major drawback of the first-generation RHEAs is their high density, poor oxidation, and corrosion resistance. Thus, in the second-generation RHEAs, some of the heavier elements are replaced with Cr, Ti, Zr, and Al to reduce the density and to improve the corrosion and/or oxidation resistance [Reference Eshed, Larianovsky, Kovalevsky, Popov, Gorbachev, Popov and Katz-Demyanetz4].
These alloys are used for niche applications such as (i) propulsion and energy conversion systems (rocket and re-entry systems), (ii) aerothermally heated hypersonic vehicles, (iii) high-Mach jet propulsion, and (iv) thrust vector controls in advanced fighters. However, the application of these alloys is restricted due to their unique but constraining properties such as poor oxidation resistance, high density, low tensile and creep strength at elevated temperatures, high ductile–brittle transition temperature, and challenges in fabrication [Reference Jaffee, Harris and Promisel5].
It has been inferred from the literature reports that most of the RHEAs have BCC or B2 as the major phase with Laves/Al3Zr5/M5Si3 as the secondary phases [Reference Senkov, Miracle, Chaput and Couzinie3]. The Laves phases that form in these RHEAs are of C14 (hexagonal) or C15 (cubic) structure. Although the Laves phase increases the strength of the alloy, it decreases the room temperature ductility. Thus, an optimum fraction of these phases is expected to give better high-temperature strength with adequate room temperature ductility. Therefore, exploring more RHEA systems becomes necessary. Accordingly, a novel RHEA system, CrMoNbTiW, is explored in the present study.
Apart from the composition of the alloy, the synthesis route is reported to have resulted in a wide variety of microstructures. Almost 95% of the reported RHEAs are synthesized through casting and followed by annealing/homogenization/hot isostatic pressing [Reference Senkov, Miracle, Chaput and Couzinie3]. Although the casting route yields relatively near-equilibrium structures, homogenization and/or annealing is a necessary step in most cases to eliminate segregation. Mechanical alloying (MA) is a well-established simple powder metallurgy route to synthesize high-temperature materials as well as to achieve homogenous mixing of elements [Reference Hewitt and Kibble6, Reference Suryanarayana7, Reference Murty and Ranganathan8]. Moreover, MA offers the advantage of attaining finer grain size. It has been shown that fine-grained W alloys show lower ductile-to-brittle transition temperature (DBTT) and improved ductility as compared to the coarser ones [Reference Wei, Zhang, Schuster, Ramesh, Valiev, Kecskes, Dowding, Magness and Cho9]. Generally, MA is followed by a consolidation step at higher temperatures to obtain dense compacts. Due to longer durations involved during conventional sintering at high temperatures (>0.6 T m), grain size increases drastically. In recent times, spark plasma sintering (SPS) has been utilized to retain the nanocrystalline nature of W-base alloys [Reference Srivastav10]. Moreover, HEAs synthesized through MA and SPS exhibit homogeneous microstructures with attractive mechanical properties [Reference Zhang, Fu, Zhang, Wang, Lee and Niihara11, Reference Praveen, Basu, Kashyap and Sankar12, Reference Vaidya, Karati, Marshal, Pradeep and Murty13]. However, there are very few reports that deal with the synthesis of RHEAs through MA and subsequent powder consolidation [Reference Kang, Lee, Ryu and Hong14, Reference Waseem and Ryu15]. Therefore, it is essential to study the synthesis of RHEAs through MA and SPS route to understand its influence on phase evolution and microstructural stability.
In the present study, an attempt is made to synthesize nanocrystalline CrMoNbTiW, an equi-atomic RHEA, through MA–SPS route. The rationale behind choosing such an alloy comprising these elements is the following. The elements such as Mo, Nb, and W aid in retaining the strength at high temperatures [Reference Juan, Tsai, Tsai, Lin, Wang, Yang, Chen, Lin and Yeh16], and Cr and Ti help in stabilizing the nanocrystalline nature of W-base alloys even after sintering [Reference Chookajorn17]. Various aspects of phase evolution have been investigated. Besides, CALculation of PHAse Diagram (CALPHAD) together with simple empirical rules of phase formation criteria in HEAs has been utilized to understand the phase evolution while comparing with that from the experiments.
Results and discussion
Phase evolution during MA
Optimization of the MA parameters
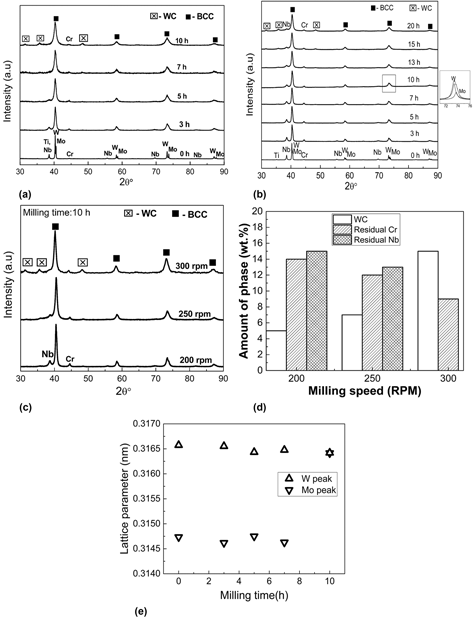
In this study, among the MA parameters, milling speed was chosen as the variable, as it dictates the energy imparted to the powders from the balls. The total energy transfer determines the extent of alloying, contamination, and grain refinement [Reference Pabi, Joardar and Murty22, Reference Joardar, Pabi and Murty23]. The milling was carried out at milling speeds of 200, 250, and 300 rpm to understand the influence of MA parameters on the phase evolution. X-ray diffractograms as a function of milling time at 300 (0–10 h) and 200 (0–20 h) rpm are presented in Figs. 1(a) and 1(b), respectively. It can be inferred from Fig. 1(a) that with an increase in milling time beyond 3 h at 300 rpm, Ti/Nb peaks shift closer to W peak. However, the smaller peak broadening and the absence of peak shift of W suggest limited solubility of elements into it. Also, the WC contamination becomes prominent after 7 h of milling. At the end of 10 h, a single phase BCC with residual Cr was observed.
XRD patterns indicating the phase evolution in CrMoNbTiW during MA as a function of milling time at (a) 300 rpm and (b) 200 rpm, (c) XRD patterns after 10 h of MA at different milling speeds, (d) amount of residual phases after 10 h of MA at different milling speeds, and (e) lattice parameters of Mo and W with milling time at 200 rpm.

In the case of 200 rpm [Fig. 1(b)], milling was continued up to 20 h to ensure complete alloying. Although a single-phase BCC with residual Cr and Nb forms after 20 h, WC contamination becomes evident after 10 h of MA. In the case of 250 rpm, the 10-h MA powder shows the formation of BCC solid solution along with residual Cr, Nb, and WC contamination. From the XRD pattern [Fig. 1(c)], the amount of residual Cr and Nb at different milling speeds after 10 h of MA is calculated using relative intensity ratio (RIR) method. The amounts of the residual phases with increasing milling speeds are as shown in Fig. 1(d). Based on Figs. 1(a)–1(d), the following points can be inferred: (i) the amount of WC contamination increases with the increase in milling speeds, and (ii) the amount of residual Cr and Nb decreases with the increase in milling speeds indicating the extent of MA is more at higher rpm. Hence, to minimize the WC contamination, milling up to 10 h at 200 rpm was considered as the optimum condition for MA with some compromise in the extent of alloying. The effect of milling speed on the powder morphology is discussed in the Supplementary material Sec. S1.
Accordingly, all the further discussion is on the powders that were milled for 10 h at 200 rpm milling speed. The lattice parameter was calculated for both Mo and W peaks as a function of milling time using Nelson–Riley function [Reference Nelson and Riley24] [Fig. 1(e)]. The lattice parameter of the BCC phase formed in the alloy after 10 h is 0.3164 nm, which is close to that of W. At 10 h, two BCC (Mo- and W-based solid solutions) phases along with residual Cr and Nb are observed. The presence of two BCC phases is deconvoluted and shown in the inset in Fig. 1(b). The carbon content after MA was measured to be 7.7 at.%.
Characterization of the MA powder synthesized at the optimized condition
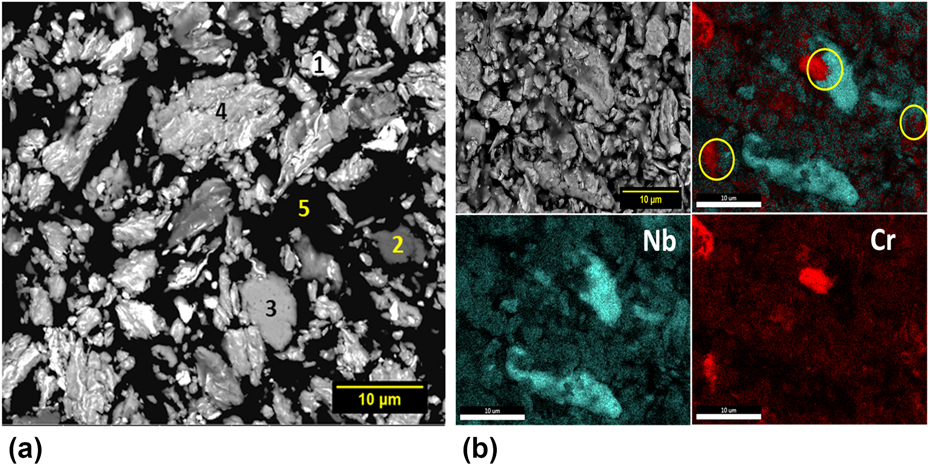
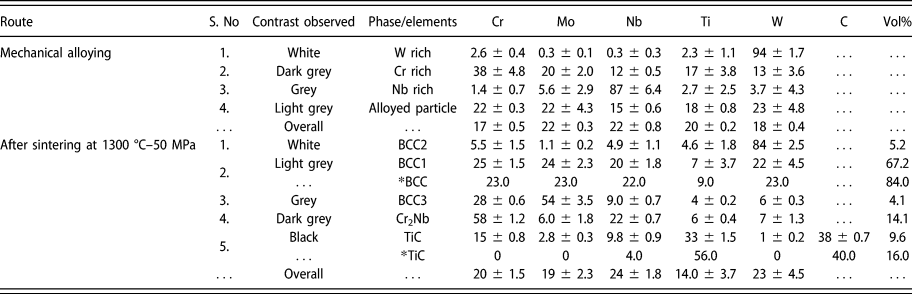
The BSE-SEM micrograph of the powder that was MA-ed at optimum conditions of 200 rpm and 10 h is shown in Fig. 2(a). Through EDS analysis (Table I), various phases are represented with the numbers 1 (W-rich particle), 2 (Cr-rich particle), 3 (Nb-rich particle), 4 (an alloyed BCC phase), and 5 (mounting resin) in Fig. 2(a). The bright W-rich particle appears to have fragmented and embedded in the soft grey BCC phase with an elongated morphology. The residual Cr-rich and Nb-rich features are indicated as dark grey and light grey phase in the elemental mapping of the powder as shown in Fig. 2(b).
(a) Microstructure and morphology of 10 h MA powder of CrMoNbTiW milled at 200 rpm. The numbers 1, 2, 3, 4, and 5 represent W-rich particle, Cr-rich particle, Nb-rich particle, an alloyed BCC phase, and mounting resin, respectively, and (b) elemental mapping of the MA powder showing the presence of residual Cr- and Nb-rich regions.

Elemental composition (at.%) of various microstructural features observed after MA and sintering of CrMoNbTiW. The * indicates the values obtained using CALPHAD.

As per the Hume-Rothery rules, crystal structure and atomic size difference play a major role in the extent of solid solubility. Among the binaries in the alloy, the properties of Mo and W in terms of crystal structure (BCC), atomic radius (136 pm for Mo and 137 pm for W), and electronegativity (2.16 for Mo and 2.36 for W) are similar and obeys Hume-Rothery rules, which result in the solubility of Mo into W [Reference Srivastav, Panindre and Murty25]. The incomplete dissolution of Nb can be explained based on two different approaches, i.e., based on MA parameters and phase diagram inspection. Considering the milling speed, it is interesting to note that Nb is completely dissolved when milled at 300 rpm for 10 h milling, but the dissolution of Nb is incomplete with the milling speed of 200 rpm for the same duration. Thus, the energy transfer of 24 kJ/g calculated as per Burgio’s model [Reference Burgio, Iasonna, Magini, Martelli and Padella26] at 200 rpm for 10 h is not sufficient enough to complete the dissolution of Nb. For complete dissolution of Nb, an energy transfer of 54 kJ/g (calculated for 10 h at 300 rpm) is sufficient. As discussed by Pabi et al., the alloy is believed to follow continuous diffusive mixing and is consistent with the complete dissolution of Nb at 300 rpm for 10 h [Reference Murty and Ranganathan8]. When phase diagrams of binary subsystems in CrMoNbTiW alloy are inspected, most of them are isomorphous [Reference Zhang, Liu and Jin27, Reference Wang, Wang, Guo, Liu, Ohnuma, Kainuma and Ishida28, Reference Naidu, Sriramamurthy, Rama Rao and Massalski29, Reference Jonsson30]. However, Cr–Mo, Cr–W, Ti–Mo, and Ti–Nb systems show a miscibility gap which results in their limited solid solubility [Reference Cupid, Kriegel, Fabrichnaya, Ebrahimi and Seifert31, Reference Turchi, Kaufman and Liu32, Reference Costa Neto, Fries, Lukas, Gama and Effenberg33]. Moreover, Cr has a positive enthalpy of mixing with Mo and W, which indicates its limited solid solubility at room temperature [Reference Takeuchi and Inoue34]. It is worthwhile to note that the present results are consistent with those of Diliberto et al. [Reference Diliberto, Kessler, Rapin, Steinmetz and Berthod35], who have also observed the presence of limited solubility of Cr in the Cr–Mo–W system.
Consolidation of mechanically alloyed (MA) powders of CrMoNbTiW
Optimization of sintering condition
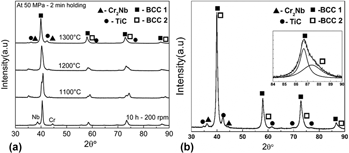
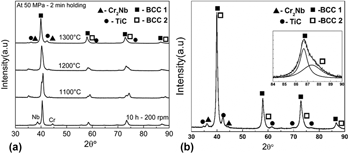
The 10 h MA powder milled at 200 rpm after drying was sintered at different temperatures of 1100, 1200, and 1300 °C to obtain a dense pellet with a relative density of greater than 95%. The X-ray diffractograms of the samples sintered at various SPS temperatures is shown in Fig. 3(a). The relative density of the sample sintered at 1100, 1200, and 1300 °C was measured to be 86, 93, and 98%, respectively. Based on the density of the sintered samples, the SPS temperature of 1300 °C with 50 MPa for a holding duration of 2 min was found to be the optimum sintering condition (Supplementary material Sec. S2). The further discussions are on the sample sintered at this optimized sintering condition. Figure 3(b) illustrates the XRD pattern of the sintered sample at the optimized condition. It shows the presence of two BCC, TiC (Rock-salt structure), and Cr2Nb (C15-Laves) phases. The presence of BCC2 is more prominently visible at higher angles which is deconvoluted and shown in the inset of Fig. 3(b). From the precise lattice parameter calculation (Supplementary material Sec. S3) using the Nelson–Riley function, it was confirmed that the Laves phase has a cubic structure (C15). From the XRD analysis, it can be inferred that the formation of two BCC phases is similar to the phase formation in MA powder. However, in addition to the BCC solid solution, two secondary phases were also observed after sintering.
The XRD pattern of 10 h (200 rpm) MA sample after (a) drying followed by sintering at different SPS temperatures and (b) sintering at 1300 °C–50 MPa. The deconvolution of the higher angle peak shown within the inset shows the presence of BCC2.

Characterization of the sintered CrMoNbTiW alloy at optimized condition
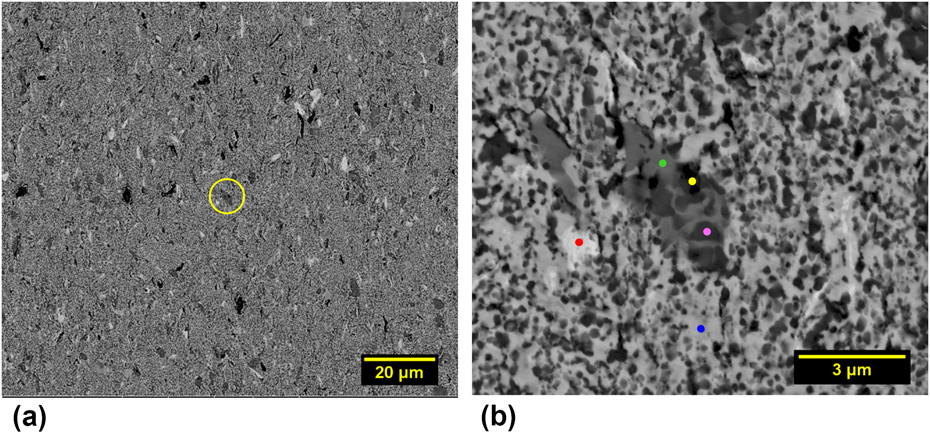
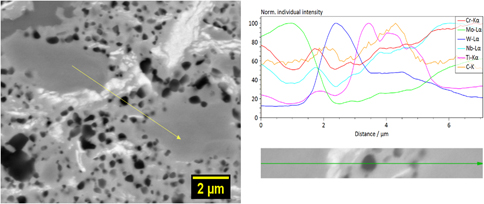
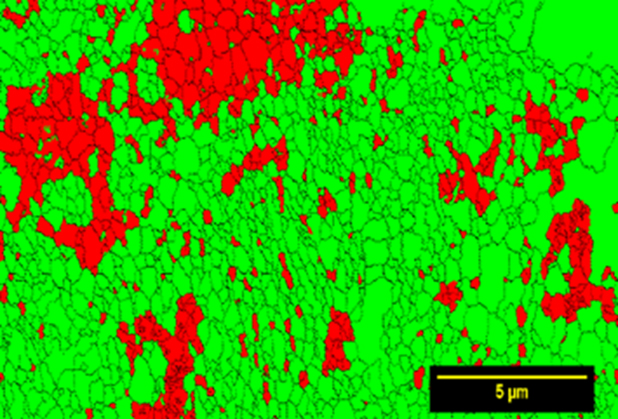
The backscattered electron (BSE-SEM) micrograph of the sintered alloy is shown in Fig. 4, which exhibits different contrasts and are distributed uniformly throughout the microstructure. The magnified image of the region inside the yellow circle is shown in Fig. 4(b). The correlation of BSE-SEM micrograph together with EDS and XRD data indicates that the light grey (blue dot), white (red dot), dark grey (green dot), and black (pink dot) regions are BCC1, BCC2, Cr2Nb (C15 Laves), and TiC, respectively. An additional Mo-rich BCC3 was also observed in the SEM analysis. The elemental composition of these phases analyzed using EDS and Fig. 4(b) is given in Table I. The BCC1 phase is found to be depleted in Ti and BCC2 phase is rich in W. The dark grey region is rich in Cr, the grey region is rich with Mo along with Cr, while the black phase is rich in Ti. The line scan as shown in Fig. 5 confirms that the black phase is TiC. The phase map obtained using EBSD is shown in Fig. 6. The BCC1, BCC2, and BCC3 are indexed as BCC due to their lattice parameter being a minimal variance with each other. Cr2Nb and TiC are indexed as FCC due to the unavailability of the standard file. The total volume fraction of BCC and FCC were found to be 77 and 23%, respectively, which is consistent with the BSE image analysis as described in the Supplementary material Sec. S4. From the EBSD analysis, the grain size of BCC was estimated to be 260 nm (average of ∼1100 grains).
(a) Low magnification and (b) high magnification [yellow region of (a)] BSE-SEM micrographs of 10 h (200 rpm) MA powder after sintering at 1300 °C–50 MPa. The red, green, yellow, pink, and blue dots in (b) represent BCC2, BCC3, TiC, Cr2Nb, and BCC1, respectively.

Line scan featuring the elemental profiles in various phases, indicating that the black phase is TiC in the sample obtained after 10 h of MA at 200 rpm and SPS at 1300 °C–50 MPa.

Phase map obtained through EBSD featuring the BCC and FCC phases in green and red, respectively, in the alloy obtained after 10 h of MA at 200 rpm followed by SPS at 1300 °C–50 MPa.

The formation of a single phase or multiphase during MA is related to the “mechanical property” of the elements [Reference Cordero and Schuh36] as one of the criteria besides the standard thermodynamic considerations [Reference Badmos and Bhadeshia37, Reference Koch38]. If the properties are similar, then a single phase is expected as the elements tend to dissolve into each other. If the properties are very different, then the hard-phase fragments and embeds in the softer phase leading to the formation of multiphase. Further, the final microstructure depends on the milling energy, which influences the kinetics of nanocrystallization [Reference Murty and Ranganathan8]. In this work, the milling time and speed were optimized to have optimum level of alloying and WC contamination during MA. The WC peaks were not observed after SPS, but rather TiC was present. In an earlier report in the literature, it has been shown that TiC can dissolve up to 60 wt% of WC during conventional sintering at 1500 °C [Reference Pierson39]. The complete dissolution of nanocrystalline WC into TiC can be anticipated since the extension of solid solubility is a characteristic feature of MA [Reference Suryanarayana7].
The formation of TiC is obvious due to the strong affinity of Ti towards C which comes from the PCA (toluene). From the carbon analysis, 7.7 at.% of C was found in the MA powder milled at 200 rpm for 10 h, and the C/Ti atom ratio was calculated to be 0.3. From the Ti–C binary phase diagram, for C/Ti ratio of 0.3, it has βTi + TiC at the SPS temperature [Reference Choi and Rhee40]. These observations indicate that not all Ti has been transformed to TiC, which has been confirmed from the composition of the phases [Table I and Fig. 4(b)]. Although all alloying elements used in the present study are strong carbide formers, from the Ellingham diagram for carbides, it can be inferred that TiC is the most stable carbide [Reference Shatynski41, Reference Meschel and Kleppa42]. Vasanthakumar et al. have observed the formation of TiC after SPS of wet-milled Ti. The formation of TiC was not observed during SPS of the as-received Ti (without MA). This confirms that TiC forms due to the carbon pick up from PCA [Reference Vasanthakumar, Karthiselva, Chawake and Bakshi43]. Similarly, the formation of carbides after sintering due to contamination from MA has been reported in the HEA literature [Reference Vaidya, Karati, Marshal, Pradeep and Murty13, Reference Praveen, Anupam, Tilak and Kottada44].
In the present study, the phase formation sequence during SPS can be explained in the following way. At first, the formation of TiC is favored due to the strong affinity of Ti for carbon. Further, depending on the availability of the second element in adequate quantity, residual Cr combines with Nb and results in the formation of the Laves phase only after sintering. This indicates that sufficient thermal activation is required for the formation of Cr2Nb Laves phase. The elemental mapping of the MA powder as shown in the Fig. 2(b) indicates overlapping Cr- and Nb-rich regions (inside yellow circle). These regions can react during SPS, with the available thermal activation for the formation of Cr2Nb Laves phase. Further, comprehensive characterization studies are necessary to understand the mechanism of Laves phase formation completely. Finally, all the elements together result in the formation of BCC phase. Although secondary phases form due to the contamination from the milling media, it can be concluded that BCC is still the major phase in the powder metallurgy processing route of MA + SPS.
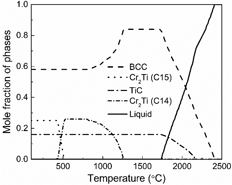
Calculated phase fraction plot for CrMoNbTiW with carbon
Phase fraction plot is shown in Fig. 7. At 1300 °C, BCC and TiC phases are present which are observed after SPS. The calculated composition and volume fraction of the phases at 1300 °C are given in Table I and are indicated with the * symbol. The calculated composition of BCC matches well with the experiments. The predicted volume fraction of BCC is almost equivalent to the combined volume fraction of all the three BCC phases observed experimentally. To predict the carbide formation, a maximum carbon content of 7.7 at.% (obtained from carbon analysis) after MA was given as the input. However, the experimental measurement is taken on the SPS samples obtained after drying of the MA powder, which would have brought down the C content of the MA powder. This may be the reason for higher volume fraction of TiC in the prediction. Also, the predicted composition of TiC is devoid of other elements, which is unlikely to happen in a multicomponent system. However, the formation of Cr2Nb is not predicted; rather, the calculation shows the presence of Cr2Ti at T < 1300 °C. To understand why Cr2Nb formation is not predicted, the phase formation sequence in the presence of unsolicited contamination and the Laves phase formation needs to be understood. In the predicted phase fraction plot, Nb dissolves completely into the solid solution. This suggests that the presence of residual Nb can be attributed to the synthesis route conditions. From Cr–Nb and Cr–Ti phase diagrams [Reference Turchi, Kaufman and Liu32, Reference Takeuchi and Inoue34], it can be inferred that Cr2Nb and Cr2Ti can exist in C14 and C15 crystal structures under equilibrium conditions. The latter is the low-temperature phase (T < 1625 °C for Cr2Nb and T < 1220 °C for Cr2Ti). The mismatch is because Nb dissolves completely into BCC solid solution from the calculations, whereas the residual Cr and Nb form Cr2Nb after sintering and Ti together with C forms the stable TiC under the present experimental conditions.
Calculated phase fraction plot of CrMoNbTiW with C addition to account for TiC formation using TCHEA (v2.1).

Crystallite size, lattice strain and hardness
The crystallite size and lattice strain were calculated for the BCC1 phase (major phase) after sintering. At 200 rpm, with the increase in milling time, “d” decreases to 19 nm and the lattice strain increases to 0.31%. The crystallite size even after sintering was found to be less than 100 nm, which indicates that the nanocrystalline nature of the alloy is retained even after SPS. The crystallite size and lattice strain variation after MA and SPS are given in Table II.
Crystallite size, lattice strain, and hardness of sintered CrMoNbTiW alloy.

The Vickers hardness value after SPS is reported in Table II. The co-existence of carbides and Laves phase can be attributed to the higher hardness of 8.9 ± 0.2 GPa. The increase in hardness due to the presence of secondary phases such as oxides and carbides has been reported in the HEA literature [Reference Praveen, Basu, Kashyap and Sankar12, Reference Kang, Lee, Ryu and Hong14, Reference Sathiyamoorthi, Basu, Kashyap, Pradeep and Kottada45, Reference Sriharitha, Murty and Kottada46]. Zhang et al. have shown that increasing the Cr content in CrxMoNbTaVW alloy from 0.5 to 1 mole percent in cast condition increases the hardness from 6.6 to 7.4 GPa due to the formation of C15 Laves phase [Reference Zhang, Gao, Zhang, Yang and Guo47]. Thus, the presence of secondary phase due to the characteristics of the present synthesis route and ultrafine grain size results in high hardness in the alloy studied.
Consistency of phase formation in the processing routes with simple empirical rules
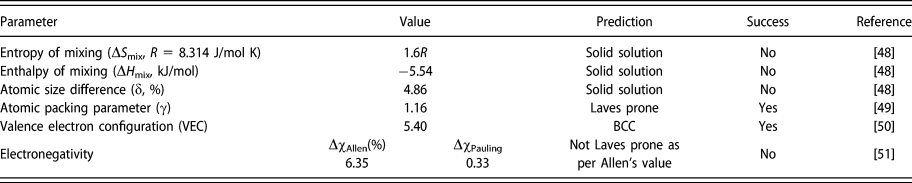
The empirical rules for the phase formation for the present alloy are given in Table III. The CrMoNbTiW alloy favors the formation of solid solution which is consistent with all the established HEA solid solution criteria. The VEC calculation indicates the formation of BCC solid solution. The Laves phase prediction is not accurate as per the Allen’s electronegativity criteria. From the parametric approach, although Allen’s criteria fail, it can be concluded that the alloy essentially has a BCC solid solution along with the Laves phase. The formation of other secondary phases is attributed to the characteristics of the synthesis route adopted.
Phase formation criteria evaluated for CrMoNbTiW alloy based on the literature.

Summary and conclusions
Based on the analysis and discussion presented above, the significance of the present study can be summarized as follows:
(1) The nanocrystalline CrMoNbTiW RHEA is explored for the first time through MA followed by sintering after optimizing the MA parameters.
(2) The alloy showed formation of two BCC along with residual Cr and Nb after MA, whereas three BCC, Cr2Nb, and TiC were observed after sintering.
(3) CALPHAD studies matched well with the experimental observations of BCC and carbide phases in CrMoNbTiW. However, CALPHAD studies could not predict the observed Laves phase.
(4) The presence of residual elements along with the contamination from the milling media is the major reason for the formation of secondary phases.
(5) The high hardness value can be attributed to the ultrafine grained structure as well as the presence of secondary phases after sintering.
(6) The established empirical rules such as entropy of mixing, enthalpy of mixing, and the atomic mismatch predict the formation of BCC phase in CrMoNbTiW alloy. Except for the atomic packing parameter, the other parameters do not predict the Laves phase formation correctly.
Materials and methods
Experiments
During MA, elemental powders of Cr, Ti (99.5% pure; Loba Chemie, Mumbai, India), Mo, Nb, and W (99.8% pure; Alfa Aesar, Ward Hill, MA) were taken in equi-atomic proportion. Milling was carried out in a high-energy planetary ball mill (Fritsch Pulverisette-5, FRITSCH GmbH, Idar-Oberstein, Germany). The WC balls (10 mm diameter) and toluene as process control agent (PCA) were used as the milling media. The elemental powders were mixed and milled along with PCA and WC balls in a WC vial having a volume of 250 mL. The powders were milled at different milling speeds (200, 250, and 300 rpm) with a ball-to-powder weight ratio (BPR) of 10:1 to monitor the WC contamination during MA. The powder samples were collected at regular intervals to analyze the phase evolution using X-ray diffraction (XRD) (PANalytical X’pert Pro, Malvern Panalytical Ltd., Royston, United Kingdom) with Cu Kα radiation. The measurements were taken in the 2θ range of 30–90° with 0.02° as the step size, and with 20 s as time per step. The carbon content of the MA powder synthesized at optimized milling parameters was quantified using a LECO CS477 analyzer. The carbon analysis was carried out on the MA powder prior to any subsequent heat treatment so that the maximum picked up carbon can be measured. Further, the MA powders were subsequently dried at 200 °C for 2 h in Ar atmosphere in an electric resistance furnace to ensure the complete removal of toluene before sintering. Thereafter, the milled and dried powders were consolidated with the help of graphite dies using SPS (Dr. Sinter SPS-5000, Sumitomo Metals, Japan) in vacuum (<10 Pa). The SPS was done at different temperatures, and at a heating rate of 100 °C/min with an applied pressure of 50 MPa and 2 min of holding duration after reaching the pressure. The density of the sintered samples was measured using Archimedes’ principle.
The MA powder was mounted in a conducting resin and polished up to 2000 grit SiC emery paper for microstructural characterization, whereas the sintered samples were polished up to 1200 grit SiC emery papery followed by cloth polishing for mirror finish with diamond suspension up to 0.25 μm. Extensive microstructural characterization of the alloy was done using scanning electron microscopy (SEM) (FEI Quanta 400, ThermoFisher SCIENTIFIC, Oregon, USA) FEG-SEM operating at 20 kV that was equipped with energy dispersive spectroscopy (EDS) attachment for elemental composition analysis. Besides, a detailed phase analysis was carried out using Helios G4UX (FE-SEM, ThermoFisher SCIENTIFIC, Oregon, USA) along with electron backscattered diffraction (EBSD HIKARI PRO) attachment with a step size of 50 nm. The EBSD studies were analyzed using TSL-OIM (AMETEK Instruments India (P) Ltd, Mumbai) software (version 7.2). The grain size analysis was carried out using the intercept length method. In this work, the term crystallite size refers to the “coherently diffracting domains” and not the grain size. The first four peaks (110, 200, 211, and 220) of BCC were considered for determining the crystallite size (d in nm) and lattice strain (ε, %) calculations. In the XRD analysis, the pseudo-Voigt function was used to fit the peaks which accounts for the Gaussian and Lorentzian contribution in the peak broadening [Reference Young and Wiles18]. The average Williamson–Hall method was used to estimate d and ε after eliminating the instrumental broadening using Si standard [Reference Prince and Stalick19]. The XRD analysis was carried out using X'Pert HighScore Plus (version 4.1) software (Malvern Panalytical Ltd., Royston, United Kingdom).
Hardness measurements were carried out on the cross section of the consolidated sample after metallographic polishing at a load of 500 g with a dwell time of 10 s in Wolpert Wilson Vickers hardness tester. The reported values are an average of ten readings.
Calculations
All the calculations for CALPHAD studies were executed using Thermo-Calc software (Thermo-Calc Software AB, Solna, SWEDEN) [Reference Saunders and Miodownik20, Reference Sundman, Jansson and Andersson21] in combination with TCHEA (v2.1) database. The phase evolution as a function of temperature was calculated to obtain the equilibrium phase fraction plot. Besides, to account for the carbide formation, 7.7 at.% of C measured through carbon analysis was added in the calculation, while keeping the other elements in equi-atomic ratio.
Supplementary material
To view supplementary material for this article, please visit https://doi.org/10.1557/jmr.2018.483.
Acknowledgments
The authors thank ISRO-IITM cell for the financial support through the project ICSR/ISRO-IITM/MET/13-14/150/BSMT. The authors are grateful to Ms. Dilpreet Danjal (former B.Tech student, NIT Rourkela), Mr. Adil Shaik (MS scholar, IIT Madras), Mr. G. Karthick, Mr. N.T.B.N. Koundinya, Dr. Soumya Sridar (Ph.D. students, Department of Metallurgical and Materials Engineering at IIT Madras) and Dr. Niraj Chawake (former Ph.D. student, Department of Metallurgical and Materials Engineering at IIT Madras) for their valuable suggestions and discussion. The authors thank NFAPT team for their assistance in the EBSD analysis.