Introduction
A new mineral species, liangjunite, ideally K2(Mo2O5)(SO4)2·3H2O, was discovered from the Freedom #2 mine in the central part of the Marysvale volcanic field, Utah, USA. The new mineral is named in honour of the late Chinese mineralogist, Prof. Liangjun Jiang (1913–1992) at the Central South University, Changsha, Hunan Province. Prof. Jiang graduated from the Department of Geology, Peking University in 1934 and then started his career as a teacher in geology and mineralogy in Hunan University. In 1952, he was one of the founders for the Department of Geology of the Central South Institute of Mines and Metallurgy (now the Central South University) and became the leader of the research group for mineralogy and petrology. Prof. Jiang was an eminent and highly respected educator in mineralogy from the 1950s to the 1980s in China and made significant contributions to mineralogical education and geological exploration. The new mineral and its name have been approved by the Commission on New Minerals, Nomenclature and Classification of the International Mineralogical Association (IMA-CNMNC) as IMA 2022-060 with symbol Lju (Gu et al., Reference Gu, Yang and Scott2023a). Part of the cotype samples have been deposited at the University of Arizona Alfie Norville Gem and Mineral Museum (Catalogue # 22719) and the RRUFF Project (deposition #R220001) (http://rruff.net). This paper describes the physical and chemical properties of liangjunite, and its crystal structure determined from single-crystal X-ray diffraction data.
Sample description and experimental methods
Occurrence
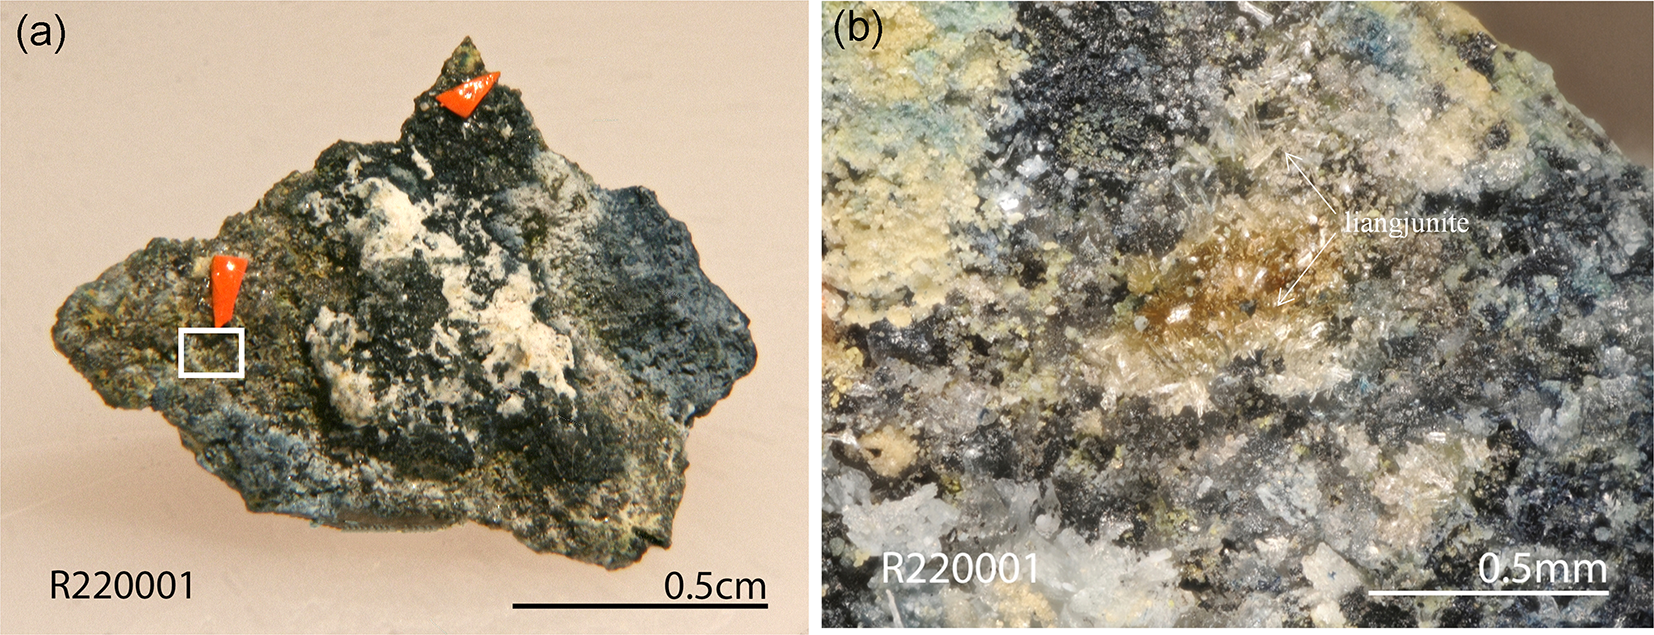
Liangjunite was found on a specimen (Fig. 1) collected from the Freedom #2 mine in the Central Mining Area (38°29’43”N, 112°12’55”W), ∼5.6 km north-northeast of the town of Marysvale in the central part of the Marysvale volcanic field, Utah, USA. This mine is also the type locality for umohoite (UO2)(MoO4)·2H2O, zhenruite (MoO3)2·H2O (Gu et al., Reference Gu, Yang and Scott2022), wangpuite K3(PO4)(Mo12O36) (Gu et al., Reference Gu, Yang, Marty, Gibbs and He2023b), downsite K2(MoO3)3(SO4)·4H2O (Gu et al., Reference Gu, Yang and Marty2023c), vanpeltite (Mo2O5)(S4+O3)·4H2O (Gu et al., Reference Gu, Yang, Kampf, Thorne, Gibbs, Scott and Downs2023d), and fanguangite (MoO2)(PO3OH)·4H2O (Gu et al., Reference Gu, Li, Yang, Kampf and Marty2024). Associated minerals include alunogen, anhydrite, coquimbite, fluorite, quartz, raydemarkite and zhenruite.
(a) The specimen containing the new mineral liangjunite, indicated by the orange arrows. (b) Microscopic view of the frame area in (a), showing bladed and prismatic crystals of liangjunite grown on the matrix of alunogen, coquimbite, anhydrite, fluorite and quartz.

The Marysvale U-Mo deposit was formed in an epithermal vein system hosted in a volcanic/hypabyssal complex composed of porphyritic quartz monzonite, fine-grained granite, and glassy alkali rhyolite dated between 23 Ma and 18 Ma (Brophy and Kerr, Reference Brophy and P.F1953; Cunningham et al., Reference Cunningham, Rasmussen, Steven, Rye, Rowley, Romberger and Selverstone1998). The samples containing liangjunite are the weathered product of the primary molybdenum ores exposed on the surface of the mine.
Appearance, physical and chemical properties
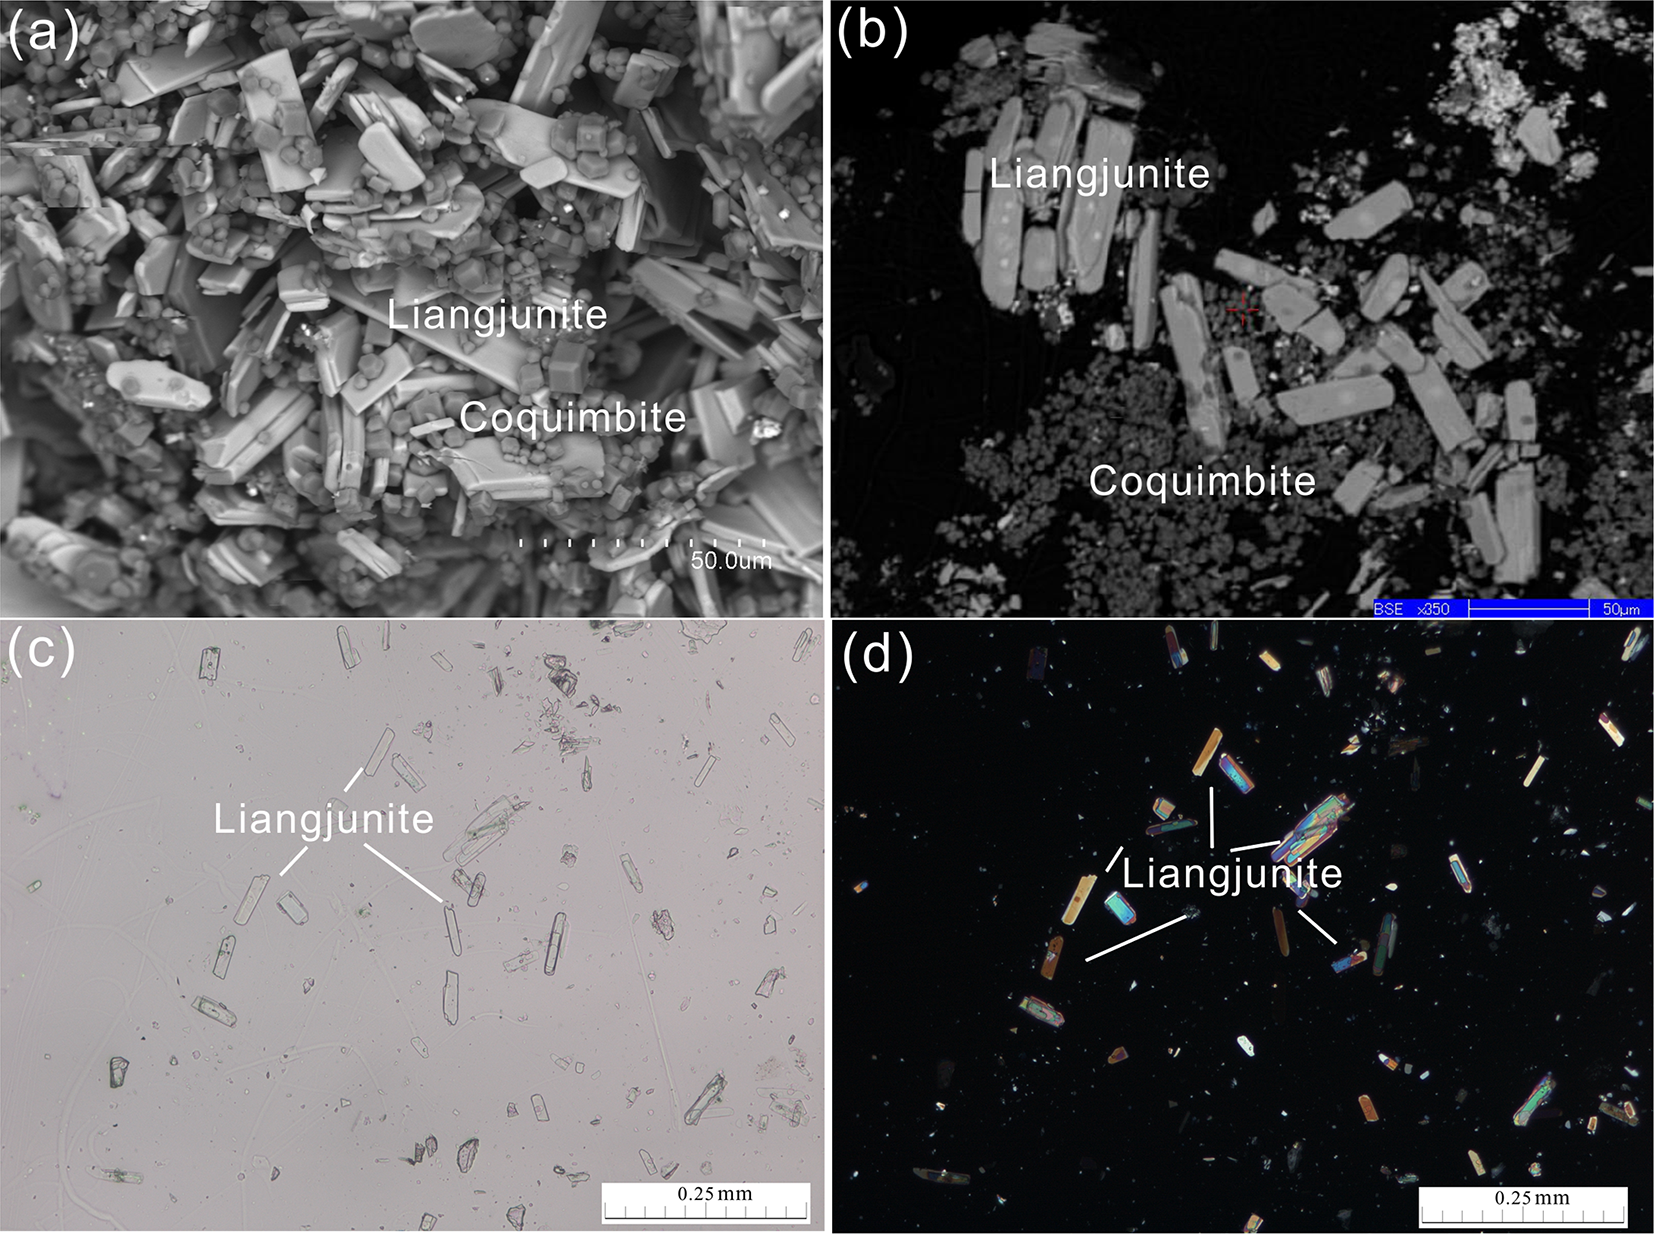
Liangjunite occurs as aggregates or scattered bladed or prismatic crystals flattened on {001} and elongated along [010] (Fig. 2). Individual crystals of liangjunite are up to 0.04 × 0.02 × 0.01 mm. Liangjunite is colourless in transmitted light, transparent with a white streak and vitreous lustre. It is brittle with a Mohs hardness of 1½–2; cleavage is perfect on {001}. No twinning was observed visually. The density was not measured, due to the small crystal size and limited sample. The calculated density is 2.698 g/cm3, on the basis of empirical formula and unit cell volume from single-crystal X-ray diffraction data. Optically, liangjunite is biaxial (–): α = 1.52(8), β = 1.63(6), γ = 1.71(5) (white light), measured by the oil immersion method. The 2V value was. not determined because of the small size of crystals. The calculated 2V is 76°. The pleochroism is weak, from colourless to pale. The compatibility index, 1–(KP/KC), is –0.024 (excellent).
Microscopic views of bladed crystals of liangjunite: (a) secondary electron image; (b) back-scattered electron image; (c) photomicrograph of transmittance light microscope in parallel polarized lights; and (d) the same view as (c) showing interference colours in crossed polarized light.

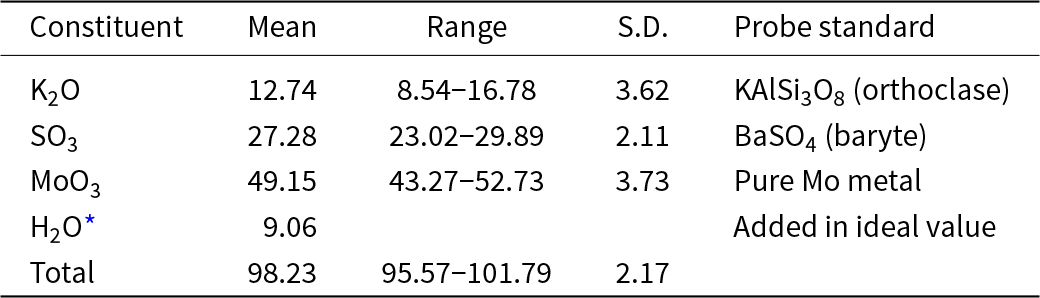
The chemical composition of liangjunite (Table 1) was determined with a Shimadzu-1720 electron microprobe operated at 15 kV and 10 nA with a beam size of 2 μm. Quantitative analysis was done in WDS mode and the analytical data (average of 8 analysis points) are given in Table 1, along with the standards used for the probe analyses. The resultant empirical chemical formula, calculated on the basis of 16 O atoms per formula unit (apfu), is K1.62(Mo2.03O5)(S2.03O8)·3H2O. The ideal formula, K2(Mo2O5)(SO4)2·3H2O, requires (wt.%) K2O 15.80, SO3 26.86 MoO3 48.28 and H2O 9.06 (total = 100%). At room temperature, liangjunite is insoluble in H2O or hydrochloric acid. The deficiency of K in the empirical formula may be compensated by the substitution K+ + (SO4)2– = H2O + (SO3OH)– for charge balance.
Analytical data (in wt.%) for liangjunite

Table 1 Long description
Analytical results for liangjunite list mean weight percent, observed range, standard deviation, and the probe standard used for each constituent. MoO3 is the largest component, averaging 49.15 wt.% with a range from 43.27 to 52.73 and a standard deviation of 3.73, calibrated against pure molybdenum metal. SO3 averages 27.28 wt.% with a range from 23.02 to 29.89 and a standard deviation of 2.11, using baryte as the standard. K2O averages 12.74 wt.% but varies widely from 8.54 to 16.78 with a standard deviation of 3.62, using orthoclase as the standard. H2O is listed as 9.06 wt.% as an added ideal value, with no range or standard deviation reported. The total averages 98.23 wt.% with totals ranging from 95.57 to 101.79 and a standard deviation of 2.17. Results should be interpreted cautiously because the mineral can be damaged by the electron beam, which can destabilize measurements, especially for potassium oxide.
Notes: *Liangjunite is prone to the electron beam damage, leading to unstable quantitative results especially in K2O contents. S.D. – standard deviation.
Raman spectra
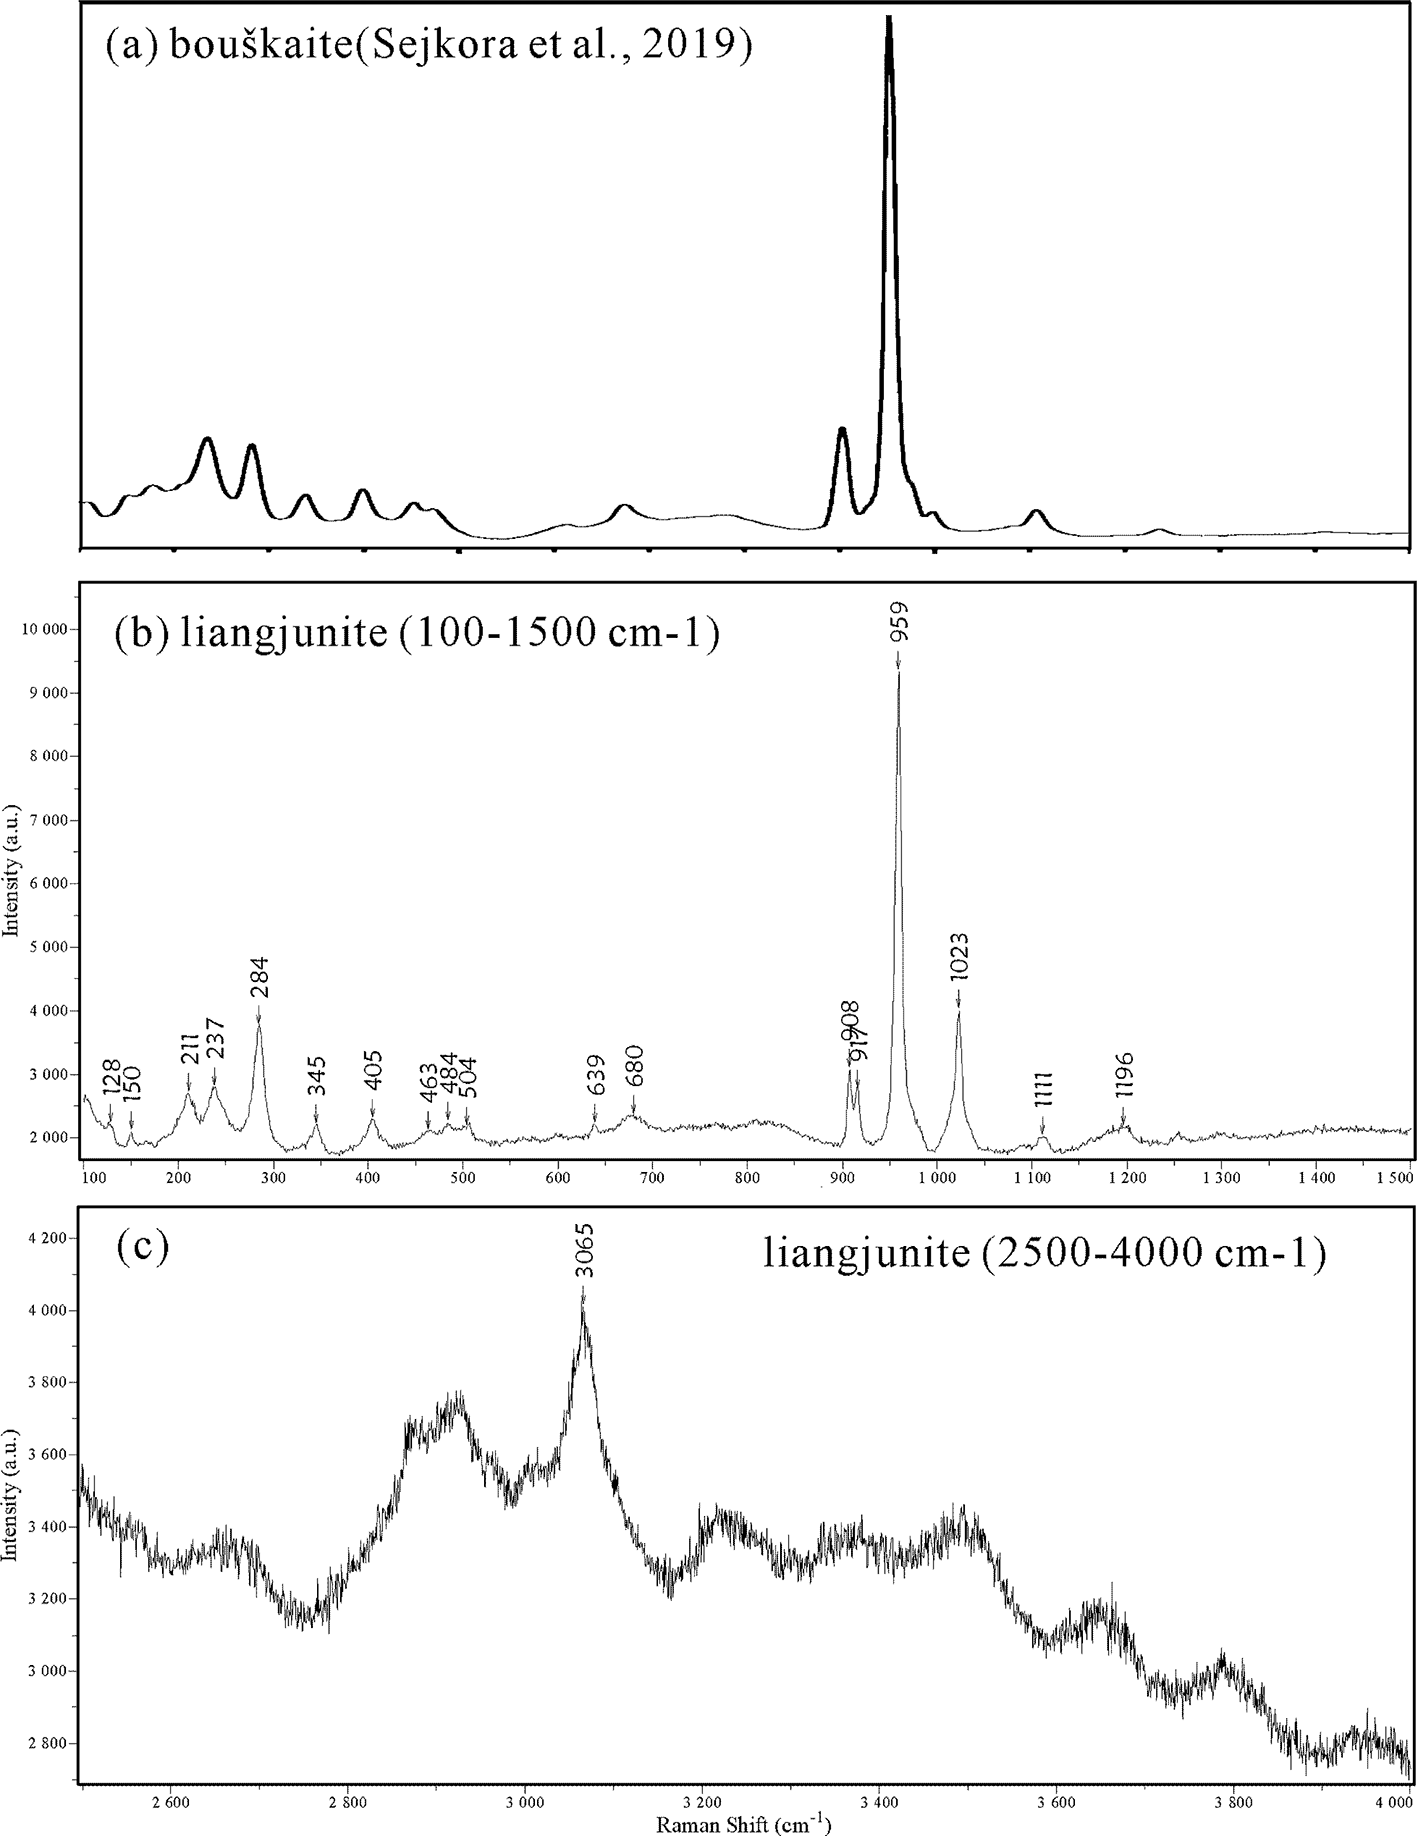
The Raman spectra of liangjunite (Fig. 3) were collected from a randomly orientated crystal on a Horiba ARAMIS microRaman system, using a solid-state laser with a wavelength of 532 nm in a power of 5 mW and a thermoelectric cooled CCD detector, with 2 cm–1 resolution and a spot size of 2 μm observed with a 50× objective of an Olympus microscope. The spectrum was acquired with an exposure time of 10 s and 3 accumulations.
Raman spectra of bouškaite (a, from Sejkora et al., Reference Sejkora, Grey, Kampf, Plášil and Škácha2019) and liangjunite (b, c over different ranges).

Figure 3 Long description
Bouškaite (Sejkora et al., 2019). The x-axis label is Raman shift (cm superscript -1). The y-axis label is Intensity (a.u.). A single line trace shows several small peaks at the left side, then a very tall, narrow peak near the middle-right of the plot, followed by a low, nearly flat trace toward the right edge. Liangjunite (100-1500 cm superscript -1). The x-axis label is Raman shift (cm superscript -1). The y-axis label is Intensity (a.u.). A single line trace shows many narrow peaks across the range. Liangjunite (2500-4000 cm superscript -1). The x-axis label is Raman shift (cm superscript -1). The y-axis label is Intensity (a.u.). A single line trace shows a broad, uneven baseline with one prominent labeled peak at 3055, plus smaller undulations across the remaining range.
The Raman spectrum of liangjunite is comparable to that of bouškaite (Sejkora et al., Reference Sejkora, Grey, Kampf, Plášil and Škácha2019) (Fig. 4). It is composed of strong and sharp peaks at 284, 908, 917, 959 and 1023 cm–1 and moderate to weak bands at 128, 211, 237, 345, 405, 463, 484, 639, 680, 1111, 1196 and 3065 cm–1. Based on the Raman spectra for bouškaite (Sejkora et al., Reference Sejkora, Grey, Kampf, Plášil and Škácha2019), and other molybdate and sulfate minerals, such as sidwillite, molybdite, baryte, anhydrite and gypsum, we made the following tentative assignments of the major Raman bands for liangjunite. The bands centred at 3065 cm–1 are assigned to the O–H stretching vibrations in H2O. The bands at 907, 916 and 958 cm–1 are attributed to the Mo–O stretching vibrations within the (Mo2O5)2+ groups, and those at 1022, 1110 and 1183 cm–1 to the S–O stretching vibrations within the (SO4)2– groups. The bands between 280 to 700 cm–1 are ascribable to the Mo–O–Mo, O–Mo–O and O–S–O bending vibrations. The bands below 280 cm–1 are associated mainly with the rotational and translational modes of (Mo2O5)2+, (SO4)2– and H2O groups, and K-O stretching vibrations, as well as the lattice vibrational modes.
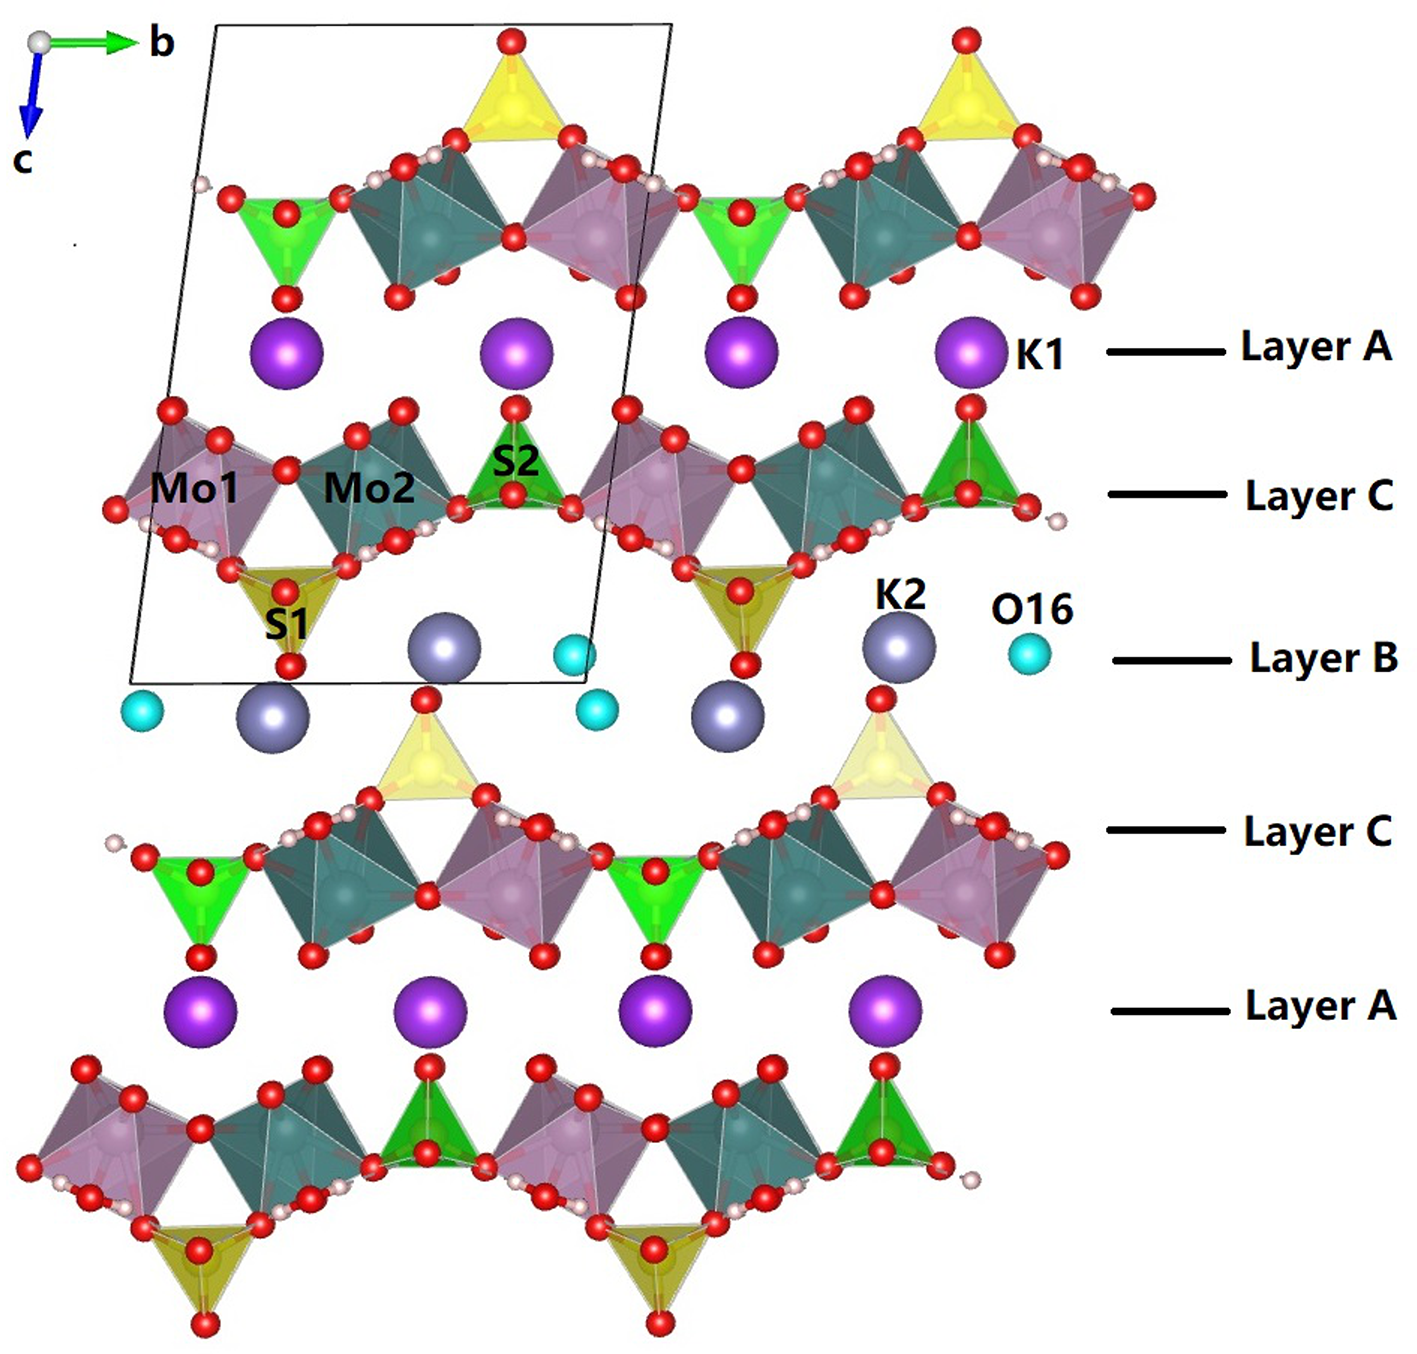
Crystal structure of liangjunite viewed along [100] [plotted with freeware VESTA (Momma and Izumi, Reference Momma and Izumi2011)], showing the stacking of three different layers A, B and C.

Figure 4 Long description
The crystal structure of liangjunite is depicted with three distinct layers labeled A, B and C. At the top, Layer A is shown with a series of interconnected geometric shapes, including triangles and tetrahedrons, with red spheres representing oxygen atoms at the vertices. The molybdenum atoms, labeled Mo1 and Mo2, are centrally located within the structure, surrounded by sulfur atoms labeled S1 and S2. Potassium atoms, labeled K1, are positioned at the top right of Layer A. Below Layer A, Layer C is visible, featuring similar geometric arrangements with oxygen atoms at the vertices and potassium atoms labeled K2. The central Layer B is marked by the presence of oxygen atoms labeled O16, positioned between the layers. The diagram includes a directional axis in the top left corner, indicating the orientation with labels b and c. Each layer is clearly separated and labeled on the right side of the image, illustrating the stacking order of the layers within the crystal structure.
X-ray crystallography
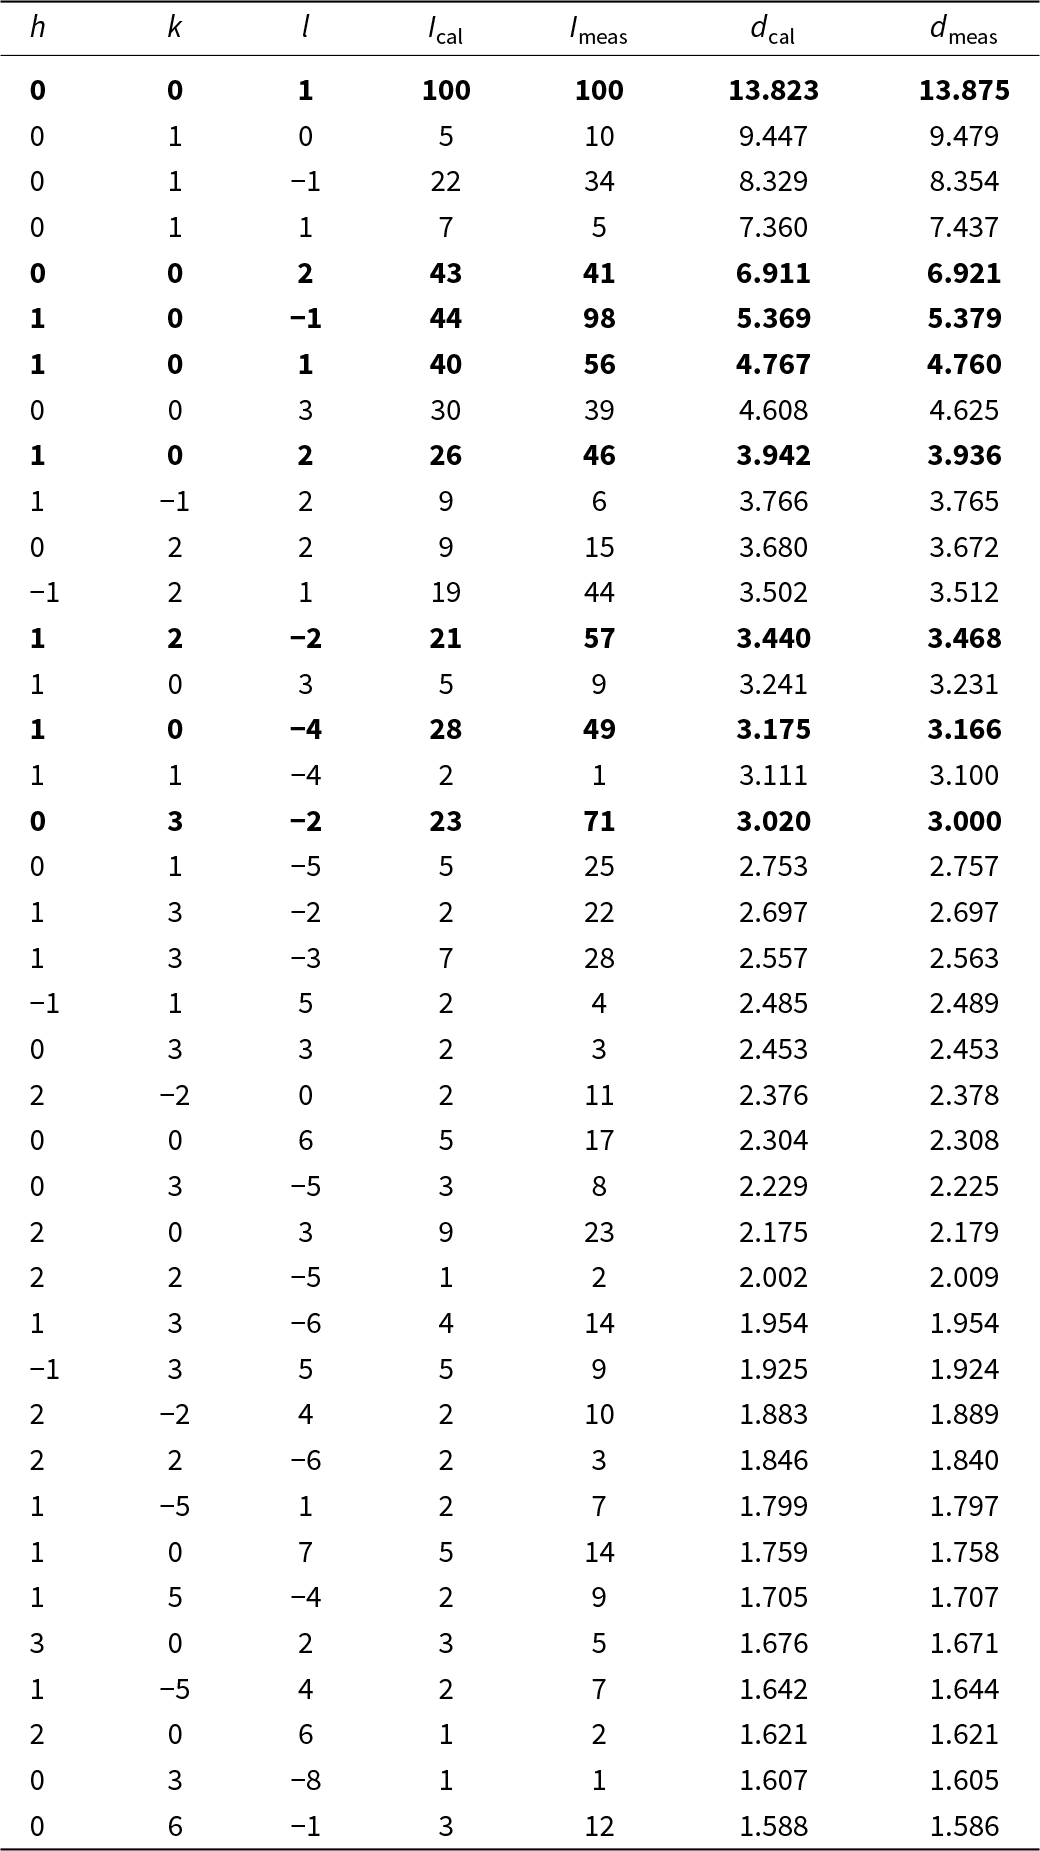
Both the powder and single-crystal X-ray diffraction data for liangjunite were collected on a Rigaku Xtalab Synerg D/S 4-circle diffractometer equipped with CuKα radiation (λ = 1.54184 Å). Powder X-ray diffraction data were collected in the Gandolfi mode at 50 kV and 1 mA (Table 2), The one-dimensional 2θ-I profile and peak data were extracted by instrumental software CrysAlisPro, and the unit-cell parameters refined using the program by Holland and Redfern (Reference Holland and Redfern1997) are: a = 5.4984(4), b = 9.5309(4), c = 14.1572(7) Å, α = 97.451(4), β = 99.924(5)°, γ = 90.177(6), and V = 724.39(5) Å3.
X-ray powder diffraction data (d in Å, I in %) for liangjunite

Table 2 Long description
Powder X-ray diffraction reflections for liangjunite are listed by Miller indices with calculated and measured relative intensities (percent) and d-spacings (angstroms). The dominant measured line is the 0 0 1 reflection at d 13.875 Å with measured intensity 100% (calculated 100% at d 13.823 Å). Other strong measured peaks include 1 0 minus 1 at d 5.379 Å with 98% measured intensity (calculated 44% at d 5.369 Å) and 0 3 minus 2 at d 3.000 Å with 71% measured intensity (calculated 23% at d 3.020 Å). Several mid-strength lines occur at 1 2 minus 2 (57% measured at d 3.468 Å), 1 0 1 (56% measured at d 4.760 Å), 1 0 minus 4 (49% measured at d 3.166 Å), and 1 0 2 (46% measured at d 3.936 Å). Measured and calculated d-spacings generally agree closely, typically within a few hundredths of an angstrom across the list. Intensities show larger differences between calculated and measured values for some reflections, so peak strength comparisons should rely on the measured column when matching patterns. The dataset spans from large d-spacings near 13.9 Å down to about 1.59 Å, with many weaker measured lines below 25% intensity.
Notes: The strongest lines are in bold.
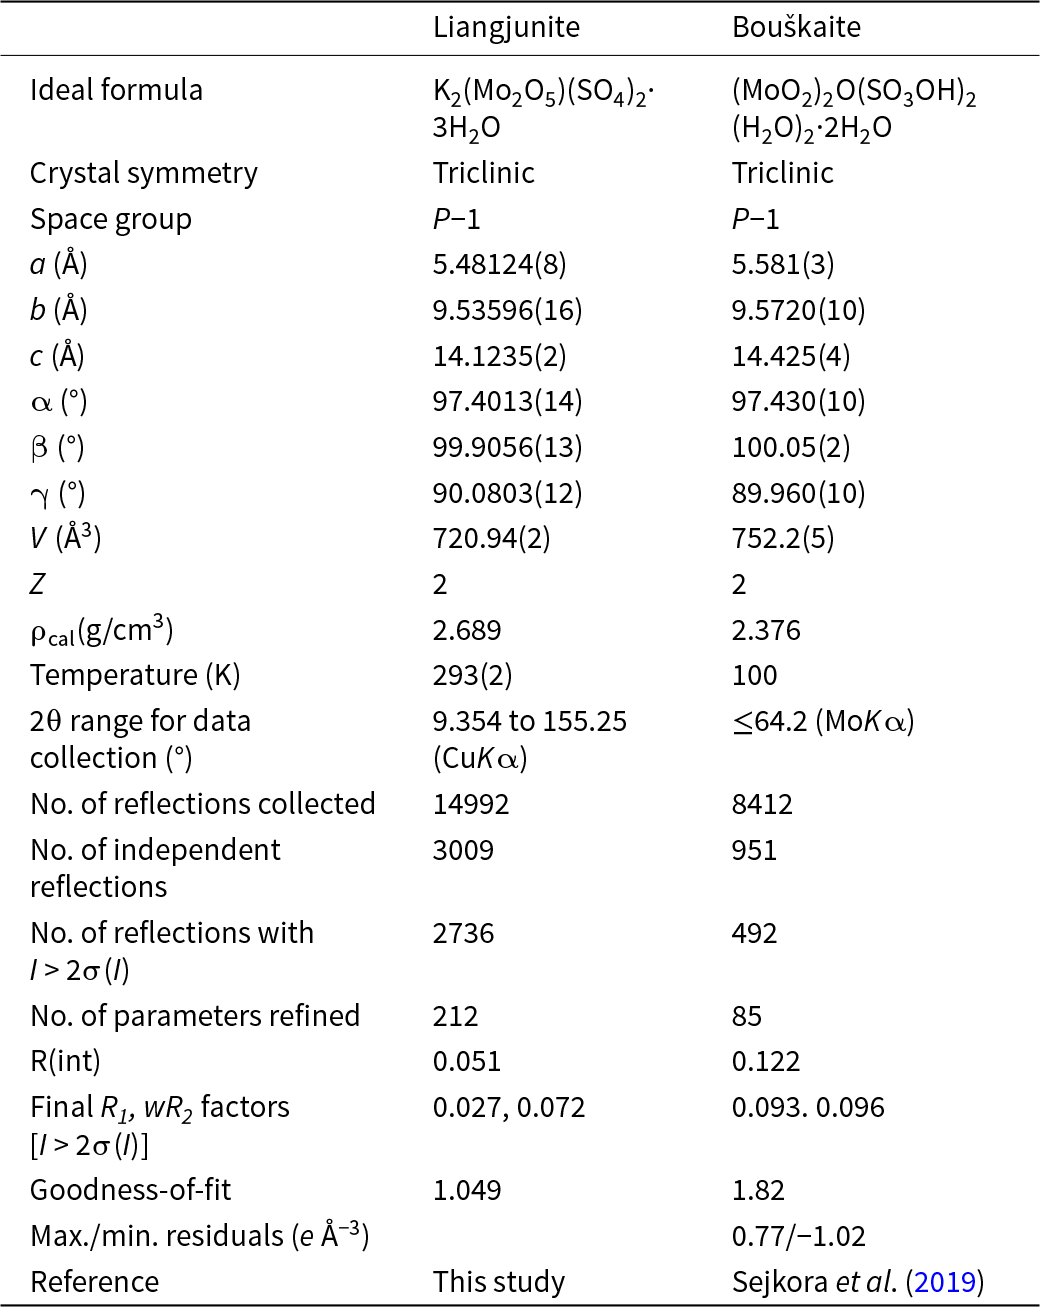
Single-crystal X-ray diffraction data of liangjunite were collected from a 0.03 × 0.02 × 0.01 mm fragment. All reflections were indexed on the basis of a triclinic unit-cell (Table 3). The systematic absences of reflections suggest possible space group P  $\bar 1$ or P1 for liangjunite. The crystal structure was solved and refined using SHELX2019 (Sheldrick Reference Sheldrick2015a, Reference Sheldrick2015b) based on space group P
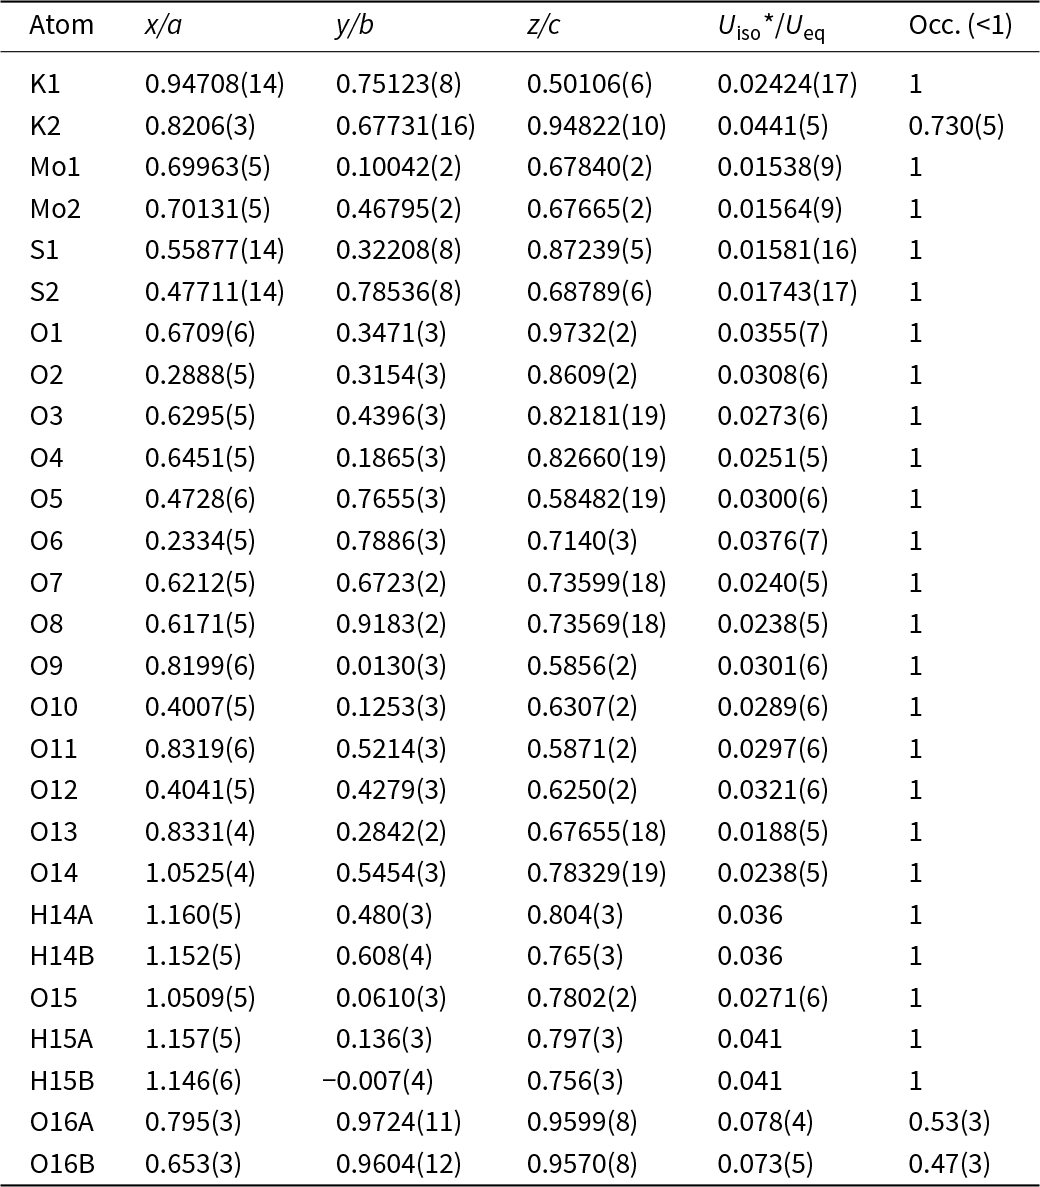
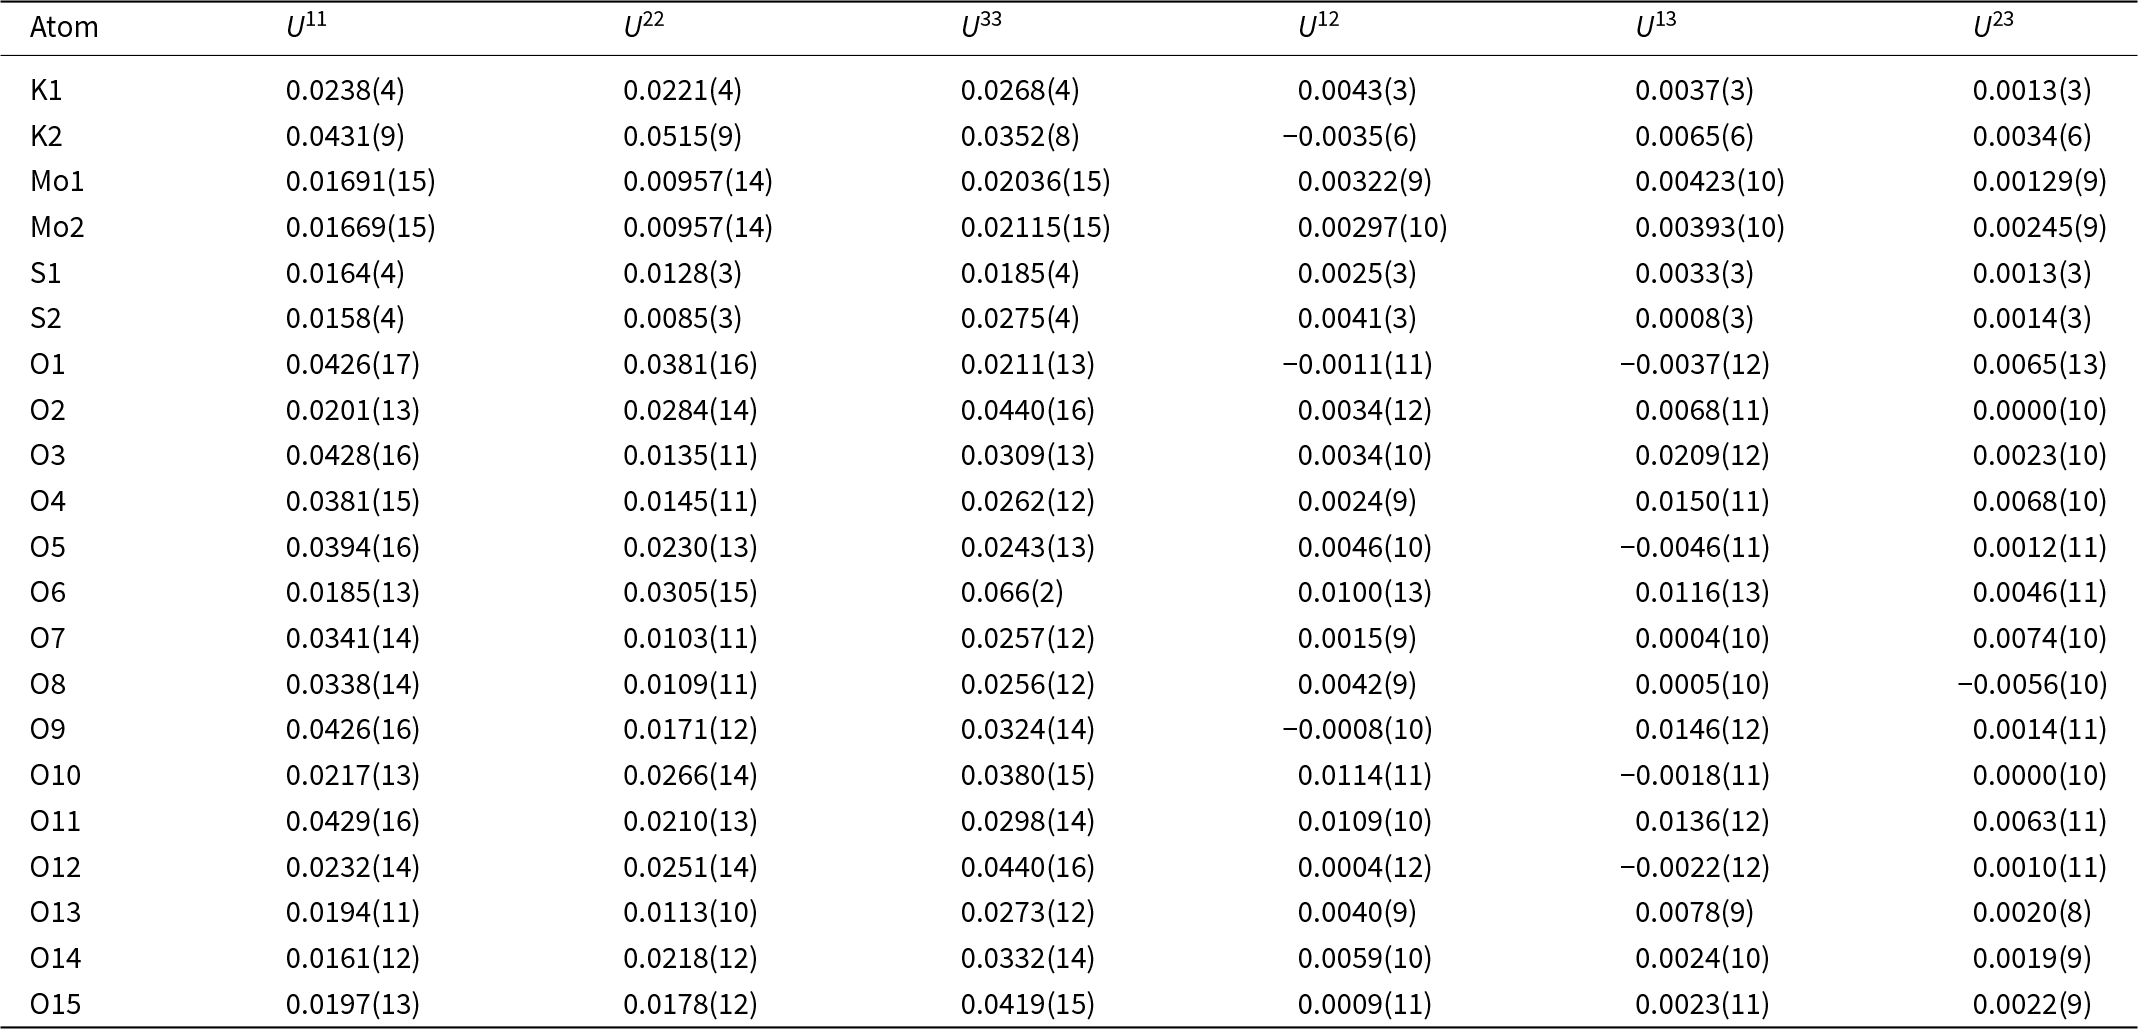
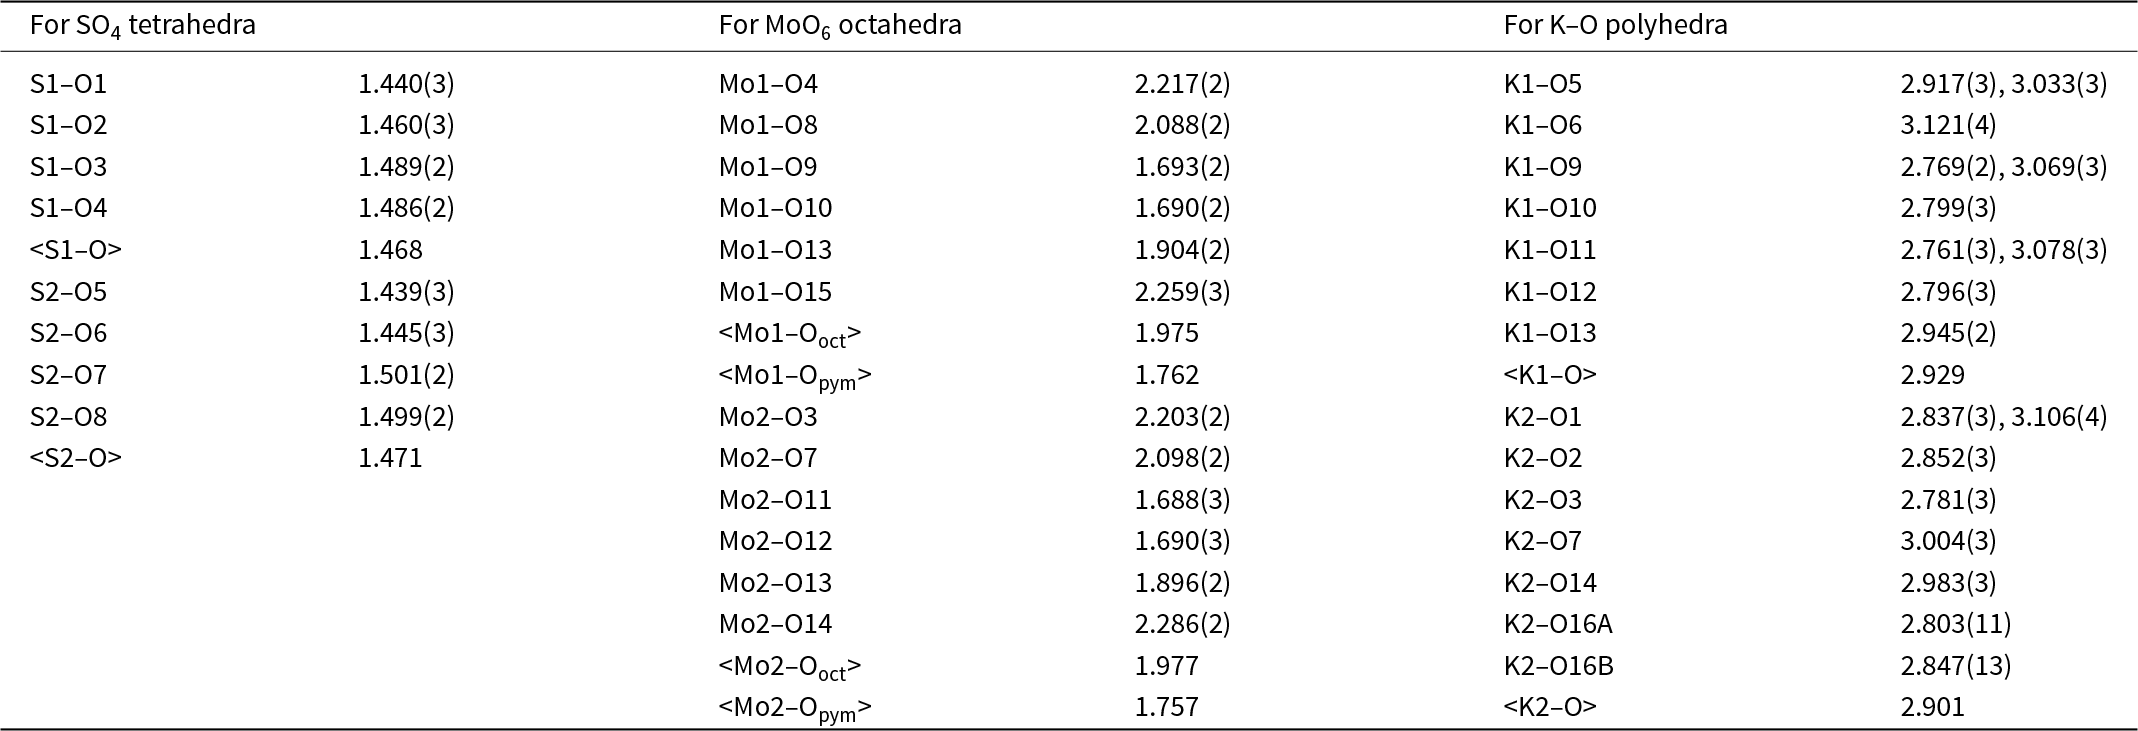
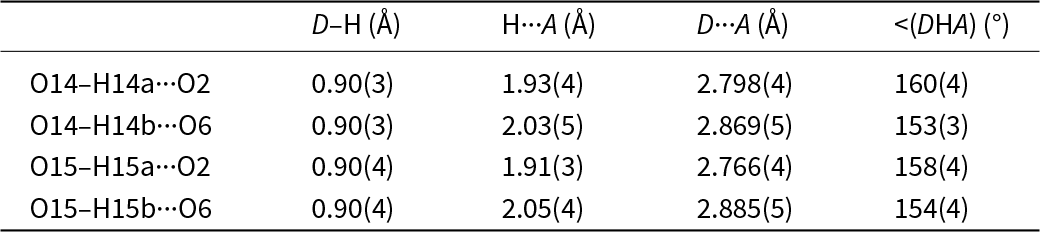
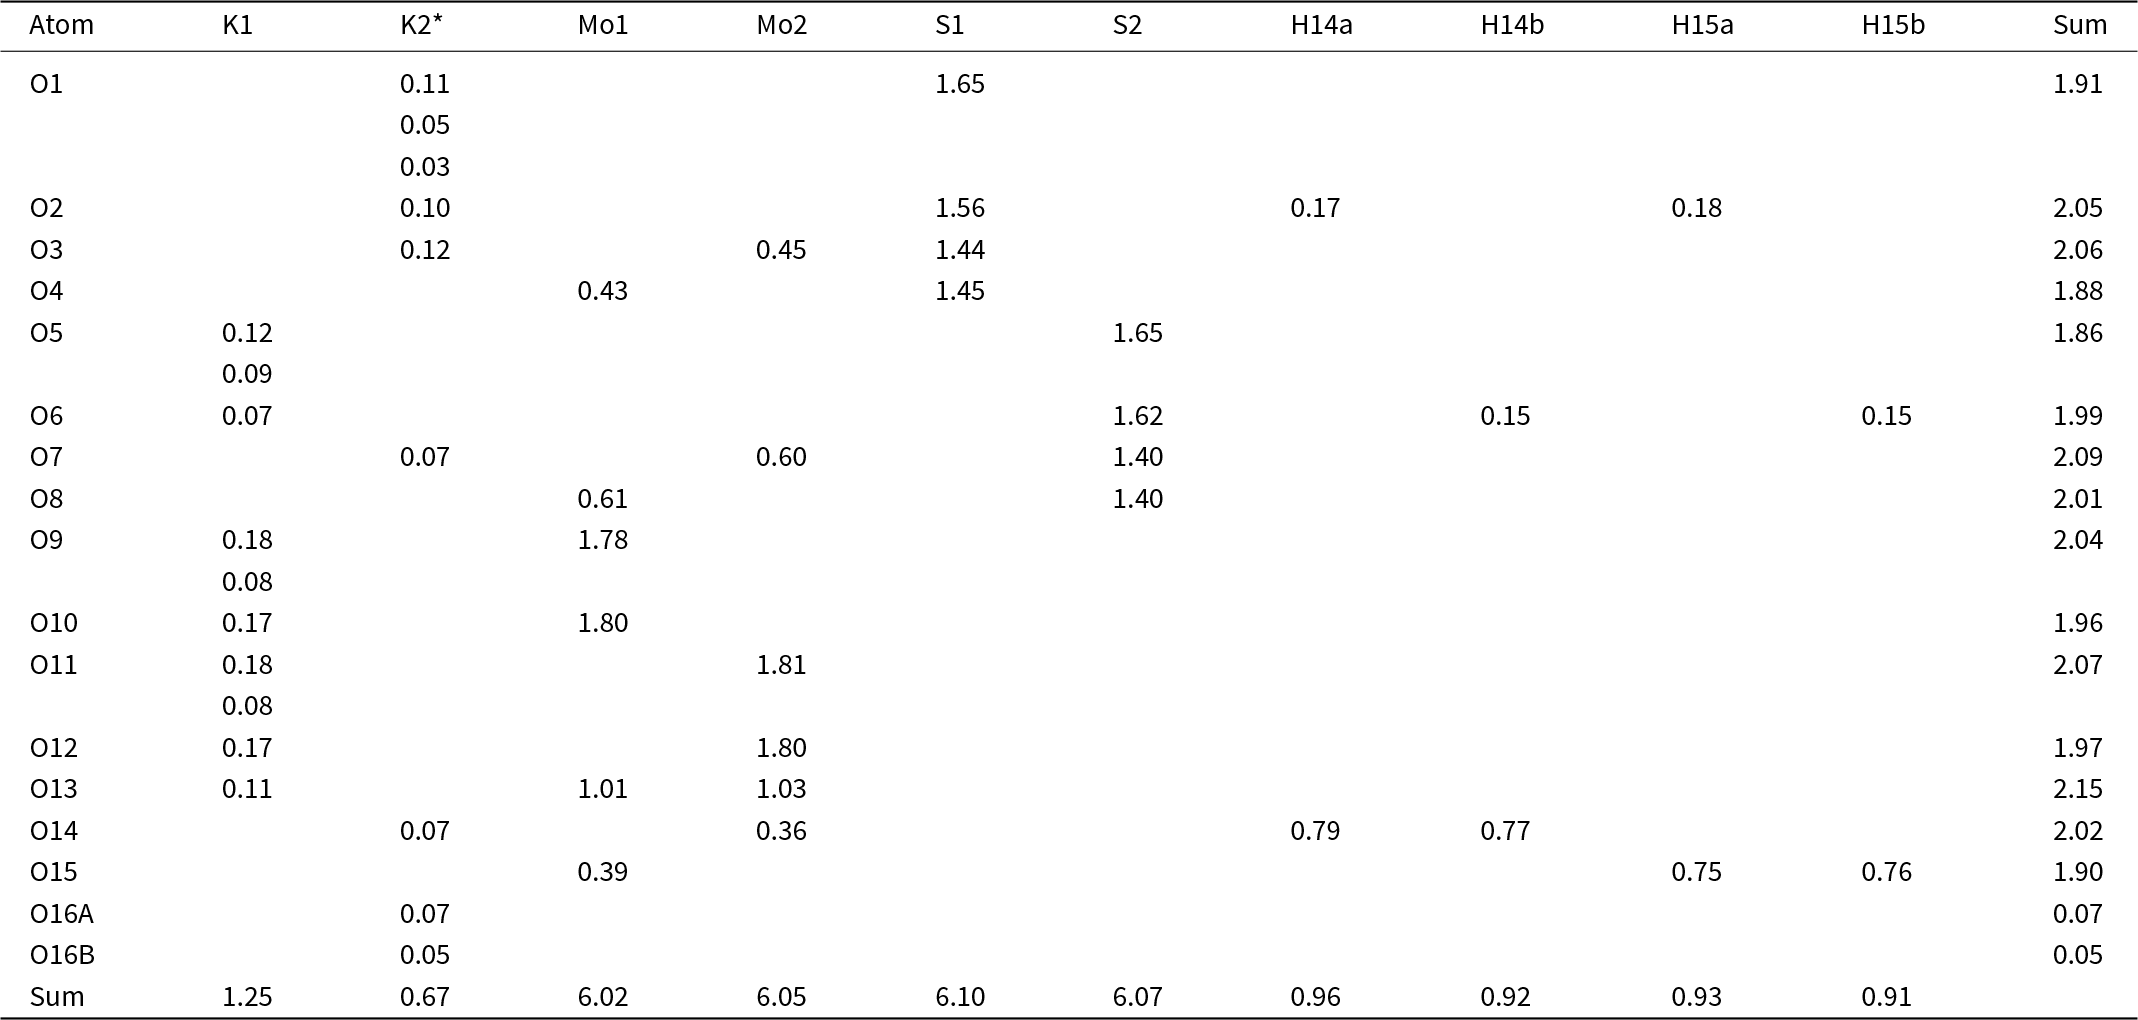
 $\bar 1$, because it produced the better refinement statistics in terms of bond lengths and angles, atomic displacement parameters, and R factors. The H atoms for two H2O molecules (O14 and O15) bonded to the Mo6+ cations were located through the difference-Fourier syntheses, but those for the H2O molecule (O16) bonded weakly to K+ could not be unambiguously located, resulting from the abnormally large displacement parameters of O16. The structure refinement suggested a possible splitting of the O16 site (at x = 0.72839, y = 0.96652, z = 0.95856) into two (one at x = 0.795, y = 0.9724, z = 0.9599 and the other at x = 0.653, y = 0.9604, z = 0.9570), though a refinement with such a site-split model increased the R 1 factor from 0.0258 to 0.0270. A preliminary refinement indicated a full occupancy of K at the K1 site, but a partial occupancy at the K2 site. Subsequently, the K occupancy at the K1 site was assumed to be full, whereas that at the K2 site was refined, yielding a total K content of 1.73 apfu, which is close to that (1.62 apfu) determined from the electron microprobe analysis. The positions of all atoms were refined with anisotropic displacement parameters, except for H atoms and split O16A and O16B, which were refined isotropically with soft restraints of 0.90(2) Å on the O–H distances. The final refinement statistics are listed in Table 3. Atomic coordinates and displacement parameters are given in Tables 4 and 5, respectively. Selected bond distances and the hydrogen bonding scheme are presented in Tables 6 and 7. The bond-valence sums were calculated using the parameters given by Ferraris and Ivaldi (Reference Ferraris and Ivaldi1988) for O···H bonds and by Brown (Reference Brown2009) for the rest (Table 8). The crystallographic information file has been deposited with the Principal Editor of Mineralogical Magazine and is available as Supplementary material (see below).
Crystallographic data for liangjunite and bouškaite

Table 3 Long description
Crystallographic and refinement metrics are compared for the minerals liangjunite and bouškaite. Both are triclinic and share the same space group, P minus 1, with two formula units per unit cell. Bouškaite has slightly larger unit-cell edges and a larger unit-cell volume, about 752.2 cubic angstroms versus 720.94 cubic angstroms for liangjunite. The unit-cell angles are very similar between the two, near 97 degrees for alpha, 100 degrees for beta, and about 90 degrees for gamma. Calculated density is higher for liangjunite at 2.689 grams per cubic centimeter than for bouškaite at 2.376 grams per cubic centimeter. Data collection conditions differ, with liangjunite measured near 293 kelvin using copper radiation over a wider two-theta range, while bouškaite was measured at 100 kelvin using molybdenum radiation to a lower maximum two-theta. Liangjunite has more reflections and a larger refinement model, and it reports lower agreement indicators and a better goodness-of-fit than bouškaite, so direct comparison of refinement quality should consider the different experimental setups and data completeness.
Fractional atomic coordinates and isotropic displacement parameters (Å2) for liangjunite

Table 4 Long description
Fractional atomic coordinates (x over a, y over b, z over c) are reported for K, Mo, S, O, and H sites in liangjunite, along with isotropic displacement values and site occupancies. Most atoms have full occupancy of 1, while K2 is partially occupied at 0.730 with an uncertainty of 0.005. Two alternative positions are given for oxygen site 16: O16A has occupancy 0.53 and O16B has occupancy 0.47, indicating positional disorder split across two locations. Displacement values are lowest for the molybdenum sites (about 0.015 to 0.016) and sulfur sites (about 0.016 to 0.017), suggesting comparatively well-defined positions. Many oxygen sites have intermediate displacement values around 0.02 to 0.04, while O16A and O16B have the highest values (about 0.073 to 0.078), consistent with the noted disorder. Hydrogen atoms are listed only for O14 and O15, each with two H positions and displacement values around 0.036 to 0.041. Coordinate values span roughly 0.01 to 1.16, so some entries slightly above 1 likely reflect crystallographic wrapping rather than out-of-range positions.
Anisotropic displacement parameters (Å2) of atoms for liangjunite

Table 5 Long description
Anisotropic displacement parameters for atoms in liangjunite are listed as U11, U22, U33 and the cross terms U12, U13, and U23, with values reported in squared angstroms and uncertainties in parentheses. Oxygen O6 stands out with the highest displacement, especially along the third principal component (U33 about 0.066), notably larger than its U11 and U22. The molybdenum sites Mo1 and Mo2 have the lowest overall displacements, with U22 near 0.0096 and U11 and U33 around 0.017 to 0.021, indicating comparatively rigid positions. Potassium shows larger motion than molybdenum and sulfur, particularly K2 with U22 about 0.0515 and U11 about 0.0431, while K1 is lower and more even (roughly 0.022 to 0.027). Sulfur S1 and S2 are moderate, with S2 having a higher U33 (about 0.0275) than S1 (about 0.0185). Many oxygen atoms have elevated or directionally uneven values; for example O2 and O12 have U33 around 0.044, and O3 and O4 show relatively high U11 with moderate U22. Cross terms are generally small in magnitude compared with the main U components, with several near zero and a few modest negatives such as K2 U12 and O1 U12. Comparisons should consider the reported uncertainties, but the main pattern is highest mobility for selected oxygen and potassium sites and lowest for molybdenum.
Selected bond lengths (Å) and angles (°) for liangjunite

Table 6 Long description
Bond lengths are listed for three coordination groups in liangjunite: two sulfate tetrahedra (S1 and S2), two molybdenum oxygen octahedra (Mo1 and Mo2), and two potassium oxygen polyhedra (K1 and K2), with uncertainties in parentheses. Sulfate S to O distances are tightly grouped: S1 to O ranges from 1.440 to 1.489 angstroms with an average of 1.468, and S2 to O ranges from 1.439 to 1.501 with an average of 1.471. Molybdenum oxygen distances span a wider range, from short bonds near 1.688 to 1.693 angstroms (for example Mo1 to O9 and Mo1 to O10, and Mo2 to O11 and Mo2 to O12) to longer bonds up to 2.286 angstroms (Mo2 to O14) and 2.259 angstroms (Mo1 to O15). Average Mo to O distances for the octahedra are very similar, 1.975 for Mo1 and 1.977 for Mo2, while the shorter subset averages are 1.762 for Mo1 and 1.757 for Mo2. Potassium oxygen contacts are longer and more variable, mostly about 2.76 to 3.12 angstroms, with mean values of 2.929 for K1 and 2.901 for K2. Several potassium sites list two distances to the same oxygen label, indicating multiple contacts or split positions (for example K2 to O16A and K2 to O16B). Comparisons should consider that some entries report multiple distances per pair and that the listed uncertainties indicate measurement precision.
Hydrogen bonding geometries (D – donor, A – acceptor)

Table 7 Long description
Hydrogen bond geometry measurements are listed for four O to H to O interactions, giving donor to hydrogen length, hydrogen to acceptor distance, donor to acceptor distance, and the donor hydrogen acceptor angle. Donor to hydrogen lengths are consistent at about 0.90 angstroms with small uncertainties. Hydrogen to acceptor distances range from about 1.91 to 2.05 angstroms, with the shortest for O15 H15a to O2 and the longest for O15 H15b to O6. Donor to acceptor distances span about 2.766 to 2.885 angstroms, with O15 H15a to O2 the shortest and O15 H15b to O6 the longest. Angles are all relatively close to linear, ranging from about 153 to 160 degrees, with the most linear bond being O14 H14a to O2. Overall, the two bonds to O2 are slightly shorter and slightly more linear than the corresponding bonds to O6. Values include parenthetical uncertainties, so small differences may not be statistically meaningful.
Calculated bond-valence sums (valence units) for liangjunite

Table 8 Long description
Calculated bond-valence contributions are listed for each oxygen site in liangjunite from cations K1, K2, Mo1, Mo2, and S1 and S2, plus hydrogen donors H14a, H14b, H15a, and H15b, with a per-oxygen total at right. Most oxygen totals are close to 2.0 valence units, ranging from 1.86 at O5 to 2.15 at O13, indicating broadly consistent oxygen valence satisfaction. Strong Mo contributions occur at O9 and O10 for Mo1 (about 1.78 and 1.80) and at O11 and O12 for Mo2 (about 1.81 and 1.80). Sulfur contributions dominate several sites, including O1, O2, O3, and O4 from S1 (about 1.44 to 1.65) and O5, O6, O7, and O8 from S2 (about 1.40 to 1.65). Hydrogen bonding is concentrated at O14 (H14a about 0.79 and H14b about 0.77) and O15 (H15a about 0.75 and H15b about 0.76), with smaller hydrogen contributions at O2 and O6. Two split sites, O16A and O16B, show very small totals (about 0.07 and 0.05) and only receive K2 contributions. Column totals show overall contributions of about 6.02 for Mo1, 6.05 for Mo2, 6.10 for S1, 6.07 for S2, 1.25 for K1, and 0.67 for K2, with hydrogen totals near 0.9 to 1.0 per hydrogen label. Values for K2 are based on a partial site occupancy, so K2-related contributions and totals should be interpreted with that refinement constraint in mind.
Note: *The bond valence sums for K2 were calculated based on the site occupancy of 0.73 from the structure refinement.
Structure description and discussion
Structure description
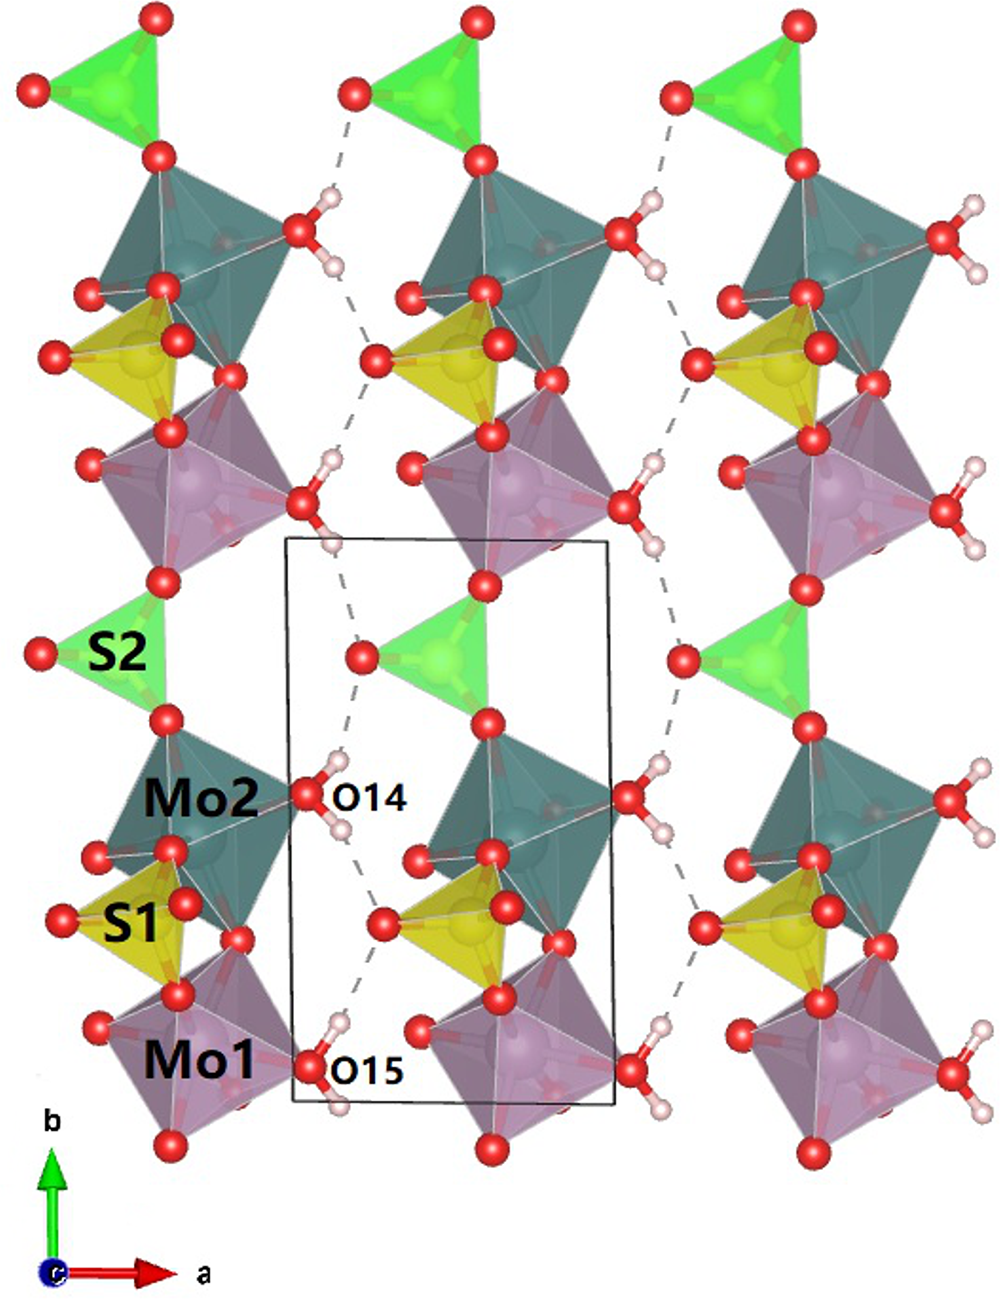
Liangjunite is structurally related with bouškaite, (MoO2)2O(SO3OH)2(H2O)2·2H2O (Sejkora et al., Reference Sejkora, Grey, Kampf, Plášil and Škácha2019). The principal crystallographic data of both are compared in Table 3. Its crystal structure can be viewed as being built from three different layers parallel to (001) (Fig. 4). Layer A consists of only K1 cations, Layer B (K2 + O16), and Layer C heteropolyhedral chains made of SO4 tetrahedra sharing corners with MoO6 octahedral dimers. These layers are stacked along [001] in the sequence of A–C–B–C–A. The heteropolyhedral chains in Layer C, which have a composition [(Mo2O5)(H2O)2(SO4)2]2– and extend along the b-axis, are linked together by hydrogen bonds provided by H2O molecules (O14 and O15) coordinated to Mo6+ cations (Fig. 5).
Crystal structure of liangjunite viewed along [010], showing the configuration of the heteropolyhedral chains and the linkage between them.

Figure 5 Long description
Crystal structure of liangjunite viewed along the b-axis, illustrating the arrangement of heteropolyhedral chains. The chains consist of SO4 tetrahedra, shown in green, sharing corners with MoO6 octahedral dimers, depicted in purple. These chains are linked by dashed lines representing hydrogen bonds. The image includes labels for S1, S2, Mo1, Mo2, O14 and O15, indicating specific atoms within the structure. The orientation is marked with axes labeled a and b, with a directional arrow in the bottom left corner. The boxed area highlights a section of the structure, emphasizing the coordination of H2O molecules, O14 and O15, to Mo6+ cations.
Like those in bouškaite (Sejkora et al., Reference Sejkora, Grey, Kampf, Plášil and Škácha2019), the two distinct MoO6 octahedra (Mo1O6 and Mo2O6) in liangjunite are also considerably distorted, each having three short Mo–O bonds (between 1.688 and 1.904 Å) and three long ones (between 2.098 and 2.286 Å) (Table 6). Such highly distorted octahedral coordinations are typical for Mo6+ cations and have been observed in many Mo6+-bearing materials (e.g. Krivovichev and Burns Reference Krivovichev and P.C2000; Yang et al., Reference Yang, Gu, Sousa, Gibbs, McGlasson and Downs2023). The MoO6 octahedra are so distorted that individual Mo2O52+ groups exists by corner-linked MoO3 tripyramids through O13 if the ionic radii of 0.59 Å for Mo6+ and 1.36 Å for O2– are considered (Shannon, Reference Shannon1976) and the Mo–O bonding length is restricted to less than 1.95 Å. Therefore, the structural formula of liangjunite may be written as K2(Mo2O5)(SO4)2·3H2O. The K+ cation at the K1 site is coordinated by ten O atoms, whereas that at the K2 site is only coordinated by five O atoms plus two H2O molecules (O14 and O16). It is noteworthy that the structure refinement indicates a partial occupancy of K at the K2 site (K = 0.73). The charge imbalance resulting from this K deficiency may be compensated by incorporation of (OH)– into the O1 and O5 sites, the two non-bridging O atoms that belong to the S1O4 and S2O4 groups, respectively. These two O atoms in isomorphous bouškaite exhibit significant hydroxyl character as indicated by the calculated bond-valence sums (Sejkora et al., Reference Sejkora, Grey, Kampf, Plášil and Škácha2019).
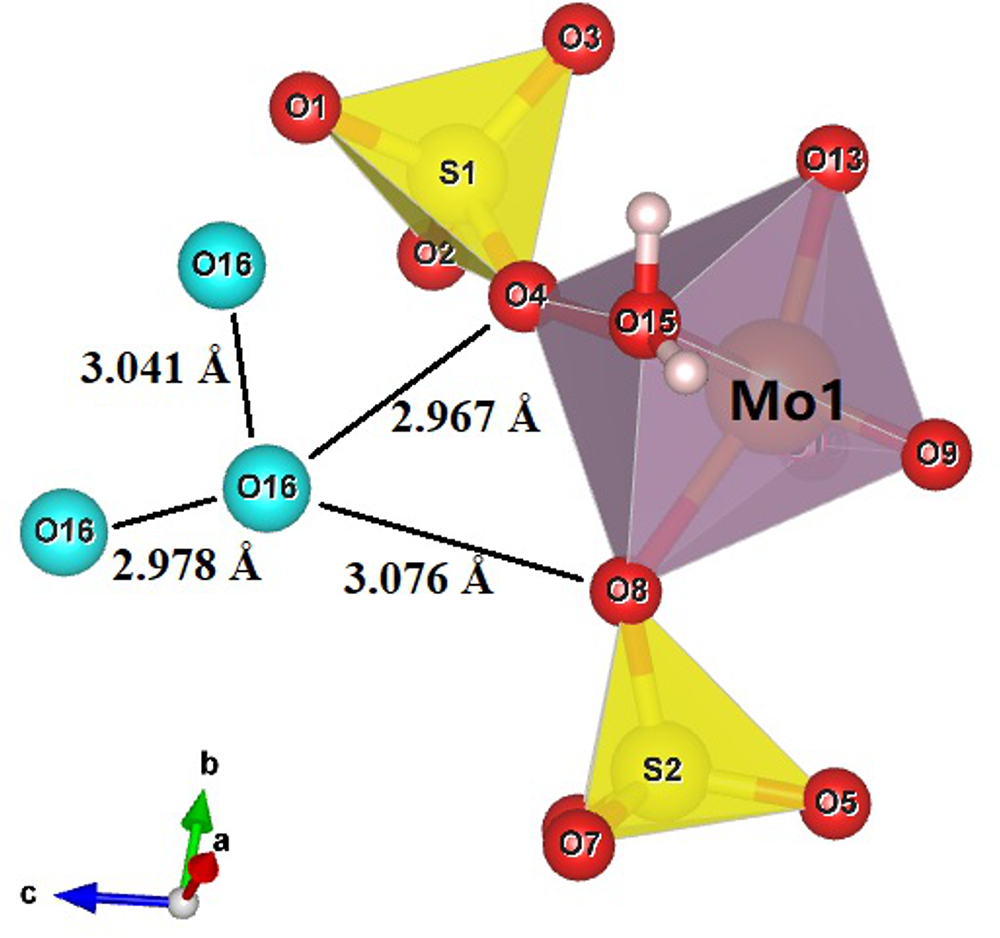
Although our structure refinement did not locate H atoms bonded to O16A and O16B, the calculated bond-valence sums (Table 8) indicates that it is a H2O molecule. An examination of O···O distances around O16 suggests possible hydrogen bonding between O16A···O16A (=2.36 Å), O16B···O16B (= 2.31 Å), O16A···O4 (= 2.975 Å), and O16B···O8 (= 3.072 Å), as illustrated in Fig. 6.
Possible hydrogen bonding scheme for O16 in liangjunite [plotted with freeware VESTA (Momma and Izumi, Reference Momma and Izumi2011)].

Figure 6 Long description
Molecular structure featuring a central Mo1 atom surrounded by various other atoms and polyhedral shapes. Mo1 is connected to O1, O2, O3 and O4, forming a purple polyhedron. Two yellow tetrahedra labeled S1 and S2 are connected to O1, O2 and O5, O6, respectively. The O16 atom is shown twice, connected to O1 and O4, with bond lengths of 3.041 angstroms and 2.978 angstroms, respectively. Additional bond lengths are indicated: 2.967 angstroms between O4 and O15 and 3.076 angstroms between O16 and O8. A coordinate system with axes labeled a, b and c is shown in the bottom left corner, with a in red, b in green and c in blue.
The major structural differences between liangjunite and bouškaite lies in the fact that the two H2O molecules, Ow3 and Ow4, in bouškaite are replaced by two K+ cations, K1 and K2, respectively, with an additional H2O molecule (O16) in liangjunite. It is also noted that the data for bouškaite were collected at 100 K whereas those of liangjunite were collected at room temperature. The charge balance is achieved through the coupled substitution: 2H2O + 2(SO3OH)– <—> 2K+ + 2(SO4)2–. Owing to the substitution of 2K+ for 2H2O pfu, the c and a dimensions for liangjunite are significantly shorter than those for bouškaite (Table 3), indicating a decrease in the interlayer distance along the c-axis and the interchain distance along the a-axis in liangjunite. In contrast, the bond lengths and angles within the heteropolyhedral chain along the b-axis are little changed.
Discussion
From the crystal-chemical point of view, Mo6+-bearing materials can be classified into two major groups, group A containing isolated MoO4 tetrahedra (e.g. wulfenite and powellite) and group B MoO6 octahedra. Group B can be further divided into several subgroups depending on the linkages between MoO6 octahedra: (1) group B1 with isolated MoO6 octahedra, e.g. synthetic MoO(HSO4)(SO4) (Betke et al., Reference Betke, Neuschulz and Wickleder2011); (2) group B2 with corner-shared dimers, e.g. liangjunite (this study) and bouškaite (Sejkora et al., Reference Sejkora, Grey, Kampf, Plášil and Škácha2019), or edge-shared dimers, e.g. vajdakite (Ondruš et al., Reference Ondruš, Skála, Císařová, Veselovský, Frýda and Čejka2002); (3) group B3 with corner-shared or edge-shared single chains, e.g. synthetic Mo3O5(OH)2(AsO4)2 (Kasthuri et al., Reference Kasthuri, Joubert, Verbaere, Tournoux and Gopalakrishnan1997) and biehlite (Adiwidjaja et al., Reference Adiwidjaja, Friese, Klaska, Schlüter and Czank2000), edge-shared double chains, e.g. raydemarkite (Yang et al., Reference Yang, Gu, Sousa, Gibbs, McGlasson and Downs2023) and downsite (Gu et al., Reference Gu, Yang and Marty2023c), or corner-shared bands (quadruple chains), e.g. vanpeltite (Gu et al., Reference Gu, Yang, Kampf, Thorne, Gibbs, Scott and Downs2023d); (4) group B4 with corner- and edge-shared layers, e.g. sidwillite and molybdite (Kihlborg, Reference Kihlborg1963; Cesbron and Ginderow, Reference Cesbron and Ginderow1985; Sitepu, Reference Sitepu2009); (5) group B5 with complex heteropolymolybdate forms, e.g. ‘betpakdalite and obradovicite’ (Kampf et al., Reference Kampf, Mills, Rumsey, Dini, Birch, Spratt, Pluth, Steele, Jenkins and Pinch2012).
Molybdosulfate materials have been the subject of increasing interest because of their potential applications in catalysis, photochemistry, and materials sciences (e.g. Cao et al., Reference Cao, Xiong, Xue, Min, Hu and Xue2013; Krivovichev, Reference Krivovichev2014). Nevertheless, they are relatively rare in nature. To date, only six minerals containing both S6+ and Mo6+ cations have been documented, including liangjunite, bouškaite (Sejkora et al., Reference Sejkora, Grey, Kampf, Plášil and Škácha2019), downsite, K2(MoO3)3(SO4)·4H2O (Gu et al., Reference Gu, Yang and Marty2023c), hasanovite, KNa(MoO2)(SO4)2 (Mirakov et al., Reference Mirakov, Pautov, Siidra, Makhmadsharif, Karpenko and Plechov2023), novikovite, (NH4)4Mo6+2Mo5+2O8(SO4)5 (Pautov et al., Reference Pautov, Mirakov, Siidra, Chukanov, Borisov, Karpenko, Plechov and Makhmadsharif2022), and vergasovaite, Cu3O(MoO4)(SO4) (Bykova et al., Reference Bykova, Berlepsch, Kartashov, Brugger, Armbruster and Criddle1998). Although the chemical composition of liangjunite is similar to that of downsite, which was discovered from the same locality, their structures are different. In downsite, highly distorted MoO6 octahedra share edges to form double chains, which are topologically identical to those in molybdite, MoO3 (Kihlborg, Reference Kihlborg1963; Sitepu, Reference Sitepu2009) and raydemarkite, MoO3·H2O (Yang et al., Reference Yang, Gu, Sousa, Gibbs, McGlasson and Downs2023). Such double chains are attached with SO4 tetrahedra, with K+ and H2O situated between the chains.
Supplementary material
The supplementary material for this article can be found at https://doi.org/10.1180/mgm.2025.10162
Acknowledgements
We would like to express our deep respect and memory for Mr. Mike Scott (1945–2025). His great support for the RRUFF project and numerous researches in mineralogy are remembered forever all over the world. We are grateful to the reviewers for the constructive comments. The study was supported by the National Natural Science Foundation of China (Grant Nos. 42072054, 41172042 to X.G.).
Competing interests
The authors declare none.