Introduction
Human activities, including tourism, in the Antarctic Peninsula region and their potential impacts on the environment have been a concern since 1966 (Antarctic Treaty Consultative Meeting (ATCM) IV Recommendation IV-27, see ATCP 1966). Human visitation may impact wildlife, such as seabirds and seals, entire ecosystems, such as shallow invertebrate-dominated ecosystems (Clark et al. Reference Clark, Raymond, Riddle, Stark and Johnston2015), and abiotic elements, such as Antarctic soils (Tejedo et al. Reference Tejedo, Pertiera and Benayas2014). A recent meta-analysis showed that human disturbance has a small, but statistically significant, negative effect on Antarctic wildlife (Coetzee & Chown Reference Coetzee and Chown2015), and understanding human impacts on wildlife and the environment was recently highlighted as one of the six priorities for Antarctic science (Kennicutt et al. Reference Kennicutt, Chown, Cassano, Liggett, Massom, Peck, Rintoul, Storey, Vaughan, Wilson and Sutherland2014). While much of the concern in this regard has focused on activities surrounding scientific research (e.g. station construction, transport activities; Tin et al. Reference Tin, Fleming, Hughes, Ainley, Convey, Moreno, Pfeiffer, Scott and Snape2009, Hughes et al. Reference Hughes, Convey, Maslen and Smith2010, Peter et al. Reference Peter, Braun, Janowski, Nordt, Nordt and Stelter2013), the spatial distribution of tourism activities and the movement patterns of tour vessels between sites (e.g. Lynch et al. Reference Lynch, Crosbie, Fagan and Naveen2010) are of particular interest for studies of biological invasion and cumulative anthropogenic impacts on the Antarctic environment (Frenot et al. Reference Frenot, Chown, Whinam, Selkirk, Convey, Skotnicki and Bergstrom2005, Barnes et al. Reference Barnes, Hodgson, Convey, Allen and Clarke2006, Hughes et al. Reference Hughes, Fretwell, Rae, Holmes and Fleming2011). Beginning in the 1989/90 Antarctic tour season (October to March), the US National Science Foundation began compiling tourist visitation data. Shortly thereafter, the International Association of Antarctica Tour Operators (IAATO) began aiding in the compilation of these data, including annual totals of visitor numbers and visitors ashore at specific landing sites. Studies of vessel-based tourism on the Antarctic Peninsula were initially limited to cataloguing passenger landings (Enzenbacher Reference Enzenbacher1992, Naveen Reference Naveen1997, Reference Naveen2003, Naveen et al. Reference Naveen, Forrest, Dagit, Blight, Trivelpiece and Trivelpiece2001, IAATO 2005), analyses of passenger activities at specific landing sites (Fraser & Patterson Reference Fraser and Patterson1997, Crosbie Reference Crosbie1998, Pfeiffer & Peter Reference Pfeiffer and Peter2004), and cataloguing sites of high biodiversity that may be vulnerable to disturbance (Naveen et al. Reference Naveen, Forrest, Dagit, Blight, Trivelpiece and Trivelpiece2001, Naveen Reference Naveen2003). Because these site-focused analyses ignored potential impacts due to vessel traffic itself, Lynch et al. (Reference Lynch, Crosbie, Fagan and Naveen2010) analysed the spatial patterns of tour ship traffic from the 2003/04 season to the 2007/08 season to identify areas of concentrated marine activity along the Antarctic Peninsula. Spatial data on ship traffic and access routes make it possible to conduct more detailed studies of both passenger landings and marine traffic patterns, such as may be required to evaluate potential impacts on marine ecosystems (Aronson et al. Reference Aronson, Thatje, McClintock and Hughes2011), vegetation (Pertierra et al. Reference Pertierra, Lara, Tejedo, Quesada and Benayas2013) and the introduction of non-indigenous species (Cowan et al. Reference Cowan, Chown, Convey, Tuffin, Hughes, Pointing and Vincent2011, Chown et al. Reference Chown, Huiskes, Gremmen, Lee, Terauds, Crosbie, Frenot, Hughes, Imura, Kiefer, Lebouvier, Raymond, Tsujimoto, Ware, van de Vijer and Bergstrom2012, Greenslade et al. Reference Greenslade, Potapov, Russell and Convey2012, McGeoch et al. Reference McGeoch, Shaw, Terauds, Lee and Chown2015). The Antarctic Treaty System, in concert with Parties to the Antarctic Treaty, provides several mechanisms for managing Antarctic site visitation. Among these are a system of permits that control permitted activities in the Antarctic, and, in conjunction with IAATO, the development of Antarctic Visitor Site Guidelines, which are instructions for visitors that take into account site-specific sensitivities, safety considerations and environmental values (ATCP 2006). Effective management of human activities in Antarctica hinges, to a certain extent, on being able to forecast patterns (numbers, types of activities) of Antarctic visitation, and accurate forecasts require a detailed understanding of historic patterns and the economic and regulatory factors that influenced them.
In 2011, the Antarctic Treaty Committee for Environmental Protection (CEP) wrote a report summarizing the state of Antarctic tourism (ATCM 2012). At the time the report was drafted, Antarctic visitation had experienced several years of decline, and it was suggested that one reason for this decline had been the withdrawal of several large ships that could not operate in the Antarctic following the International Maritime Organization’s ban on heavy fuel oil in the Antarctic Treaty Area (MARPOL Annex 1 Chapter 9; Resolution MEPC.189[60]). Also noted in the CEP report was that IAATO’s 1-year forecasts of visitation numbers do not lend themselves to longer term forecasts of Antarctic tourism or identify particular areas that are likely to experience disproportionate growth in visitation in the future. The report made eight recommendations with respect to facilitating future management of tourism, one of which highlighted the desirability of a regular review of tourism trends particularly at highly visited sites and those considered to be particularly sensitive to impact.
To address some of these questions, and to provide a longer time series on which to build more robust, spatially explicit forecast models for Antarctic tourism activity, we expand the original Lynch et al. (Reference Lynch, Crosbie, Fagan and Naveen2010) analysis by using previously undigitized records from the 1990s and early 2000s and new information from the five years since the original vessel traffic analysis. This extended analysis of Antarctic landings and vessel traffic over the last two decades provides greater perspective on long-term trends in the spatial pattern and intensity of vessel-based tourism traffic, considers the socioeconomic and environmental drivers that influence patterns of visitation, and allows us to consider the impact of Visitor Site Guidelines on the number of landings and associated patterns of vessel traffic in the region. We also briefly consider correlations between global economic conditions and growth in Antarctic tourism, and provide some context on emerging markets for Antarctic tourism that may be useful in projecting future demand.
Methods
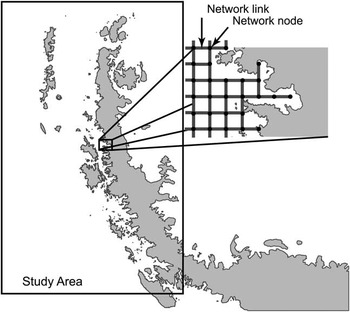
Tourism statistics provided by IAATO from 25 seasons (1989/90–2013/14; dataset A) were used to evaluate patterns of passenger numbers, landings and associated nationalities (available at http://iaato.org/tourism-statistics). To investigate ship traffic patterns, photocopied (and typically hand written) records on vessel itineraries from the 1993/94 season up to and including the 2001/02 season, as provided by the US National Science Foundation and IAATO, were manually transcribed. All available records were digitized but we cannot verify whether these records are complete with respect to all companies operating in the Antarctic during this period. Site visitation data since the 2002/03 season (also digitized) were provided exclusively by IAATO and are thus restricted to the activities of IAATO member companies. These companies encompass>95% of all commercial cruise ships operating on the Antarctic Peninsula (100% of all commercial cruise companies since the 2008/09 season) and c. 90% of all known visitors to sites in this region. Between the newly and previously digitized records (seasons 1993/94–2012/13) there is a complete 20 year record of individual ship landings, including locations and times for passenger landings and associated activities (dataset B). Note that prior to the 2008/09 season, post-visit reports did not account for scenic cruising not involving a passenger landing, even though these cruises may have included multiple stops and/or deployment of small boats; more recent records include these additional vessel-based activities. All itineraries that passed through the Antarctic Peninsula region were included (Fig. 1); itineraries that did not pass through this area were not considered in our study of vessel traffic but would be included in the summary statistics on total passenger visitation provided by IAATO. There were 3133 itineraries in the final dataset of tour vessel movement.
Map showing the region of the Antarctic Peninsula considered in this study. The square grid network (inset: nodes (circles) and links (lines)) does not include points that fall on land. (Reproduced from Lynch et al. Reference Lynch, Crosbie, Fagan and Naveen2010.)

Because information on ship routing between stops was unavailable, the most likely route the ships travelled between activity locations was reconstructed using the method described in Lynch et al. (Reference Lynch, Crosbie, Fagan and Naveen2010). Briefly, the waters surrounding the Antarctic Peninsula were divided into a square grid network of locations (Fig. 1). Grid nodes were spaced 6 km apart in this network and travel between nodes was permitted in the four cardinal directions. Unless otherwise indicated by the itinerary, ships were assumed to have started their itineraries from Ushuaia, Argentina, and to have entered the network at the node closest to the ships’ first known location. Ships were also assumed to have followed the shortest path on the network connecting each activity location to the next. Since the network only includes nodes on the water, reconstructed ship routes include navigation around islands and other terrestrial obstacles. To account for slight variations in the travelled path between landings, a small amount (±10%) of random variation was added to the node-to-node distance between each adjacent node in the network for each path calculation. This avoided an artificially high intensity of ship travel resulting from the arbitrary but repeated selection of one path among many equal length paths between two landing locations. The final tally of ship traffic between each node and its neighbouring nodes was spatially smoothed using inverse distance weighting to create a continuous two-dimensional map of tour ship traffic throughout the Peninsula waters. Using these methods, the concentration of seasonal vessel-based traffic can be quantified. We fit a simple linear model, which provided a better fit to the complete time series than the exponential model used in Lynch et al. (Reference Lynch, Crosbie, Fagan and Naveen2010), to the intensity of traffic over the full 20 year period, and separately to the most recent five seasons examined to quantify rates of change in vessel activity over the most recent period.
To assess the relationship between the volume of Antarctic tourism and global economic conditions, the average Gross Domestic Product (GDP; World Bank 2014) was calculated for the USA, Australia, Germany and the UK, whose citizens have represented the largest proportion of visitors to the region over the last two decades. The GDP data (1989–2012) for these four countries were rescaled between 0 and 1 prior to averaging to create a common index of growth over the period of record that could be compared against the number of passenger landings in each year over the same period.
Results
Passenger landing trends (dataset A)
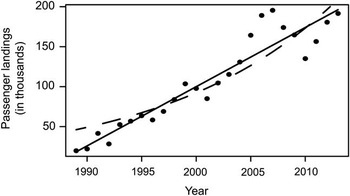
While the overall number of passengers landed has increased drastically since the 1989/90 season (Fig. 2), this increase has not been distributed equally over the Antarctic Peninsula. While the exponential rate of increase in landings Peninsula-wide was 6±1% per annum (mean±1 standard error) from the 1989/90 season to the 2013/14 season, several sites such as Neko Harbour (10±1% per annum), Goudier Island (10±2% per annum), and Cuverville Island (8±1% per annum) saw larger gains. During the 1989/90 season, no site received more than 2000 visitors, while in the 2000/01, 2007/08 (season with the most passenger landings overall) and 2012/13 seasons the number of sites receiving at least 2000 visitors was 15, 20 and 24, respectively. More than 16 000 passenger landings in the 2012/13 season were recorded at two sites (Neko Harbour and Goudier Island).
Number of passenger landings for the 1989/90–2013/14 seasons. The solid line represents a linear fit to the data (slope=7407 passenger landings per annum) and the dashed line represents an exponential fit to the data (rate of increase=6.3% per annum). Unlike the shorter time series examined in Lynch et al. (Reference Lynch, Crosbie, Fagan and Naveen2010), the linear model fits better than the exponential model (AIC=568 vs 580).

Another way to conceptualize the concentration of tourism activity is to consider the area visited by passengers rather than the number of sites. If the total area visited by tourists (based on our collective knowledge of visitation patterns and areas derived from satellite imagery) at the two dozen most popular landing sites in 2012/13 is summed, 76.6% of all landings occur on c. 200 hectares of land, which equates to less than one-sixth of the area of London’s Heathrow airport. This area represents<0.1% of all the snow- and ice-free terrain in the Antarctic Peninsula, South Shetland Islands and South Orkney Islands.
Vessel traffic trends (dataset B)
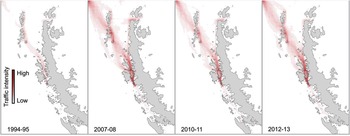
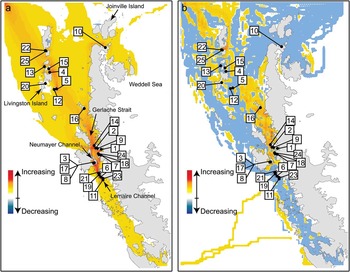
The trend towards increased concentration of Antarctic visitation is visible in the growth of vessel-based marine traffic (Figs 3 & 4). The highest concentrations of marine traffic exist in the Lemaire and Neumayer channels. While nearly all sites saw increasing traffic over the last two decades, growth has been notably slower in areas such as Livingston Island, Joinville Island and Weddell Sea areas, e.g. Paulet Island (Fig. 4). For the Joinville Island and Weddell Sea areas this is primarily due to constraints imposed by sea ice. In the five year period since our original analysis (2008/09–2012/13), heavy sea ice has precluded many trips from venturing south of the Lemaire Channel, and traffic along the southern portion of the western Antarctic Peninsula has actually declined slightly. Conversely, the coast between Mikkelsen Harbour and Vernadsky Station, including the sheltered Gerlache Strait, which tends to be ice-free earlier in the summer season, has continued to see increasing traffic even in this most recent five year period. Over 35% of the first Antarctic landings on each itinerary occur at only four sites, all of which are located in the South Shetland Islands. Barrientos Island in the Aitcho Islands is the most popular ‘first landing’ site (15.7%), followed by Half Moon Bay (7.8%), Penguin Island (6.2%) and Whalers Bay on Deception Island (5.4%).
Map of intensity of vessel traffic in four seasons from 1994/95–2012/13.

a. Overall change in vessel traffic from the 1993/94 to 2012/13 seasons, and b. overall change in vessel traffic from the 2008/09 to 2012/13 seasons (the five seasons following the Lynch et al. Reference Lynch, Crosbie, Fagan and Naveen2010 analysis). For orientation, the top 25 most popular landing sites (in the 2013/14 season) are indicated by numbers (in order of rank): 1) Neko Harbour, 2) Cuverville Island, 3) Goudier Island, 4) Half Moon Island, 5) Whalers Bay, Deception Island, 6) Petermann Island, 7) Brown Station, 8) Jougla Point, 9) Danco Island, 10) Brown Bluff, 11) Vernadsky Station, 12) Telefon Bay, 13) Barrientos Island, Aitcho Islands, 14) Orne Harbour, 15) Yankee Harbour, 16) Mikkelsen Harbour, 17) Damoy Point/Dorian Bay, 18) Paradise Bay, 19) Pléneau Island, 20) Hannah Point, 21) Port Charcot, 22) Great Wall Station, 23) Yalour Islands, 24) Waterboat Point/Gonzalez Videla Station, 25) Bellingshausen Station.

Landing trends of sites with Visitor Site Guidelines (dataset A)
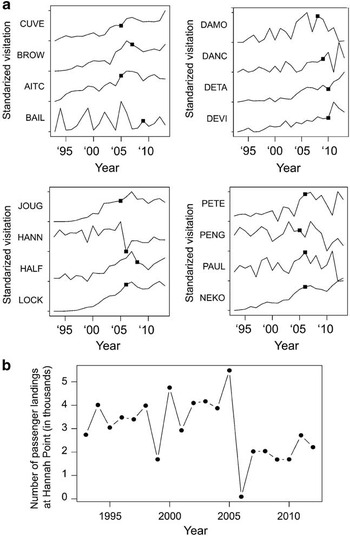
With the exception of Hannah Point, the introduction of Visitor Site Guidelines has had no effect on overall patterns of visitation at sites restricted by such guidelines (Fig. 5a). Since its passenger visitation peak in 2005/06, visitation to Hannah Point dropped sharply and has remained fairly steady (Fig. 5b). The Hannah Point Visitor Site Guidelines originated because of the perceived high sensitivity of the site due to its density and diversity of wildlife and were the first ATCM Visitor Site Guidelines to explicitly suggest a period early in the season where no visitation is to occur (ATCP 2006). This, and the limit of only one visit per day once the site is ‘open’, is likely to be the cause of the sharp drop in visitation since the guidelines were adopted, and suggest that site visit restrictions may be an effective way of lowering overall attendance at some sites deemed particularly sensitive to visitation.
a. Visitation over time at 12 locations that have adopted Visitor Site Guidelines (VSG). The date of VSG adoption is indicated as a solid black square. Each time series has been standardized (visitation scaled from 0–1) for display. CUVE=Cuverville Island, BROW=Brown Bluff, AITC=Barrientos Island, Aitcho Islands, BAIL=Baily Head, DAMO=Damoy Point, DANC=Danco Island, DETA=Detaille Island, DEVI=Devil Island, JOUG=Jougla Point, HANN=Hannah Point, HALF=Half Moon Island, LOCK=Port Lockroy, PETE=Petermann Island, PENG=Penguin Island, PAUL=Paulet Island, NEKO=Neko Harbour. b. Visitation at Hannah Point.

Relationship to penguin distributions (dataset A)
Over the 20 year period of vessel movements considered in this analysis, there have been major changes in the Peninsula region, particularly in the abundance and distribution of the penguin community on the western Antarctic Peninsula; gentoo penguins (Pygoscelis papua Forster) have increased in abundance and have colonized new sites, whereas both Adélie penguins (P. adeliae (Hombron & Jacquinot)) and chinstrap penguins (P. antarctica Forster) have experienced widespread declining abundance due to factors unrelated to tourism activity, such as changing climatic conditions. Consistent with these trends, sites with gentoo penguin colonies now represent the overwhelming proportion of all Antarctic landings. In the 2013/14 season,>73% of all landings (at any of the 50 most popular landing sites for that year) included a gentoo penguin colony, as compared to 20% and 16% for chinstrap and Adélie penguins, respectively. (Note: many sites contain more than one species of breeding penguin.) In the 1993/94 season, by contrast, only 59% of all landings (at any of the 50 most popular landing sites for that year) included a gentoo penguin colony, whereas chinstrap and Adélie penguins were present at 29% and 27% of all landings, respectively. Many chinstrap penguin colonies are at sites where swell and terrain make zodiac landings difficult (e.g. Baily Head, Point Wild), and many Adélie penguin colonies have seen sharply declining visitation in the last few years due to heavy sea ice coverage in the Weddell Sea (e.g. Paulet Island, Devil Island).
Season length (dataset B)
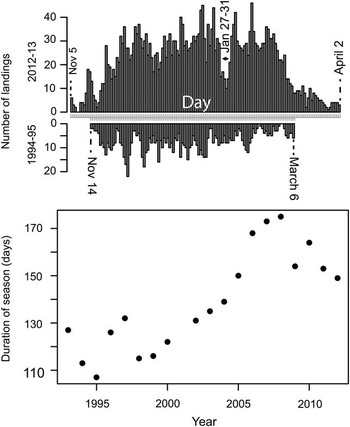
As the years have passed, the duration of the Antarctic Peninsula tourism season (defined as the number of days between the first Peninsula landing and the last) has grown in accordance with the increase in passenger landings (Fig. 6). The longest season (175 days from first landing to last) was in 2008/09 and was 68 days longer than the shortest season (107 days) in 1995/96. Part of this increase in the length of the season stemmed from the use of the icebreaker Kapitan Khlebnikov and the discovery of the Snow Hill Island emperor penguin colony (a landing site that usually requires an icebreaker), which permitted emperor penguin focused trips in early October before the traditional Antarctic summer visitation season starts in November. While the current absence of icebreakers from the Antarctic fleet has eliminated the earliest of these itineraries in the last several years, the tourism season is still beginning earlier (late October) and ending later (late March/early April) than was the case 20 years ago.
Visitation through summer for the 1994/95 and 2012/13 seasons (top) and the change in season length over time (bottom).

The global economic context of Antarctic tourism (dataset A)
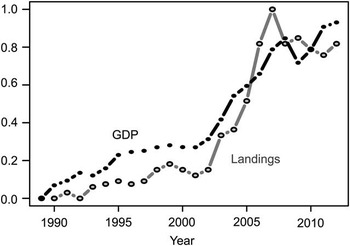
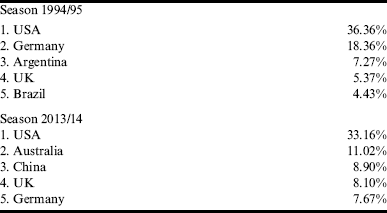
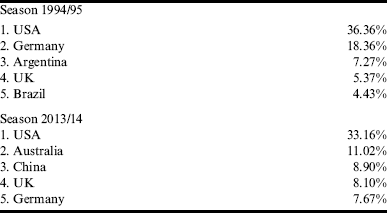
The nationalities of Antarctic tourists have changed dramatically in the last 20 years (Table I). One of the most striking recent changes has been the increase in passengers from China, which entered the top five most represented countries for the first time in 2012/13 and now represents 9% of all passengers visiting the Antarctic. This increase in the number of visitors from China is reflected in the increase in travel to, and in the vicinity of, China’s Great Wall Station on King George Island (Fig. 4b). While Australia has been a consistent member of the top five represented countries in Antarctic tourism since the 1995/96 season, the percentage of passengers from Australia has also increased dramatically. Unsurprisingly, Antarctic tourism was strongly correlated with GDP in those countries with the largest number of citizens travelling to the region (Fig. 7), though the strength of the correlation is complicated by the strong positive growth in both time series. Interestingly, Antarctic tourism declines one year in advance of the decline in GDP (as measured by our multinational summary metric). This would be consistent with the hypothesis that potential visitors base their decisions on their expectations for future economic growth, and may be more hesitant to commit to an Antarctic cruise if the economy is weakening. A rigorous economic model of Antarctic tourism, which was outside the scope of our analysis, may provide more robust predictions for future growth in the industry.
Average index of GDP in current USD (black) and number of passenger landings (grey) from 1989–2012. The GDP data (1989–2012) for the USA, Australia, Germany and the UK were rescaled between 0 and 1 to create a common index of growth over the period of record prior to averaging.

Top five nationalities among tourists to the Antarctic region in 1994/95 and 2013/14, the associated percentage of total visitors in that year.
Discussion
Antarctic tourism: can we use the past to predict the future?
At the time of the sudden slowdown in Antarctic tourism that was seen starting in the 2008/09, it was not clear whether the apparent plateau stemmed from the global recession, suggesting only a temporary pause in growth, or longer term drivers such as market saturation or the ban on the use and carriage of heavy fuel oil. Data from the most recent period make clear that this decline has been replaced by growth in the last few seasons (Fig. 2), and now the volume of Antarctic tourism activity is nearing its 2007/08 peak. Because the rise of Antarctic tourism has closely mirrored trends in GDP (Fig. 7), it appears to be most likely that the recent decrease (2007–10) in visitation is only a temporary response to global economic conditions and does not indicate a permanent shift in market conditions. The increasing popularity of Antarctica among Chinese tourists is particularly noteworthy. As this segment of the market has grown, there is an expansion of the number of Chinese companies marketing group tours to Antarctica and providing translation services; these accommodations are likely to fuel further growth in the number of Chinese passengers to Antarctica. The global economic recovery already underway, and the development of a new and potentially large market coming from China, suggest that continued growth in Antarctic tourism is highly likely.
Passenger landing trends
While the number of passenger landings has currently levelled off at approximately 170 000 landings per season (Fig. 2), most of these landings occur at relatively few locations. In the 2013/14 season, just 15 of the Antarctic Peninsula sites made up 68% of all passenger landings. There are probably several reasons for this continuing concentration of Antarctic tourism activity. The distribution of trip lengths has shifted over time to include shorter itineraries. As a result, operators may be more conservative with respect to landings at sites that may be challenging and pose a higher risk of a missed opportunity if conditions are not amenable for landing. Also, the shift towards larger vessels may discourage expedition staff from attempting landings at locations that are less reliable or require more time for zodiac operations (e.g. areas with exposed beaches and heavy swell or sites with offshore reefs requiring long zodiac trips to shore), since it would exceed their scheduled time to shuttle a larger number of passengers to shore and back.
In the 1990s, there was relatively little vessel activity south of Petermann Island or in the waters of the eastern Antarctic Peninsula (Weddell Sea). As time has passed, there has been a significant increase in traffic along the Antarctic Peninsula’s south-west coast; unsurprisingly, perhaps, these southward routes occur in seasons where there is little sea ice in the region. This illustrates how, despite pre-season scheduling by IAATO members, Antarctic itineraries remain very flexible and rather significant geographical shifts in vessel activity can occur when conditions, particularly sea ice, warrant. While there has been little increased activity in the Weddell Sea, where in the last five to ten years the ice has been too heavy or unpredictable, the data suggest that increased activity in this region is certainly likely if sea ice conditions permit.
There are both advantages and disadvantages to having high numbers of landings concentrated among relatively few sites (Lynch et al. Reference Lynch, Crosbie, Fagan and Naveen2010). Concentrating passenger landings limits the number of locations that require site guidelines and focused monitoring, and contributes to greater site-specific experience among expedition staff. On the other hand, intense periods of human activity at these sites may increase the potential for human–wildlife conflict or result in an unacceptably high level of cumulative disturbance to breeding colonies, although evidence for a negative impact of tourism on breeding penguins (the most studied group in this regard) is highly variable across studies and complicated by habituation of penguins at frequently visited sites (Coetzee & Chown Reference Coetzee and Chown2015). Similar to the challenges facing management of wilderness sites in other regions of the world, these issues raise questions regarding what are the limits of acceptable change at these sites. For example, is habituation, or other indicators of ‘hardening’ at a certain number of sites acceptable for the long-term management of the bioregion as a whole?
As with a concentration in landings ashore, concentration of marine vessel traffic can have both positive and negative consequences. On the one hand, frequently traversed routes are less likely to present unexpected hazards (e.g. shallow reefs) and will be well-known to ship crews, reducing the risk of groundings or collisions. On the other hand, these routes may be disproportionately vulnerable to disturbance given the concentration of vessel activities. Ship exhaust, pollution from antifouling coatings, and the low but serious risk of a major oil spill, all present concerns in areas experiencing relatively high concentrations of marine vessel traffic (Aronson et al. Reference Aronson, Thatje, McClintock and Hughes2011, Chown et al. Reference Chown, Huiskes, Gremmen, Lee, Terauds, Crosbie, Frenot, Hughes, Imura, Kiefer, Lebouvier, Raymond, Tsujimoto, Ware, van de Vijer and Bergstrom2012). Concern has been expressed by some that cold-adapted species from the Arctic, where many passenger vessels travel in the boreal summer, may be able to establish themselves in the Antarctic (Aronson et al. Reference Aronson, Thatje, McClintock and Hughes2011), though it is important to note that one of the main mechanisms by which potentially invasive marine species are transported is through ballast water, which passenger ships do not discharge in normal operation. Channels that represent bottlenecks for ships moving through the region (e.g. Lemaire Channel), or areas popular for scenic cruising or whale watching, often experience concentrated vessel activities even in the absence of nearby landing sites; by focusing on ship movements specifically, those areas that may be most vulnerable to impacts specific to the presence and movement of vessels at sea can be identified.
The increase in passenger landings from the mid-1990s to late 2000s probably reflects the confluence of several factors. In the early 1990s, the availability of affordable ice strengthened vessels from Russia, such as the Kapitan Khlebnikov, led to the increased duration of the tourist season into periods of the year considered too risky for most of the Antarctic tourism fleet. Additionally, developments in technology, particularly in communications, have allowed for affordable access to real-time information that can assist decision making under unpredictable conditions. As a result, fewer landings are ‘missed’ due to weather and ice conditions. Finally, it is worth noting that in the period of time from the mid-1990s to late 2000s the increase in the number of Antarctic tour operators working in the area resulted in a perceptible shift in attitude regarding sharing of information within the Antarctic tour operator community. Initially, operators in the field were reluctant about sharing information on ‘their’ landing sites; however, operators have grown to realize that sharing information on landing sites improves both safety and environmentally sensitive operations, which benefits both passengers and expedition staff.
Concentration in ‘first landings’ may concentrate the risk of invasive spread
Within the Antarctic Peninsula region, the South Shetland Islands are the closest to southern South America, a source of potential invasive colonizers (Hughes & Convey Reference Hughes and Convey2010). The concentration of ‘first landings’ at only a few South Shetland Island locations makes them disproportionately vulnerable to seeds and other non-native organisms arriving from South America or sub-Antarctic locations, such as South Georgia and the Falkland Islands. Not only are the South Shetland Islands generally more vulnerable to invasion due to their milder climate (Hughes & Convey Reference Hughes and Convey2010, Hughes & Convey Reference Hughes and Convey2012), but one of the sites (Whalers Bay, Deception Island) identified as receiving a disproportionate number of first landings is thermally heated by volcanic activity and two other sites (Barrientos Island, Aitcho Islands, and Penguin Island) have extensive areas of moss associated with an organic soil layer that may facilitate the colonization of non-native seeds carried from outside the Antarctic region (Pfeiffer & Peter Reference Pfeiffer and Peter2004, Hughes & Convey Reference Hughes and Convey2010, Tejedo et al. Reference Tejedo, Pertierra, Benayas, Convey, Justel and Quesada2012). As might be expected given its popularity as a ‘first landing’ site and long history of various human activities, Deception Island is currently the most invaded island in the Antarctic Peninsula region. Invasives include Hypogastrura viatica (Tullberg), Folsomia candida Willem, Protaphorura fimata (Gisin), Deuteraphorura cebennaria (Gisin), Mesaphorura macrochaeta Rusek, Proisotoma minuta (Tullberg), Coccotydaeolus cf. krantzii Baker, Speleorchestes sp. and Terpnacarus gibbosus (Womersley) (Hughes et al. Reference Hughes, Pertierra, Molina-Montenegro and Convey2015). These sites receiving a disproportionate fraction of ‘first landings’, especially those that may be additionally vulnerable due to thermal heating or existing organic soil, should be considered a priority for surveys to detect and eradicate invasive species.
Predictions of future trends
Looking forward, a number of new factors will have a direct effect on the level of visitation at Antarctic landing sites. The November 2014 adoption of the International Code for Ships Operating in Polar Regions (the ‘Polar Code’) by the International Maritime Organization (IMO 2014), which will come into force on 1 January 2017, may alter patterns of vessel traffic relative to the period considered in this re-analysis. Specifically, there may be reduced traffic at the margins of the Antarctic season (early spring and late autumn) when sea ice conditions and low temperatures may preclude the use of some vessels that have not met minimum standards for polar operations. Additionally, and irrespective of the Polar Code, the availability of smaller vessels, carrying<100 passengers is decreasing and there is a notable shift towards vessels carrying≥150 passengers. This is largely due to the smaller vessels being no longer commercially viable. Current restrictions within both IAATO’s own guidelines and ATCM site guidelines mean that there are fewer landing sites available to vessels carrying>200 passengers. If the market shifts to larger vessels, these sites will probably see greater visitation while the sites limited to vessels carrying<200 passengers, or those which require more time to execute a difficult landing, may see a commensurate decrease; such shifts will further increase the amount of concentrated landings in the Antarctic.
Acknowledgements
NB and HJL would like to thank the US National Science Foundation and IAATO for access to the vessel landings data, and Will Engellenner for help with data entry and analysis. The authors would also like to thank IAATO members for their support and their efforts to collect the information required to make this analysis possible. The authors are grateful to the reviewers for their comments on the manuscript.
Author contribution
NB and HL performed the data analysis and all three authors (NB, HL, and KC) contributed significantly to writing the manuscript.