Introduction
Although the number of Indian states reaching replacement fertility level has increased in the last decade, substantial fertility differentials both between and within states still exist. These differences are due largely to the huge diversity observed in social, economic, cultural, political and kinship structures across the country (Dyson & Moore, Reference Dyson and Moore1983; Das Gupta, Reference Das Gupta1995; Basu & Amin, Reference Basu and Amin2000; Dharmalingam & Morgan, Reference Dharmalingam and Morgan2004; Bose, Reference Bose2007; Alagarajan & Kulkarni, Reference Alagarajan and Kulkarni2008; Dharmalingam et al., Reference Dharmalingam, Rajan and Morgan2014). While state- and regional-level differences in childbearing have received particular focus in past research, fertility differentials within state boundaries have received less attention (Arokiasamy & Goli, Reference Arokiasamy and Goli2012). In light of this, this paper examines social patterns of fertility behaviour within Indian state boundaries, including differences in childbearing preferences and patterns among key social groups, how those differences vary across states, and the extent to which those differences have changed over time in various states. In particular, the study asked two research questions. First, what is the nature of the educational, wealth, religious and caste differentials in fertility patterns within the major Indian states? Second, how have the differentials between social groups changed between 1992–93 and 2005–06?
The approach employed in this paper distinguishes between political boundaries, based on administrative divisions such as state or district, and social boundaries based on distinctions between key social groups or identities (e.g. caste, religion, socioeconomic status). Although social boundaries may overlap, social cleavages based on wealth, education, religion and caste transcend the administrative boundaries that dissect India. For example, it has been shown that religious identity has a significant influence on contraceptive and fertility behaviour throughout India, net of the influence of local context (Das & Pandey, Reference Das and Pandey1985; Caldwell & Caldwell, Reference Caldwell and Caldwell1988; Alagarajan & Kulkarni, Reference Alagarajan and Kulkarni1998; Mishra, Reference Mishra2002; Dharmalingam & Morgan, Reference Dharmalingam and Morgan2004; Dharmalingam et al., Reference Dharmalingam, Navaneetham and Morgan2005). At the same time, there is a large body of literature that attests to the influence of local context on fertility, controlling for socioeconomic factors (Dommaraju & Agadjanian, Reference Dommaraju and Agadjanian2009; Guilmoto, Reference Guilmoto2015). Thus, although spatial or geographic context is critically important for fertility behaviour, this paper focuses on the significance of social position and social group membership in matters of childbearing net of the influence of the administrative or geographical unit in which people live.
Methods
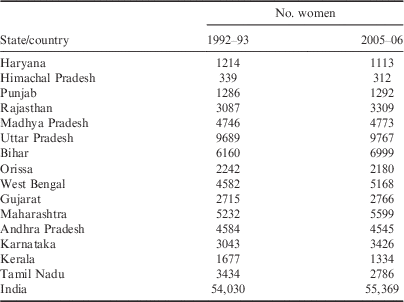
The study was based on the analysis of data from two rounds of India’s National Family Health Survey (NFHS): the initial round of 1992–93 (NFHS-I) and the most recent round of 2005–06 (NFHS-III). The combination of the two rounds provided a sufficient interval to study the broad changes in fertility differentials in Indian states over time. The surveys collected data from nationally representative samples: 89,777 ever-married women aged 13–49 in 1992–93 and 125,385 women aged 15–49 in 2005–06. This study analysed data from a sub-sample of currently married women aged under 35 years (54,030 in the 1992–93 NFHS and 55,369 in the 2005–06 NFHS). Unmarried women and those aged over 34 years were excluded as unmarried childbearing is very rare in India and most childbearing happens by age 35.
The NFHS respondents were selected using a multistage stratified random sampling design. National sample weights and state sample weights were used to make the sample representative of each state and the country as a whole. The analyses reported in this paper were based on data from the fifteen largest states in India and excluded the smaller states and union territories. To enable uniform comparison over time, data from the 2005–06 rounds for the newly formed states were merged to mirror the 1992–93 state boundaries (i.e. Uttaranchal, Jharkhand and Chattisgarh were merged with Uttar Pradesh, Bihar and Madhya Pradesh respectively).
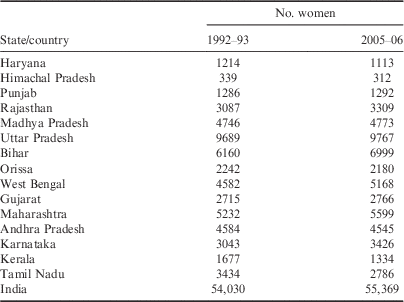
Two indicators of fertility behaviour were included: total parity (i.e. total number of children born to each woman at the time of each survey) and desired family size. Desired family size records the hypothetical, ideal number of children as indicated by each respondent. Respondents in the NFHS-1 and NFHS-3 were asked: ‘If you could go back to the time you did not have any children and could choose exactly the number of children to have in your whole life, how many would that be?’ Although hypothetical in nature, this question is an accurate representation of targeted family size at a given place and time (Dharmalingam et al., Reference Dharmalingam, Rajan and Morgan2014). These outcomes were examined for all currently married women aged 34 years or younger because of the extremely low rate of unmarried childbearing in India and the likelihood that most women would have achieved their desired family size by age 35. The sample sizes used for analysis for each state are given in Table 1.
Number of currently married women aged 15–34 by state and survey year, India NFHS
To facilitate the calculation of fertility differentials, total parity and desired family size were dichotomized to create four dichotomous response variables. These variables differentiated women who had completed one birth from those who had two or more births (2 or more=1; 1=0) and distinguished women who had two births from those who had three or more births (3 or more=1; 2=0). They also differentiated women who desired three or more children from those who wanted two (3 or more=1; 2=0) and those who wanted two or more children from those wanted only one (1=0; 2 or more=1).
Fertility differentials between wealth, educational, religious and caste groups were then examined within each of the major Indian states as well as for the country as a whole. Specifically, multivariate logistic regression was used to estimate the predicted probabilities of each outcome variable adjusting for relevant covariates for each social group.
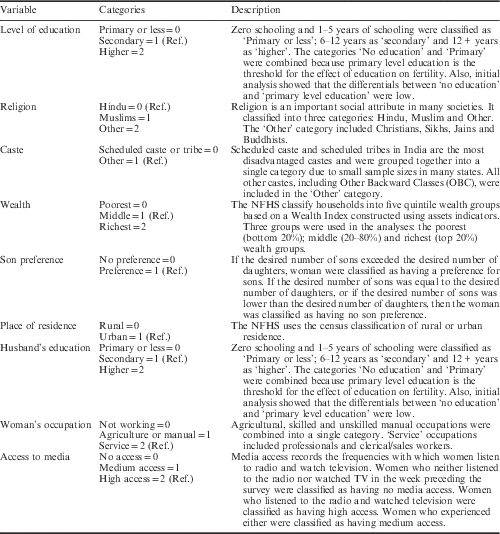
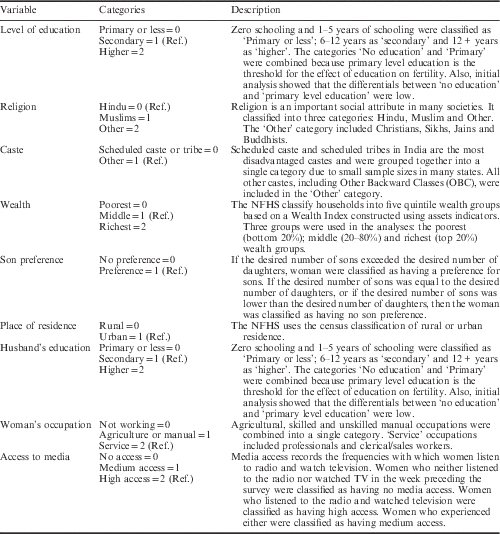
Analyses were carried out using the pooled data from NFHS-1 and NFHS-3 for India as a whole. The logistic regression models included state and survey year as covariates to account for unmeasured state-specific factors and also changes over time. In addition, a separate model was then fitted for each state using the pooled data, which included survey year as a covariate (in addition to other control variables). A description of the explanatory variables and their categories is given in Table 2.
Description of explanatory variables and their categories, currently married women aged 15–34, India NFHS
Results
State-level fertility patterns
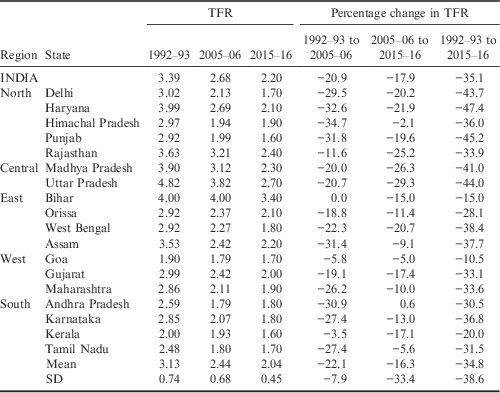
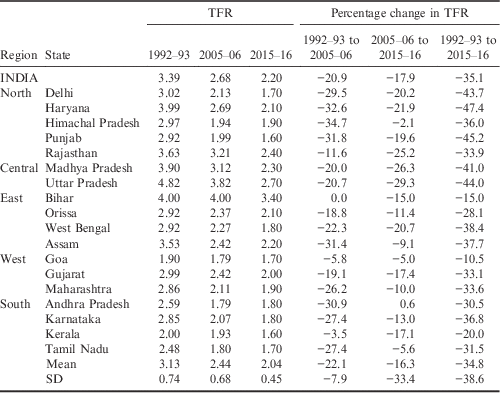
Table 3 presents Total Fertility Rates (TFR) for the Indian states and two union territories (Delhi and Goa) for the periods 1992–93 and 2005–06. The estimates of TFR from the most recent NFHS survey (2015–16), which are available for all Indian states and the union territories of Delhi and Goa, are also included in Table 3. It is clear that there has been a steady decline in fertility in the last two decades. From the early 1990s to the mid-2000s, only Bihar experienced no decline in fertility; however, over the next decade (i.e. between 2005–06 and 2015–16), the TFR in Bihar declined by 15%.
Total fertility rate (TFR) of women aged 15–49 years by survey year and state, India NFHS
Data for 2015–16 were extracted from International Institute for Population Sciences NFHS-4 (2015–16). Fact Sheet, Mumbai, India.
The unweighted average TFR for the states and union territories included in Table 3 for 1992–93 was 3.13 (SD 0.74); by 2005–06 it was 2.44 (SD 0.68). On the face of it, these data show that both average fertility and interstate variation in total fertility had declined over this period, perhaps unsurprising given that states with low fertility in 1992–93 would not be expected to have experienced as rapid declines as those states with relatively high fertility levels. Nonetheless, closer inspection reveals that spatial heterogeneity in fertility pattern in India was still significant in 2005–06. Relative to the mean, the standard deviation of fertility rates across the largest states and union territories increased (the coefficient of variation in 1992–93 was 0.22 and 0.28 in 2005–06), indicating that variation in TFRs among the Indian states had increased slightly.
In 1992–93, TFR had only fallen below replacement level in Goa and Kerala. By 2005–06, seven more states (including Delhi) had sub-replacement fertility rates. By 2015–16, TFR had reached replacement level or moved further below in most states. In 1992–93, seven out of the eighteen states included in Table 3 had a TFR of above 3; by 2015–16, the TFR exceeded 3 in only Bihar.
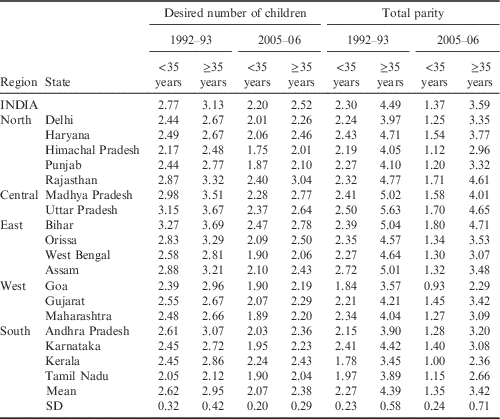
Similar to the TFR, desired family size was also found to vary significantly between states, even though the average declined between 1992–93 and 2005–06 (see Table 4). Although the observed TFR was below replacement level in many states, on average, women in most states desired more than two children. Table 4 presents the average desired family size and total parity for each state for two age groups: women aged 34 and younger and women aged 35 and above. In 1992–93, women under 35 years had an average total parity of less than two children only in three states and territories (i.e. Kerala, Tamil Nadu and Goa); however, by 2005–06 women in all states had an average total parity of less than 2.
Average desired number of children and total parity (average children ever born) by survey year, age of women and state, India NFHS
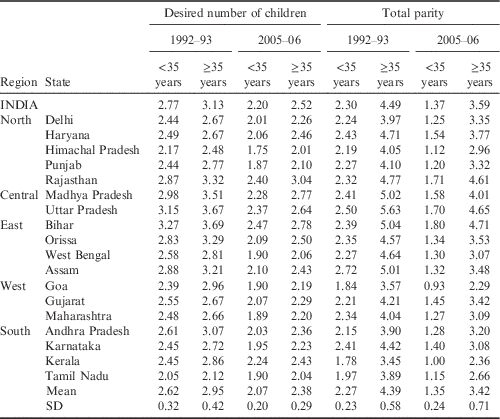
Two key further features of Table 4 stand out. First, women under 35 years in Kerala, Tamil Nadu, Goa and Himachal Pradesh had approximately one child on average in 2005–06. In the same states, the average woman had had well over two children in 1992–93. This is likely to be due to the combined effects of delayed partnering and parenthood and changes in desired family size. Second, on average, women under 35 desired more than two children in all states in 1992–93; but by 2005–06 women of that age desired fewer than two children on average in six states and territories (i.e. Karnataka, Tamil Nadu, Goa, Maharashtra, West Bengal, Punjab and Himachal Pradesh).
In sum, most states in India were close to, or below, replacement fertility level in 2015–16. The average desired family size also hovered around replacement level in almost all states, and there were signs that a significant proportion of Indian women may have wanted fewer than two children. In terms of variation among states, however, there seems to have been little change over the two decades: interstate differences in fertility pattern were as substantial in the mid-2000s as they were at the beginning of the 1990s. Against this background, the next section examines fertility differentials between the major social groups and the extent to which those differentials varied between states and over time.
Social patterning of fertility
This section describes the differences in fertility preferences and experiences among women aged 15–34 years in 2005–06 and 1992–93. In particular, it focuses on social group differences in ideal family size and parity (having 2 or 3 children and 1 or 2 children). As most childbearing is completed by age 35, the focus on the younger age group enables a more accurate assessment of changes in behaviour between 1992–93 and 2005–06 than would have been possible if the entire age range (15–49) had been considered.
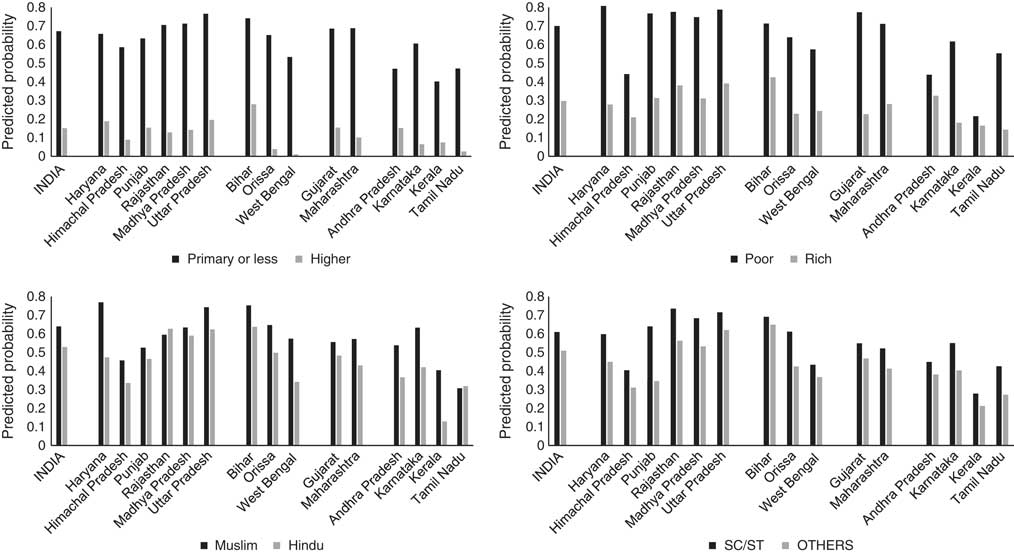
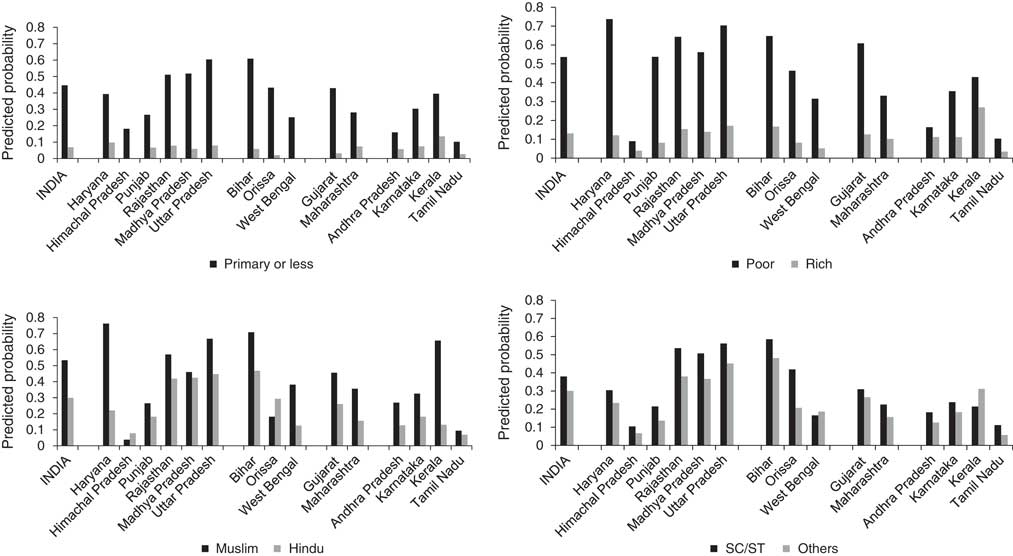
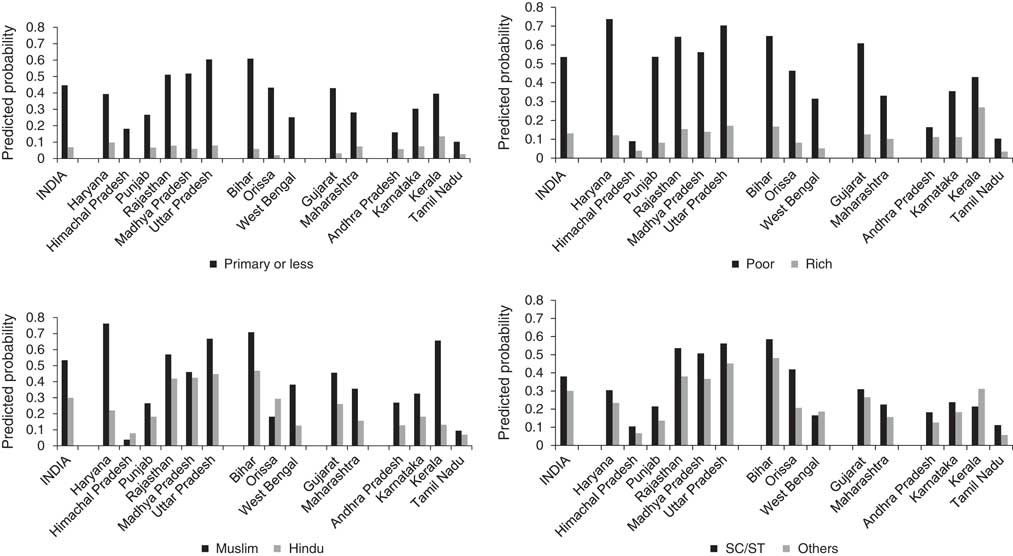
Figure 1 shows the predicted probabilities of reaching a parity of 3 or more in 2005–06 given that women were already at parity 2 for eight social groups (based on educational, wealth, religious and caste comparisons). The probabilities were derived from the results of logistic regression models fitted to each state and India as a whole separately, adjusting for a number of controls (see legend to Fig. 1). It is clear that there are substantially greater differences in the predicted probabilities between educational and wealth groups compared with between religious and caste groups. While the probability of having a third child was 70% among the least-educated group (primary or no education), it was only about 15% among those with more than a secondary school qualification. The next highest difference in predicated probability (40 percentage points) was between those at the top and bottom of the wealth distribution. In comparison, the differences between Muslims and Hindus (10 percentage points) and between members of the scheduled castes and tribes and those from other castes and classes (10 percentage points) were very small. However, there were exceptions to those patterns. For example, in Kerala, differences in parity between the rich and poor were negligible (0.06). All other states had substantial differences in predicted parity between wealth groups of at least 20 percentage points, the highest being over 50 percentage points in Haryana and Gujarat.
Predicted probabilities of having three or more children for women aged 15–34 controlling for place of residence, husband’s education, women’s occupation, son preference and access to media, India NFHS 2005–06.
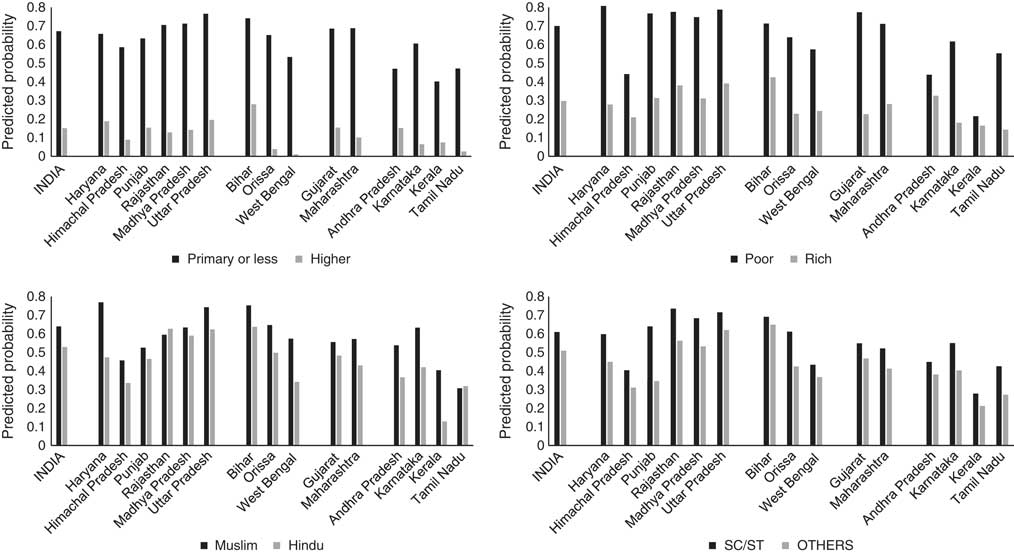
Although nationwide differences in the predicted probabilities of having three or more children between Muslims and Hindus were small (0.10), the observed religious differences were substantial in Haryana (0.30), Kerala (0.27), West Bengal (0.23) and Karnataka (0.21). It is interesting that religion had no discernible impact on parity in a number of states. In fact, in Tamil Nadu and Rajasthan, the predicted probability of having three or more children for Muslims was marginally less than that for Hindus. Despite observing higher parity among Muslims in many states, an average Muslim woman in Tamil Nadu had a similar likelihood of having a third child to an average Hindu woman in Himachal Pradesh or West Bengal.
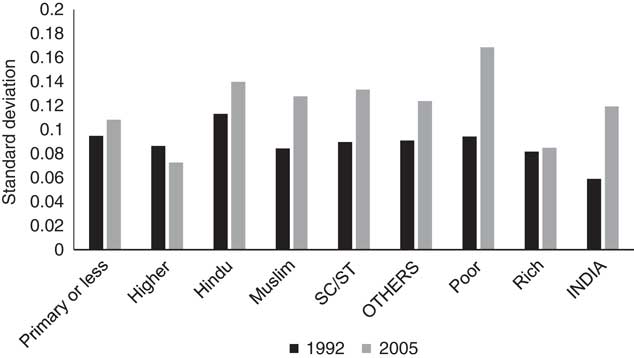
Perhaps more importantly, the results of the analyses revealed significant variation in the predicted probabilities within social groups living in different states. The total variation between states in the predicted probability of having a third child was greatest among the poor (SD 0.17) and moderately high among Hindus (0.14), Muslims (0.13), members of scheduled castes and tribes (0.13), the remaining caste groups (0.12) and those with the lowest levels of education (0.11). The lowest variation was found among the highly educated (0.07) and wealthiest Indians (0.08). This means that, relative to the national average, someone with a university degree in Tamil Nadu, Orissa or West Bengal was much less likely in 2005–06 to have a third child (less than 0.05 predicted probability) than a woman with similar educational level in, say, Uttar Pradesh (0.29) or Andhra Pradesh (0.15).
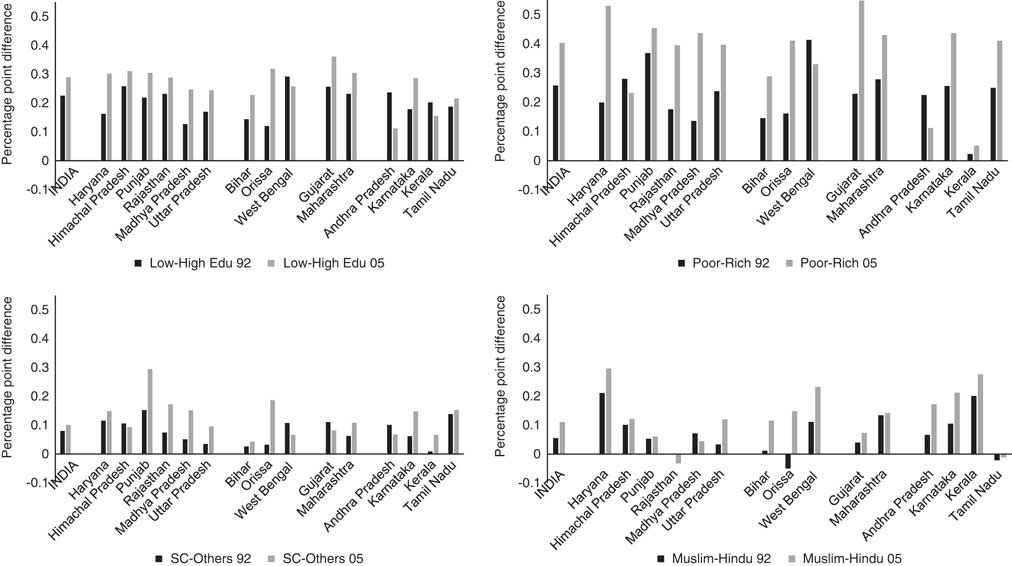
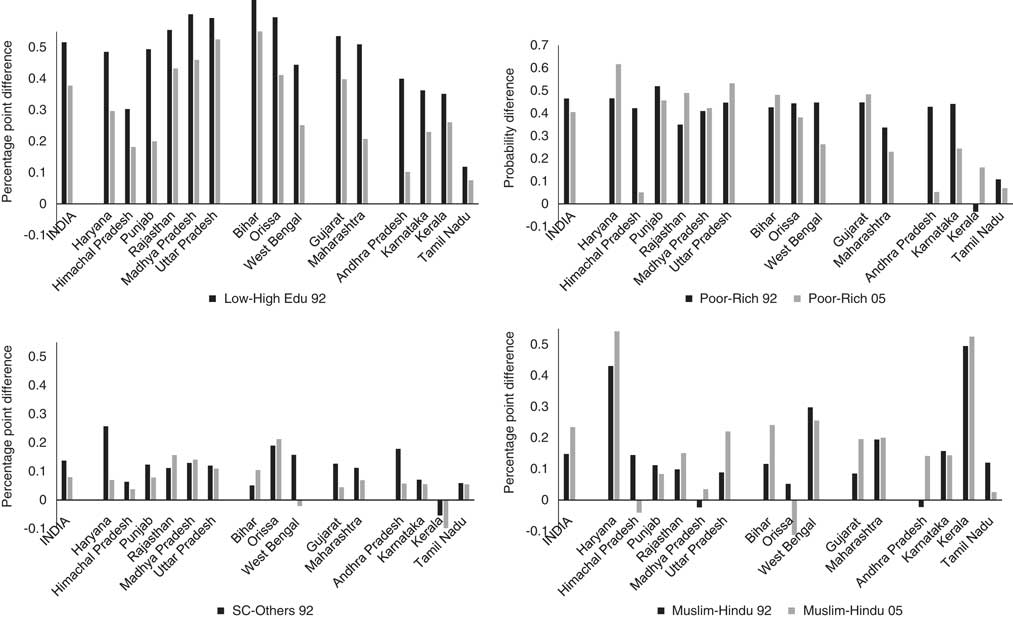
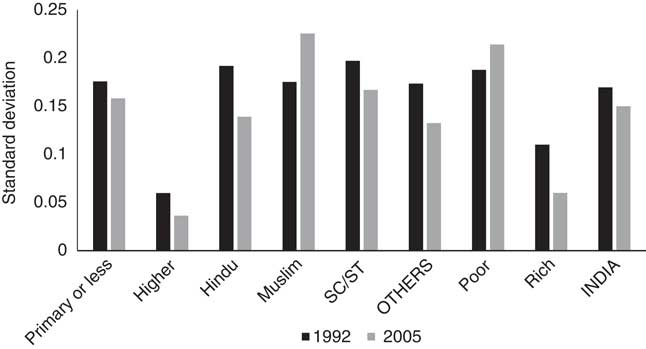
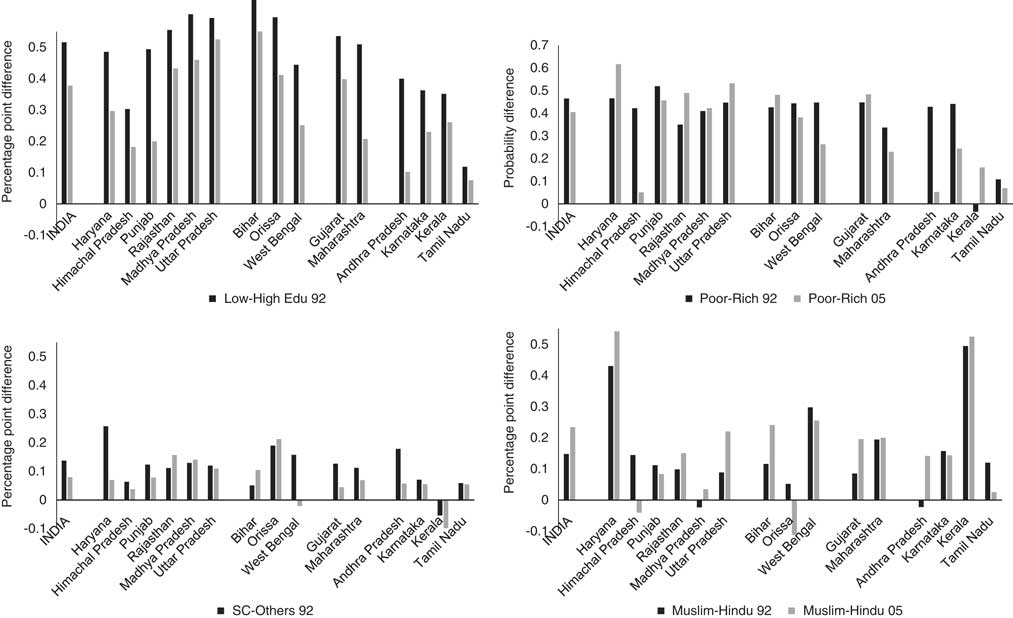
The changes in group differentials between 1992–93 and 2005–06 are shown in Fig. 2, and the variation among states is given in Fig. 3. Overall, variation between states in social group fertility differentials doubled between 1992–93 and 2005–06 (from 0.6 to 0.12). Although the largest total variation in 1992–93 was among Hindus, in 2005–06 the largest variation was found among the poor. It is also evident that the increase in variation was greater among Muslims and scheduled tribes and caste members than among the ‘other’ castes group. In fact, the absolute variation either slightly decreased or remained unchanged among the higher educated and the rich.
Differences in predicted probabilities of having a third child for social groups for women aged 15–34, India NFHS 1992–93 and 2005–06.
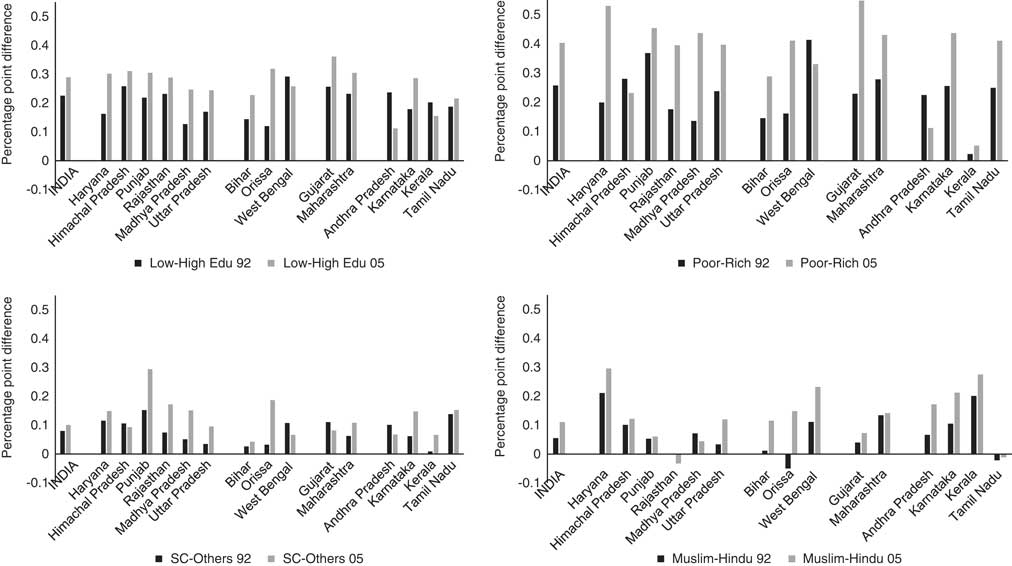
Average variation (SD) among Indian states in predicted probabilities of having a third child for women aged 15–34, India NFHS 1992–93 and 2005–06.
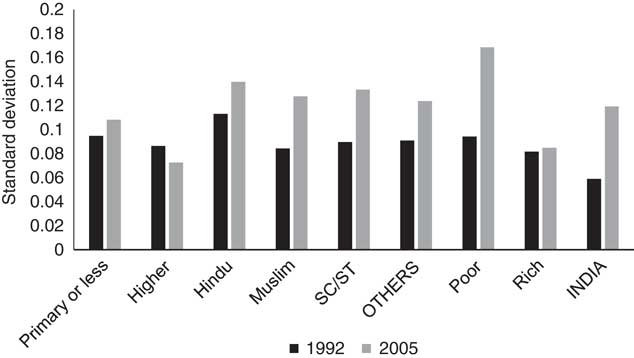
In terms of changes in relative variation, measured as the coefficient of variation, most of the between-state variation in above replacement parity was found among the highly educated group both in 1992–93 and in 2005–06. The increase in relative variation between 1992–93 and 2005–06 was also substantial among the highly educated, the wealthy, Hindus and the ‘other’ castes group. Figure 3 shows the average variation between states in the predicated probabilities of having a third child for members of each social group. For all groups, other than the most affluent and the most educated, the percentage of women having three or more children varied more between the states in 2005–06 than in the early 1990s. Although religious and caste differences in above replacement parity were small overall, for some states the differences were substantial (e.g. Kerala).
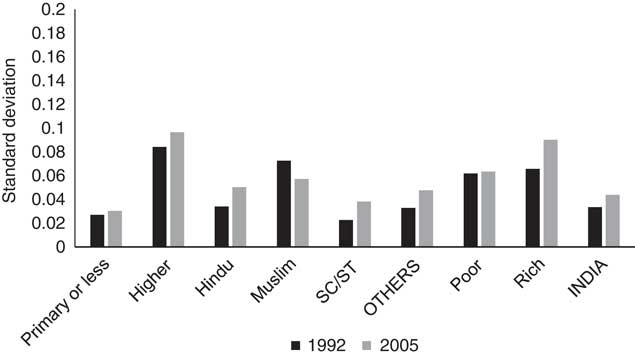
Estimated probabilities of having two or more children, relative to having only one, showed that religious and caste differences were negligible (results not shown). However, differences were noticeable for educational and wealth groups. Those differences also grew between 1992–93 and 2005–06. This was due to an increase in the variation between states among the highly educated; by contrast, between-state variation among those with primary or no education was initially small and failed to increase. As shown in Fig. 4, the variation between states was small at both points in time for India as a whole. However, in 1992–93 the higher educated had a relatively large amount of variation compared with other groups; in 2005–06 the most educated and the wealthiest had relatively high level of variation. This suggests that progression from one to two births was reasonably constant across social groups, but among the highly educated the likelihood differed depending on the state in which a woman lived. Importantly, this was not due merely to childbearing patterns among highly educated women in the southern states; in fact, the predicted probability of having a second child among women with the highest level of educational attainment was similar in Himachal Pradesh and Punjab in the north and Karnataka, Kerala and Tamil Nadu in the south.
Average variation (SD) among Indian states in predicted probabilities of having a second child for women aged 15–34, India NFHS 1992–93 and 2005–06.
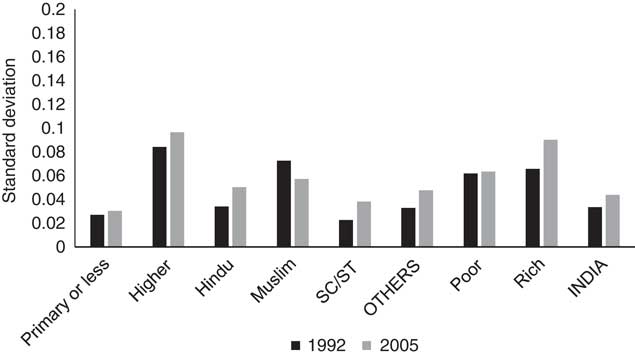
The predicted probabilities of wanting three or more children are presented for women from each social group in each state in Fig. 5. In 2005–06, roughly one in three Indian women wanted a third child. However, the ideal family size varied significantly across Indian states. While less than 10% of women in Tamil Nadu or Himachal Pradesh wanted a third child, more than 40% of women in Rajasthan, Madhya Pradesh, Uttar Pradesh and Bihar preferred three or more children. Similar patterns were observed in 1992–93. As with the analyses of parity (see Fig. 3), above replacement fertility preferences varied substantially among the poor and among Muslims living in different states and territories.
Desire for three or more children among women aged 15–34, India NFHS 2005–06.
In terms of differences in fertility preferences between social groups, the largest differences were observed between those with high and low levels of educational attainment and the poor and the affluent. In most states, differences between Muslims and Hindus in desired family size were modest, although in general more Muslims than Hindus desired larger families (see Fig. 6). The differences between education groups narrowed between 1992–93 and 2005–06 (see Fig. 6) across most states, with the exception of Uttar Pradesh and Bihar where the differences in desired family size between educational groups remained unchanged. In contrast, despite an overall decline in the difference for India as a whole, the gap between the rich and poor in terms of preferences for three or more children increased in a number of states, including Haryana, Rajasthan, Uttar Pradesh, Bihar, Gujarat and Kerala. Notwithstanding the small differences in fertility preferences between Muslims and Hindus, the gap did increase between 1992–93 and 2005–06. The increase in the Muslim–Hindu difference was noticeable in Haryana, Uttar Pradesh, Bihar and Gujarat in the north, and Andhra Pradesh in the south. It is interesting that in Himachal Pradesh and Orissa relatively more Hindus than Muslims wanted larger families in 2005–06 – the reverse pattern from 1992–93. Another notable feature is that two states – Haryana in the north and Kerala in the south – had the largest Muslim–Hindu differences in wanting a third child in both 1992–93 and 2005–06. In the case of Kerala, religious differentials in the desire for three or more children were larger than the differences between educational and wealth groups.
Differences in predicted probabilities of desire for three or more children for social groups for women aged 15–34, India NFHS 1992–93 and 2005–06.
In terms of interstate variation within the social groups, the smallest variation was observed among the highly educated and the rich (see Fig. 7). In other words, highly educated and wealthy women had fairly similar fertility preferences across all states. For all other social groups, however, fertility preferences varied significantly from state to state in both 1992–93 and 2005–06. In most cases, interstate variation in the expected percentage of women wanting three or more children within each group declined between 1992–93 and 2005–06. Nonetheless, among Muslims and the poor, the extent to which fertility preferences varied between states increased. This means that the propensity of an average Muslim or poor women in Karnataka to want three or more children was likely to be different from that of an average Muslim or poor woman in Uttar Pradesh. It is reasonable to infer from these patterns that the desire for three or children did not narrow among social groups between 1992–93 and 2005–06.
Average variation (SD) among Indian states in the desire for three or more children for women aged 15–34, India NFHS 1992–93 and 2005–06.
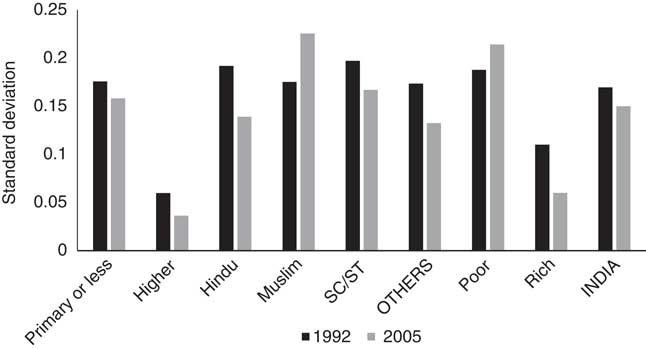
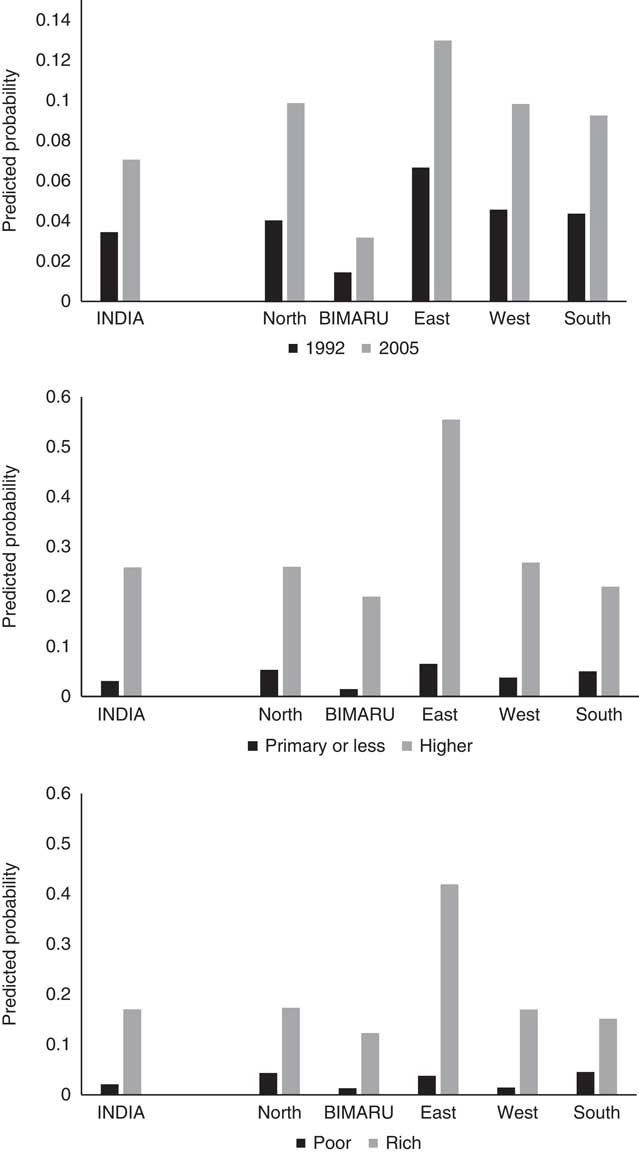
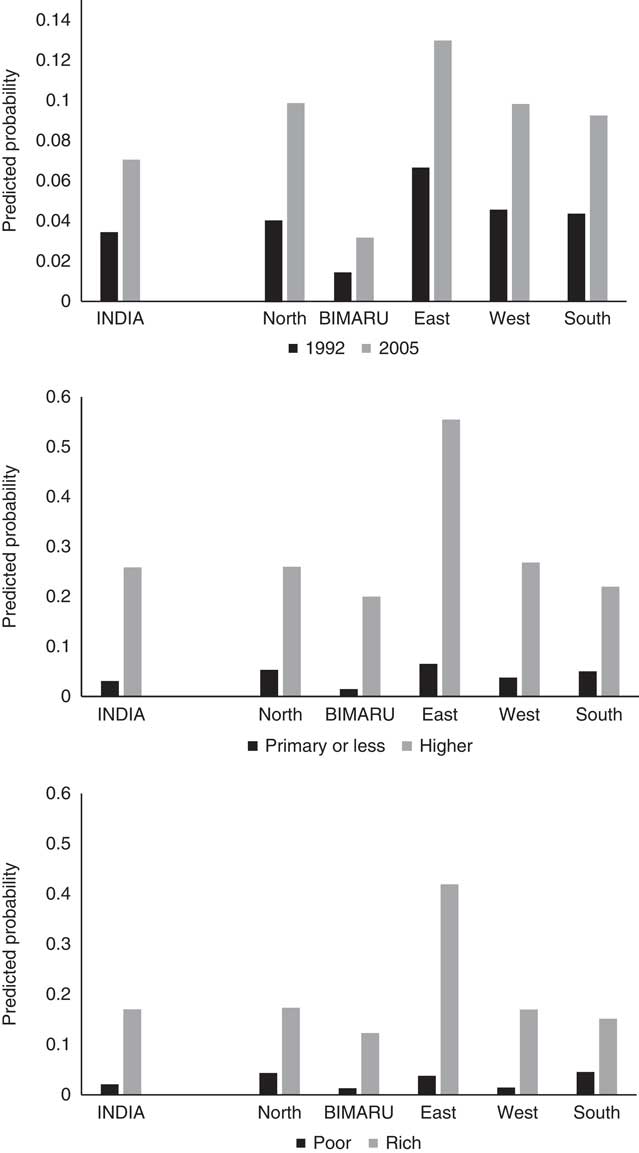
Figure 8 shows that wanting to have just one child had become more prominent across India during the study period. Although it was still low in 2005–06, the proportion of women that preferred to have only one child doubled to 7% between 1992–93 and 2005–06. Nonetheless, these patterns also varied significantly between regions and social groups. Among young women in all but one region, about one in ten were likely to want just one child. But in BIMARU states (Bihar, Madhya Pradesh, Rajasthan and Uttar Pradesh) the corresponding likelihood was less than 4% in 2005–06. More so than region, however, the preference for one child was observed to be a function of educational attainment and material well-being. It is clear from Fig. 8 that almost all women who wanted just one child were from the highly educated and well-off groups. Hindus and members of ‘other’ castes were in general more likely to desire just one child than their Muslim and scheduled caste and tribe counterparts; nonetheless the magnitude of the difference was very small.
Desire for only one child among women aged 15–34, India NFHS 2005–06.
Discussion
With the exception of four large north Indian states (Bihar, Madhya Pradesh, Rajasthan and Uttar Pradesh), the rest of India had around or below replacement fertility in 2005–06. There had been a corresponding decline since 1992–93 in desired family size across all states. As a result, all but six states in 2005–06 had an average desired family size of two children or fewer among women aged under 35 years. While variation among states in the preferred number of children had narrowed since 1992–93, variation in terms of total fertility or total parity (among women aged 15–34) had remained stable. In other words, convergence across Indian states in fertility had not occurred by 2005–06; nonetheless, it is very likely to have been reached by 2015–16 as further declines in fertility in states that have already reached replacement levels become smaller than the fertility declines in the states with high fertility levels.
The focus of this study was on whether social group differentials in childbearing patterns and fertility preferences were significant, whether these differences varied across states and territories and whether the differentials increased or decreased between 1992–93 and 2005–06. The largest differences in fertility behaviour and desired fertility were found between the affluent and highly educated, on the one hand, and the poor and less educated on the other. The differences between Muslims and Hindus were modest, as were those between members of the scheduled castes and tribes and the ‘other’ castes group. Two states with significant religious differences are Kerala and Haryana.
The results also showed that interstate variation in childbearing patterns within social groups was at least as high as, if not higher than, variation between states (net of other influences). The variations among Hindus, the poor and Muslims were more noticeable for all the fertility indicators analysed here than for other groups. Moreover, these variations did not decline between 1992–93 and 2005–06 and may have even increased slightly for some groups. Another interesting finding is that there was no consistent north–south divide in either fertility behaviour or desired family size. In other words, it is not just in southern Indian states that small or large differences between Muslims and Hindus are found, or between less and more educated women; similar features are found in some northern Indian states as well. These results together may point to the gradual disappearance of the influences that once were unique to southern or northern India, and at the same time the emergence of social, political, economic and cultural forces that are pan-Indian in their reach. Recent anecdotal reports suggest that religious minorities, marginalized caste groups and the poor are increasingly being exposed to socio-political forces with similar intensities to those experienced by other groups two decades ago. It thus appears reasonable to conclude that social and political space is at least as important as geographical space for demographic behaviour.
There is a vast body of rigorous research on Indian fertility trends and patterns. Research on trends seems to establish firmly that the onset of fertility decline in India first occurred in some pockets of Tamil Nadu and Kerala and in the periphery along the coasts (Guilmoto & Rajan, Reference Guilmoto and Rajan2001). Fertility decline was evident in most regions of India in the 1970s and in every region in the 1980s (Jain& Adlakha, Reference Jain and Adlakha1982; Bhat, Reference Bhat1996; Bhat & Zavier, Reference Bhat and Zavier1999; Guilmoto & Rajan, Reference Guilmoto and Rajan2001). A unique feature of Indian fertility patterns is the persistent regional differentials. New research on historical trends in Indian fertility shows that the differentials observed between states are largely due to differences in the timing of initial decline, rather than due to variations in its pace (Guilmoto, Reference Guilmoto2015).
Two broad explanations have been advanced to account for the observed regional variations in fertility patterns. Beginning with Dyson and Moore (Reference Dyson and Moore1983), the relative autonomy of women has been a favoured explanation for the north–south demographic divide. The relative autonomy enjoyed by women in the south is thought to have emerged from, and become embedded in, their cultural ethos and the local political economy. While acknowledging the importance of gender equality for the understanding fertility differentials, others argue that spatial patterns of fertility change require an appreciation of the ‘diffusion’ of ideas, values and behaviours (Das Gupta, Reference Das Gupta1995; Guilmoto & Rajan, Reference Guilmoto and Rajan2001; Dommaraju & Agadjanian, Reference Dommaraju and Agadjanian2009). These authors pointed to the fact that the areas in the south or north that led the fertility decline had none of the development features that are presumed to have initiated the change in fertility behaviour. These areas were neither sufficiently urbanized nor industrialized by 1951, when they began to show signs of fertility decline before other parts of India (Guilmoto & Rajan, Reference Guilmoto and Rajan2001). The subsequent decline in fertility spread from these areas to cover the rest of the country in the next few decades and this process spread independently of the prevailing socioeconomic conditions, supporting the thesis that the diffusion of modern fertility attitudes and behaviour was at work.
The research reported here complements the innovation–diffusion explanation. It shows that a fuller understanding of contemporary fertility behaviour in India requires paying attention to the social and political forces that are no longer bound by the local context, but rather appear to have more universal influence across India. As India is integrated more into a globalizing world and identity politics become more prominent, social boundaries may become more critical than ever for determining reproductive pattern.