Introduction
Maintaining optimal weed control with each herbicide application is a valuable strategy for agronomists not only to maximize cost-effectiveness by reducing the need for sequential applications, but also to manage herbicide resistance. Reduced herbicide efficacy has been directly linked to increased survival of weeds possessing potential resistance-conferring alleles, leading to exponential increases in the presence of weeds possessing these traits (Manalil et al. Reference Manalil, Busi, Renton and Powles2011; Neve and Powles Reference Neve and Powles2005; Norsworthy et al. Reference Norsworthy, Ward, Shaw, Llewellyn, Nichols, Webster, Bradley, Frisvold, Powles, Burgos, Witt and Barrett2012). Many factors contribute to reduced herbicide efficacy, but among the most significant and relevant to current herbicide application patterns are environmental influences and diurnal variation in activity. In general, herbicides tend to be most effective under high-humidity and high-temperature regimes (Anderson et al. Reference Anderson, Swanton, Hall and Mersey1993; Johnson and Young Reference Johnson and Young2002; Ritter and Coble Reference Ritter and Coble1981). However, these conditions are, by no means, uniform across seasons. Reduced herbicide efficacy has been reported with applications made at dawn and/or dusk (Dalazen and Merotto Reference Dalazen and Merotto2016; Johnston et al. Reference Johnston, Eure, Grey, Culpepper and Vencill2018; Prasad et al. Reference Prasad, Foy and Crafts1967; Sellers et al. Reference Sellers, Smeda and Johnson2003; Stewart et al. Reference Stewart, Nurse and Sikkema2009). Unfortunately, dawn and dusk are times when cropping operations apply herbicides in order to cover large amounts of acreage in a timely manner and/or to reduce drift potential and decrease evaporation of spray droplets before herbicide can penetrate leaf tissues (Johnston et al. Reference Johnston, Eure, Grey, Culpepper and Vencill2018). Upon the recent advent of auxinic herbicide–resistant crops, maintaining maximum activity will promote long-term utility of these chemistries for agronomists (Bauerle et al. Reference Bauerle, Griffin, Alford, Curry and Kenty2015; Johnston et al. Reference Johnston, Eure, Grey, Culpepper and Vencill2018). However, more research is highly warranted on the interaction of different environmental and diurnal factors on auxinic herbicide efficacy. This is especially critical for weeds that cause major resistance problems.
Maintaining effective herbicide options for Palmer amaranth (Amaranthus palmeri S. Watson) control is one of the most challenging weed management problems in the southern United States. Control of A. palmeri was for a time achieved solely by using glyphosate after the introduction of glyphosate-resistant crops (Culpepper and York Reference Culpepper and York1998; Ward et al. Reference Ward, Webster and Steckel2013). However, due to the evolution of glyphosate resistance in A. palmeri endowed by a novel gene-amplification mechanism (Gaines et al. Reference Gaines, Zhang, Wang, Bukun, Chisholm, Shaner, Nissen, Patzoldt, Tranel, Culpepper, Grey, Webster, Vencill, Sammons, Jiang, Preston, Leach and Westra2010), control of this species with glyphosate is now nearly unachievable in most of the southern United States, warranting the adoption of other POST herbicide options. Resistance of Amaranthus species to several other herbicide mechanisms of action is also widespread throughout the United States, partly due to the high degree of genetic variability from obligate outcrossing and massive seed production (Assad et al. Reference Assad, Reshi, Snober and Rashid2017; Culpepper et al. Reference Culpepper, Grey, Vencill, Kichler, Webster, Brown, York, Davis and Hanna2006; Foes et al. Reference Foes, Tranel, Wax and Stoller1998; Giacomini et al. Reference Giacomini, Umphres, Nie, Mueller, Steckel, Young, Scott and Tranel2017; Heap Reference Heap, Pimentel and Peshin2014; Horak and Loughin Reference Horak and Loughin2000; Shoup et al. Reference Shoup, Al-Khatib and Peterson2003; Webster and Grey Reference Webster and Grey2015).
Increased genetic variability allows for an increased risk of selection for herbicide-resistant weed biotypes (Tranel and Wright Reference Tranel and Wright2002). It can be theorized that continued use of 2,4-D and dicamba in resistant crops will increase selection for herbicide-resistant alleles. Indeed, 2,4-D–resistant waterhemp [Amaranthus tuberculatus (Moq.) J. D. Sauer] has already been reported (Bernards et al. Reference Bernards, Crespo, Kruger, Gaussoin and Tranel2012; Figueiredo et al. Reference Figueiredo, Leibhart, Reicher, Tranel, Nissen, Westra, Bernards, Kruger, Gaines and Jugulam2017), so this phenomenon is no longer theoretical. Issues with A. tuberculatus resistance were preceded by the discovery of dicamba-resistant kochia [Bassia scoparia (L.) A. J. Scott] and wild mustard (Sinapis arvensis L.) (Cranston et al. Reference Cranston, Kern, Hackett, Miller, Maxwell and Dyer2001; Jasieniuk et al. Reference Jasieniuk, Morrison and Brûlé-Babel1995). Taking advantage of favorable environmental conditions and application timings when using herbicides would ensure maximum efficacy and would at least delay herbicide resistance. This is particularly important, because selection of A. palmeri with reduced susceptibility to auxinic herbicides has already been directly attributed to the use of sublethal rates of dicamba (Tehranchian et al. Reference Tehranchian, Norsworthy, Powles, Bararpour, Bagavathiannan, Barber and Scott2017).
One of the main phytotoxic effects associated with auxinic herbicide application is the formation of reactive oxygen species (ROS) (Song Reference Song2014). Increased activity of enzymes involved in ureide metabolism, fatty-acid oxidation, and jasmonic acid biosynthesis are generally considered a main source of ROS production (Pazmino et al. Reference Pazmino, Rodriguez-Serrano, Romero-Puertas, Archilla-Ruiz, Del Rio and Sandalio2011; reviewed in Song Reference Song2014). One of the most prevalent herbicide-induced ROS species is hydrogen peroxide, production of which is triggered by abscisic acid–induced declines in photosynthesis and activity of nicotinamide adenine dinucleotide phosphate oxidases (Grossmann et al. Reference Grossmann, Kwiatkowski and Tresch2001; Romero-Puertas et al. Reference Romero-Puertas, McCarthy, Gómez, Sandalio, Corpas, Del Rio and Palma2004). At present, there is a notable lack of research investigating the degree of ROS production in response to commercially applied auxinic herbicides. Investigation into the formation of hydrogen peroxide may yield important insights into the variability of 2,4-D and dicamba response across different environmental and diurnal regimes. The objectives of this research were to evaluate the degree of phytotoxicity and hydrogen peroxide formation from 2,4-D and dicamba treatments under different temperature, temperature differential, and humidity environments, as well as at different application timings.
Materials and Methods
Plant Material and Treatments
Seeds of a glyphosate-resistant A. palmeri population collected from Macon County, GA, were sown into 236-ml polystyrene cups containing commercial potting mix (Sun Gro® Professional Growing Mix, Sun Gro Horticulture, Agawam, MA) and thinned to 1 plant per cup following establishment. Plants were germinated and grown in a growth chamber set to day/night temperatures and humidity corresponding to environmental factors (see description of separate growth chamber conditions below) with light from 8:00 AM to 12:00 AM at 600 µmol m−2 s−1 throughout the experiment. Plants were fertilized once with a 20-20-20 fertilizer at a rate equivalent to 33.6 kg N ha−1, and herbicide treatments were applied at the 3- to 5-leaf (∼8 cm) stage.
Treatments were arranged in a randomized complete block design with four replications, with location in the growth chamber serving as the blocking factor. Herbicide treatments included dicamba or 2,4-D at 0.28 kg ai ha−1 or 0.56 kg ai ha−1, with each herbicide/rate combination applied at either 8:00 AM, 8 h after initiation of darkness, or 4:00 PM, 8 h after initiation of light. All herbicide treatments contained a nonionic surfactant at 0.25% v/v. A nontreated control was included. Herbicide treatments were applied with a pipette to simulate a spray coverage of 280 L ha−1. Spray coverage was calculated using the average leaf area of 4 plants (∼52 cm2). A total of seven 20-µl droplets were uniformly placed per plant to either side of the midrib on the adaxial side of each treated leaf. Herbicide treatments were applied inside the growth chamber to prevent any outside conditions (wind, differing temperature and humidity) from affecting herbicide penetration and absorption and to restrict observed effects to those originating from environmental factors, limiting any confounding outside effects on target plant physiology and metabolic processes. The application strategy was similar to that used by Parker et al. (Reference Parker, Wehtje, McElroy, Flessner and Panizzi2015) for absorption experiments. Herbicide treatments were made under separate growth chamber conditions to determine the effect of differing temperature, day/night temperature differential, and humidity on phytotoxicity and hydrogen peroxide formation. For high (41/30 C) and low (31/20 C) day/night temperature treatments, herbicides were applied at ambient humidity conditions (Supplementary Figures S1 and S2). For temperature differential treatments, herbicide applications were made under either 41/30 C (low, simulating summer) or 37/20 C (high, simulating spring) temperature differentials, at ambient humidity conditions for both temperature differential treatments. For determining the temperature differential effect, the previously collected high-temperature data were compared with data collected under the high temperature differential treatment. For humidity treatments, herbicide applications were made under humidity ranging from ∼66% to 89% (high) or ∼35% to 44% relative humidity (low), with a day/night temperature of 36/25 C. For the high-humidity treatment, a humidifier (Vicks® Warm Mist, Procter & Gamble, Cincinnati, OH) was placed in the growth chamber and filled with tap water twice a day. For the low-humidity treatment, a dehumidifier (DH-35K1SJE5, Hisense, Qingdao, China) was placed in the growth chamber with a drain hose connected to allow for constant moisture removal. Herbicide applications under each environmental factor were repeated twice in time.
Phytotoxicity and Hydrogen Peroxide Determination
Visible phytotoxicity was determined at 3, 7, 10, and 14 d after treatment (DAT) using a scale of 0% to 100%, with 0% indicating no tissue damage and 100% indicating complete desiccation and plant death. At 14 DAT, plants were moved to the laboratory and harvested for determination of hydrogen peroxide concentration.
Hydrogen peroxide concentration in planta was determined using a colorimetric procedure adapted from Zhou et al. (Reference Zhou, Wang, Guo, Tan and Zhu2006). A total of 0.5 g of fresh leaf material from the most acropetal leaves was harvested and frozen in liquid nitrogen. Leaf material was ground into fresh powder with a precooled mortar and pestle to prevent thawing and then added to a 15-ml centrifuge tube along with 0.15 g of activated charcoal and 5 ml of a 5% trichloroacetic acid solution. Centrifuge tubes were then vortexed for 10 s before being centrifuged at 10,000 × g for 20 min at 4 C. Supernatant was then removed from centrifuge tubes and adjusted to pH 9 (determined to allow for maximum colorimetric resolution) using 30% ammonia solution. Adjusted supernatant was filtered using filter paper (Whatman No. 1, Whatman, Maidstone, UK) to remove any remaining solids. Filtrate was separated into two aliquots of 0.75 ml, and each was placed in a 2-ml centrifuge tube. One aliquot, treated with 6 µg of catalase dissolved in phosphate buffer to remove any hydrogen peroxide, was used as a blank. Catalase-treated aliquots were allowed to incubate at room temperature for 10 min. A colorimetric reagent was prepared containing 200 ppm 4-aminoantipyrine, 200 ppm phenol, and 100 ppm peroxidase (150 U mg−1) dissolved in a 100 mM acetic acid buffer (pH 5.6). Following incubation of catalase-treated aliquots, 0.75 ml of colorimetric reagent was added to both aliquots. Aliquots were then capped and incubated in a water bath at 30 C for 10 min. Absorbance was read against the catalase blank at 505 nm and converted to “µM H2O2” using a linear standard curve prepared from H2O2 standards contained in the same solutions used for extraction from leaf tissue (Supplementary Figure S3). The standard curve was fit and analyzed using SigmaPlot (v. 11, Systat Software, San Jose, CA). Leaf weight was then used to finally convert to units of micromoles per gram of fresh weight (µmol g FW−1).
Data Analysis
Visible phytotoxicity was subjected to analysis of covariance (ANCOVA) using JMP (JMP Pro v. 13, SAS Institute, Cary, NC), with DAT serving as the covariate. Separate overall analyses estimating the effect of the covariate and environmental factor, herbicide, herbicide rate, time of application, and their interactions were performed under each category of environmental factor (temperature, temperature differential, or humidity) at a significance level of 0.05. Separate ANCOVA analyses were then performed within each significant effect to test for covariate by treatment interactions in order to check homogeneity of slopes. In the case of significant covariate by treatment interactions, the null hypothesis (that the slope of the covariate within each significant treatment effect was statistically similar) was rejected, and the covariate by treatment interaction was retained in the model. If this significant interaction term was retained, slopes were separated using pairwise t-tests of indicator parameterization estimates. Overall means of each treatment are least-squares means, and means separation was carried out using pairwise t-tests at α = 0.05.
For hydrogen peroxide data, ANOVA was carried out using the GLM procedure in JMP to determine significant treatment effects at a significance level of 0.05, with means separation carried out using pairwise t-tests at α = 0.05. For both visible phytotoxicity data and hydrogen peroxide concentration, significant environmental factor by herbicide, herbicide rate, or application timing interaction resulted in a comparison of environmental factors within herbicide/rate combinations. In the case of insignificant environmental factor effects, only significant herbicide, herbicide rate, or application timing effect was subjected to pairwise t-tests. All graphs of visible phytotoxicity and hydrogen peroxide data were prepared using SigmaPlot.
Results and Discussion
Temperature Effect
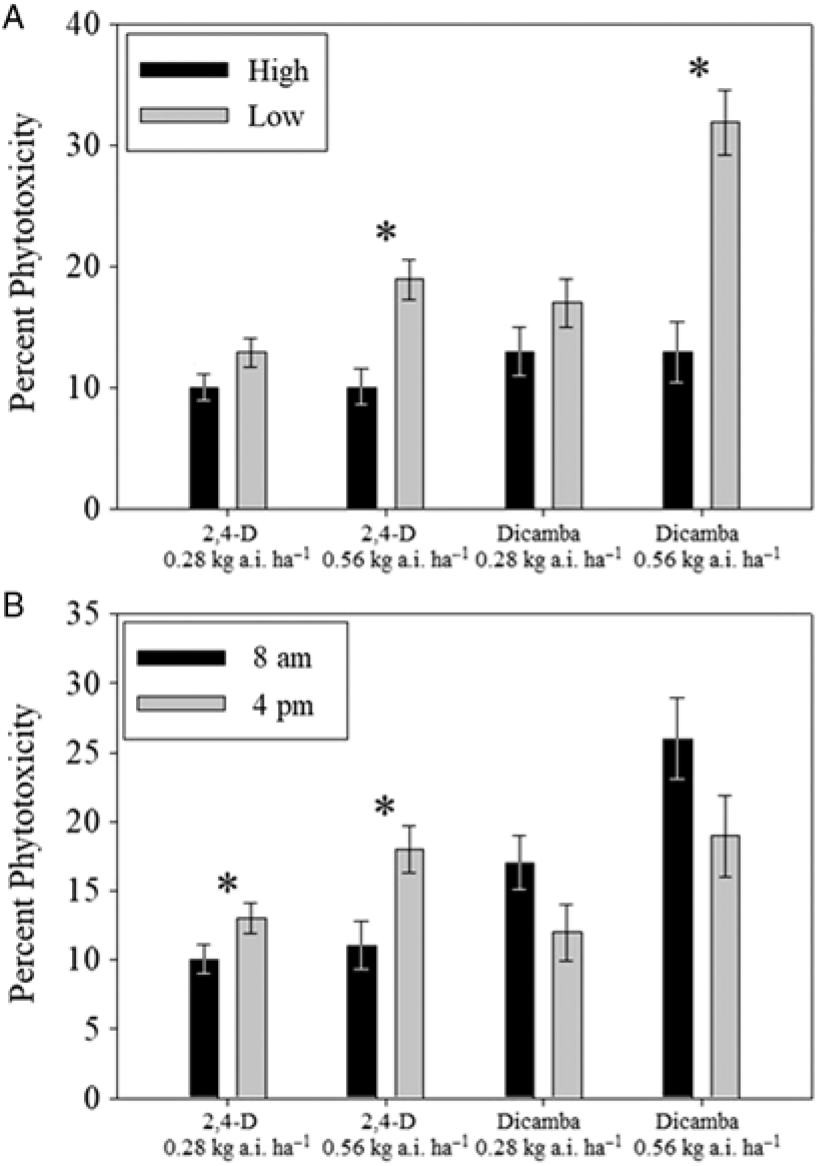
For visible phytotoxicity within temperature environments, no experimental run by temperature or experimental run by application time interactions were detected, thus data were combined over experimental runs. Significant temperature by herbicide and application time by herbicide interactions were detected in the overall analysis (Supplementary Table S1), thus means for temperature and application time are presented within each herbicide/rate combination. Temperature effects pooled across application times were only statistically significant within 2,4-D and dicamba treatments at the high rate (Figure 1). Phytotoxicity from 2,4-D application at 0.56 kg ha−1 was 19% and 10% for the low- and high-temperature treatments, respectively, while phytotoxicity from dicamba applications at 0.56 kg ha−1 resulted in 32% and 13% phytotoxicity for the low- and high-temperature treatments, respectively. Differences in application time pooled across temperature treatments were statistically significant within both rates of 2,4-D, with higher phytotoxicity resulting from 4:00 PM applications than from 8:00 AM applications (Figure 1). Phytotoxicity from 4:00 PM and 8:00 AM applications of 2,4-D at 0.28 kg ha−1 was 13% and 10%, respectively, while phytotoxicity from 4:00 PM and 8:00 AM applications at 0.56 kg ha−1 was 18% and 11%, respectively. There were no significant differences across application times for dicamba at either rate.
Means for effects of different temperature treatments pooled across application times (A) and application times pooled across temperature treatments (B) with different herbicide/rate combinations on visible phytotoxicity in Amaranthus palmeri in growth chamber experiments, 2018. Vertical bars represent standard error of the mean. Means are based on results from analysis of covariance analysis using days after treatment as a covariate. Asterisks represent significant differences within herbicide/rate combinations based on t-test results at α = 0.05.

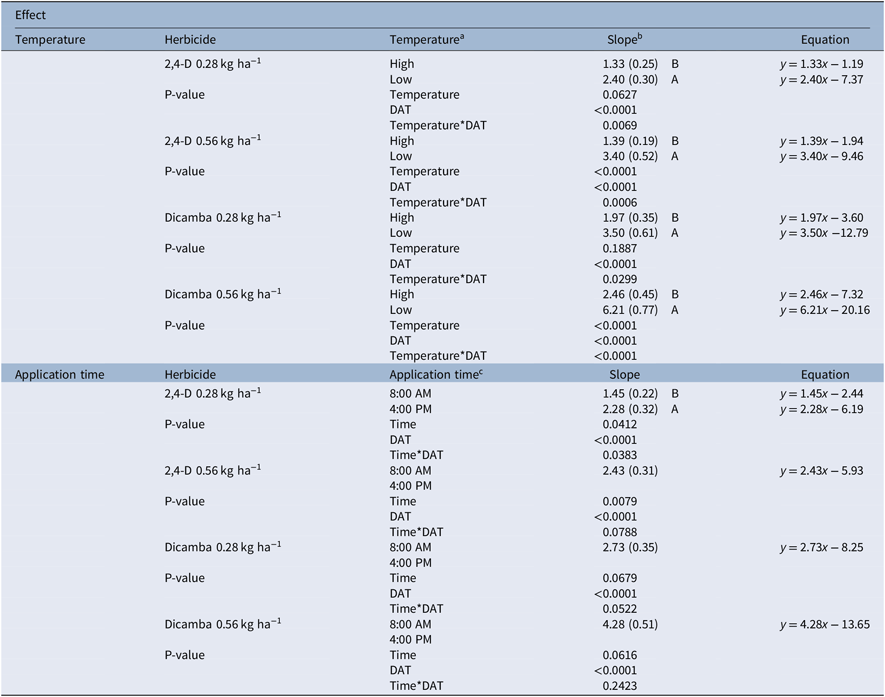
Because significant temperature level by herbicide and application time by herbicide interactions were detected in the overall analysis, separate ANCOVAs were performed on temperature level or application time within each herbicide treatment to determine differences in slopes (Table 1). Temperature by covariate interactions were detected for all herbicide/rate combinations, with higher slopes resulting from the low-temperature level in all cases. This indicates a faster progression of phytotoxicity at the low-temperature level compared with the high-temperature level. Application time by covariate interactions were only detected for 2,4-D at the 0.28 kg ha−1 rate, yielding a higher slope for the 4:00 PM application, indicating a faster progression of phytotoxicity compared with applications made at 8:00 AM.
Slope comparisons for analysis of covariance results comparing effect of temperature treatment and application time within herbicide/rate combinations on percent phytotoxicity in Amaranthus palmeri in growth chamber experiments, 2018.

a DAT, days after treatment. DAT serves as the covariate in analyses. Insignificant temperature or application time by covariate effects at a significance level of 0.05 resulted in one slope being reported for each temperature or application time effect within herbicide/rate combinations.
b Parentheses represent standard error of the slope estimate. Slope estimates followed by different letters differ statistically based on pairwise t-tests of indicator parameterization estimates at α = 0.05.
c Time = application time.
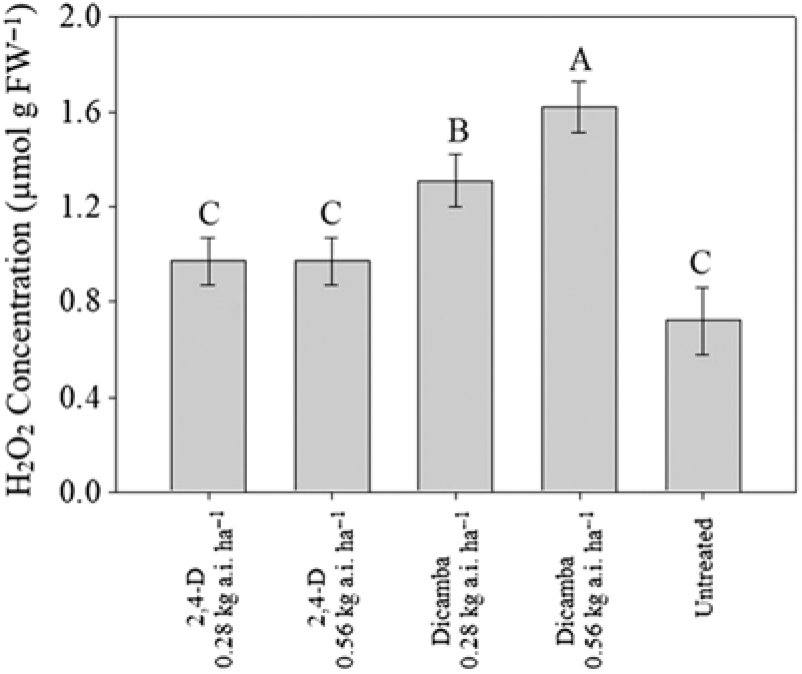
For hydrogen peroxide concentration, significant experimental run by treatment interactions were not detected, thus data were combined over studies. Only herbicide effects were significant within the overall ANOVA (Supplementary Table S2). Dicamba application at the 0.56 kg ha−1 rate resulted in the highest H2O2 concentration at 1.62 µmol g FW−1, followed by dicamba at the 0.28 kg ha−1 rate at 1.31 µmol g FW−1 (Figure 2). Dicamba applications at both rates resulted in significantly higher H2O2 concentration than in nontreated plants. In contrast, 2,4-D applications at 0.28 kg ha−1 and 0.56 kg ha−1 resulted in an H2O2 concentration of 0.97 µmol g FW−1, which was statistically similar to the nontreated concentration (0.72 µmol g FW−1).
Means for hydrogen peroxide concentration in Amaranthus palmeri leaf tissue treated with 2,4-D and dicamba at two rates pooled across two temperature treatments and two application times in growth chamber experiments, 2018. Vertical bars represent standard error of the mean. The same letter above vertical bars indicates means do not differ statistically based on pairwise t-tests at α = 0.05.

It appears that the rate effect with both 2,4-D and dicamba was more pronounced in the low-temperature treatment. Such trends may have to do with increased evaporation of herbicides at higher temperatures resulting in lesser rate effect. This is consistent with ANCOVA results, as higher slopes were observed for all herbicide treatments at the low temperature. This may be a result of increased spray droplet retention before evaporation compared with higher temperatures, resulting in faster realization of herbicidal activity. Indeed, previous research displayed a lesser degree of dicamba volatility at lower temperatures, although similar trends with 2,4-D have not been studied (Behrens and Lueschen Reference Behrens and Lueschen1979). Interestingly, improved translocation of 2,4-D, which may be correlated with increased phytotoxicity, was reported under high temperatures in hemp dogbane (Apocynum cannabinum L.) (Schultz and Burnside Reference Schultz and Burnside1980). This is consistent with similar research that displayed improved translocation of triclopyr, picloram, and 2,4,5-T under higher temperatures (Radosevich and Bayer Reference Radosevich and Bayer1979). While we did not examine temperature in combination with translocation in this study, we observed no resulting increases in phytotoxicity with herbicides at the high temperatures that would support a positive correlation between temperature and translocation. Other past findings that conflict those presented this research include a reported increase in cotton (Gossypium hirsutum L.) and soybean [Glycine max (L.) Merr.] sensitivity to dicamba and 2,4-D in response to higher temperatures during exposure (Al-Khatib and Peterson Reference Al-Khatib and Peterson1999; Kittock and Arle Reference Kittock and Arle1977). As a result of conflicted findings across previous research, further study is necessary to determine mechanisms of temperature-induced differences in phytotoxicity.
Application time effects were observed only for 2,4-D and not dicamba, which could be attributed to the following: Dicamba, a more potent auxinic material in certain species, may have overcome any differences in auxinic herbicide efficacy across application timings due to the increased overall phytotoxicity associated with this herbicide (Leon et al. Reference Leon, Ferrell and Brecke2014; Nandula and Manthey Reference Nandula and Manthey2002). Such an increase in dicamba activity may be associated with differential binding affinities to auxin-binding proteins (Webb and Hall Reference Webb and Hall1995). This has important implications for growers, as applying auxinic herbicides with improved herbicidal activity in general (i.e., dicamba) may provide more flexibility in terms of application timing. A recommendation for increased rates of 2,4-D may be desirable if more potent auxinic materials are not labeled for certain situations. In such cases, crop oil adjuvants may reduce evaporation by improving herbicide penetration (Jansen et al. Reference Jansen, Center and Shaw1961). However, the mechanism responsible for reduced activity observed at times of lower temperature (i.e., 8:00 AM) demands further investigation. This likely is not due to reduced penetration of herbicide molecules as a result of any potentially increased evaporation. Differential translocation across application times has been reported and may describe such a phenomenon, although previous research has shown conflicting results on the nature of the correlation of phytotoxicity with translocation across times of application (Johnston et al. Reference Johnston, Eure, Grey, Culpepper and Vencill2018).
A significant increase in H2O2 content was observed with the high rate of dicamba compared with the lower rate. It is somewhat expected that the H2O2 concentration would be increased with dicamba compared with 2,4-D, as dicamba is a more potent herbicide (Leon et al. Reference Leon, Ferrell and Brecke2014; Nandula and Manthey Reference Nandula and Manthey2002). It is interesting that 2,4-D applications at either rate did not result in significantly higher concentration of H2O2 than in the nontreated; this may be due to either a reduced propensity for 2,4-D to trigger H2O2 formation or simply because rates of 2,4-D were not high enough to induce this phenomenon. It appears that across temperature regimes with temperature differentials held constant, dicamba is a more potent herbicide in A. palmeri, as shown by H2O2 data.
Temperature Differential Effect
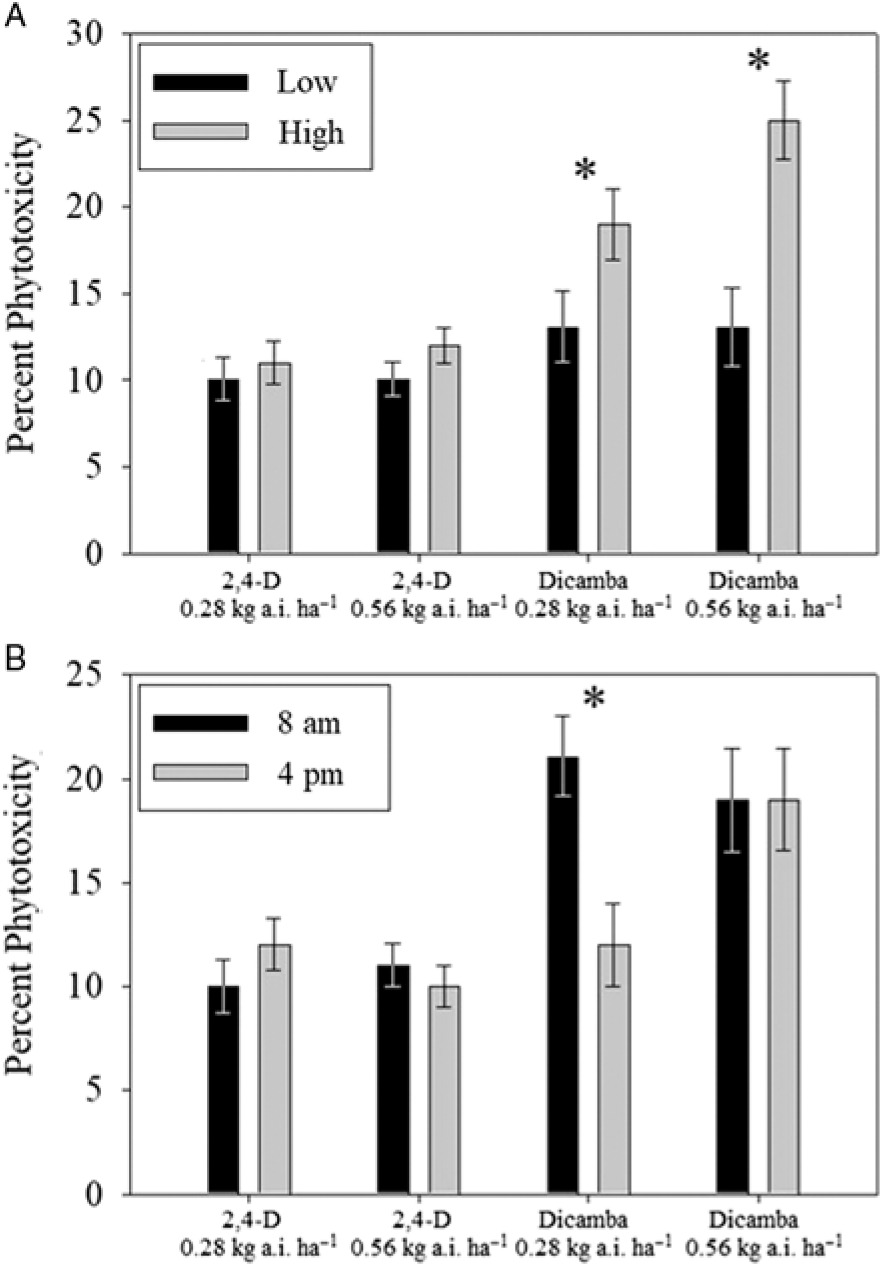
For visible phytotoxicity under temperature differentials, no experimental run by differential or experimental run by application time interactions were detected, thus data were combined over studies. Significant temperature differential by herbicide and application time by herbicide effects were detected. As such, temperature differential and application time effects are presented within each herbicide/rate combination (Supplementary Table S1). Dicamba-induced phytotoxicity was significantly higher at both rates within the high temperature differential treatment, pooled across application times (Figure 3). With dicamba applications at 0.28 kg ha−1, phytotoxicity was 13% and 19% for the low and high differentials, respectively, while at 0.56 kg ha−1 phytotoxicity was 13% and 25% for the low and high differentials, respectively. No significant differences in 2,4-D phytotoxicity were observed across temperature differential treatments. Significant differences in application time pooled across differential treatments were detected only with dicamba at the 0.28 kg ha−1 rate, with 21% phytotoxicity for 8:00 AM applications and 12% for 4:00 PM applications.
Means for effects of different temperature differential treatments pooled across application times (A) and application times pooled across temperature differential treatments (B) with different herbicide/rate combinations on visible phytotoxicity in Amaranthus palmeri in growth chamber experiments, 2018. Vertical bars represent standard error of the mean. Means are based on results from analysis of covariance analysis using days after treatment as a covariate. Asterisks represent significant differences within herbicide/rate combinations based on t-test results at α = 0.05.

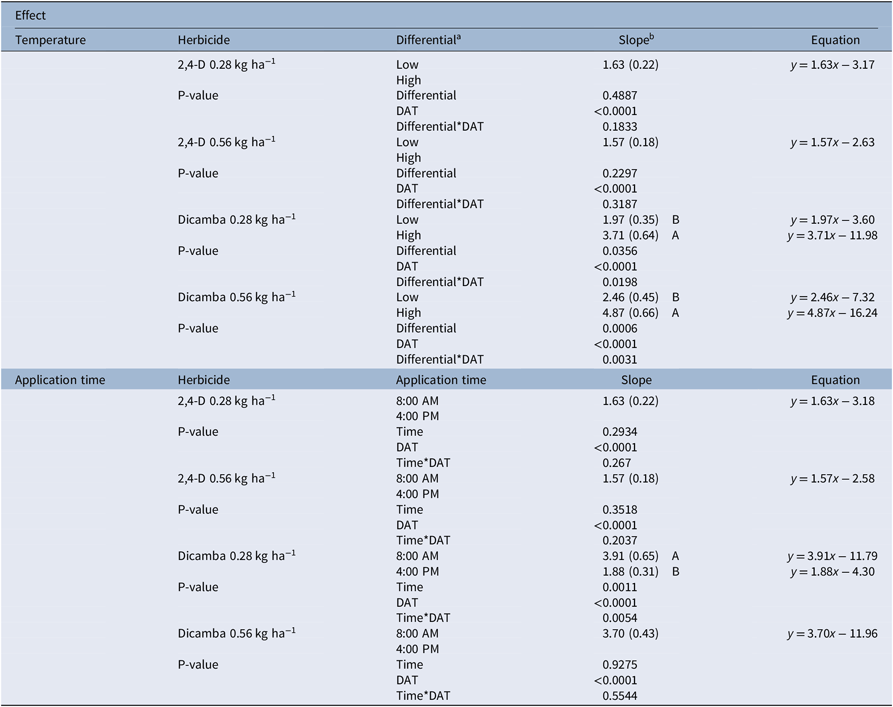
Because significant temperature differential by herbicide and application time by herbicide interactions were detected in the overall analysis, separate ANCOVAs were performed on temperature differential or application time within each herbicide treatment to determine slope differences (Table 2). Significant covariate by temperature differential interactions were detected for dicamba at both rates, and the slope was higher with the high differential at both rates. No significant covariate by temperature differential interactions were detected for 2,4-D at either rate. Covariate by application time interactions were only significant with dicamba at the 0.28 kg ha−1 rate, with a higher slope for 8:00 AM compared with 4:00 PM.
Slope comparisons for analysis of covariance results comparing effect of temperature differential treatment and application time within herbicide/rate combinations on percent phytotoxicity in growth chamber experiments, 2018.

a Differential = temperature differential. DAT, days after treatment. DAT serves as the covariate in analyses. Insignificant temperature differential or application time by covariate effects at a significance level of 0.05 resulted in one slope being reported for each temperature differential or application time effect within herbicide/rate combinations.
b Parentheses represent standard error of the slope estimate. Slope estimates followed by different letters differ statistically based on pairwise t-tests of indicator parameterization estimates at α = 0.05.
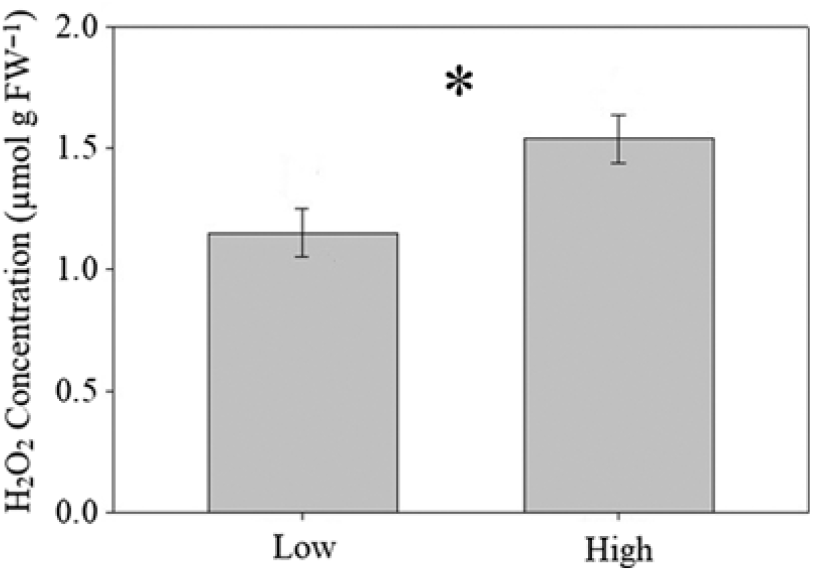
Only the temperature differential effect was significant in the H2O2 ANOVA. Concentration of H2O2 was significantly higher under the high temperature differential at 1.54 µmol g FW−1 compared with the 1.15 µmol g FW−1 observed under the low temperature differential (Figure 4).
Means for hydrogen peroxide concentration in Amaranthus palmeri leaf tissue treated with 2,4-D and dicamba at two temperature differential treatments, pooled across rates and application times in growth chamber experiments, 2018. Vertical bars represent standard error of the mean. Asterisks represent significant differences within herbicide/rate combinations based on t-test results at α = 0.05.

Little to no research has been published on the role of day/night temperature differential on efficacy of auxinic herbicides. Dicamba in general appears to be more sensitive to temperature differentials and application times across a temperature differential gradient, according to the data presented in this study. Increases in phytotoxicity of 46% and 92% were observed with dicamba at 0.28 kg ha−1 and 0.56 kg ha−1, respectively, when the temperature differential was doubled (low to high treatment) (Figure 3). Significantly greater slopes under the high differential at both rates of dicamba are consistent, suggesting a faster progression of phytotoxicity compared with the low differential. It can be presumed that increasing the rate of dicamba would reduce the disparity in phytotoxicity between temperature differentials, although the effect of rate was nonexistent under the low temperature differential. On the contrary, a 32% increase in phytotoxicity was observed when the dicamba rate was increased from 0.28 kg ha−1 to 0.56 kg ha−1 under the high differential treatment.
Overall, these results suggest that dicamba is more rate responsive at high temperature differentials, in addition to being more potent in terms of phytotoxicity. Consistently, more H2O2 production was observed at the high temperature differential compared with the low temperature differential treatment when pooled across application times and herbicides. This further suggests that H2O2 production is well correlated with phytotoxicity. In terms of application time, dicamba provided higher control at 8:00 AM compared with 4:00 PM; however, this application time effect was removed upon increasing the rate. This is interesting, as the opposite trend was observed with 2,4-D across different temperature environments. The fact that the higher rate eliminated the application timing effect suggests that more active ingredient made it into the target site at 4:00 PM compared with the low rate. The results in this paper are consistent with previous research that displayed improved translocation, and subsequently phytotoxicity, of dicamba in B. scoparia under lower temperature regimes (Ou et al. Reference Ou, Stahlman and Jugulam2018).
Humidity Effect
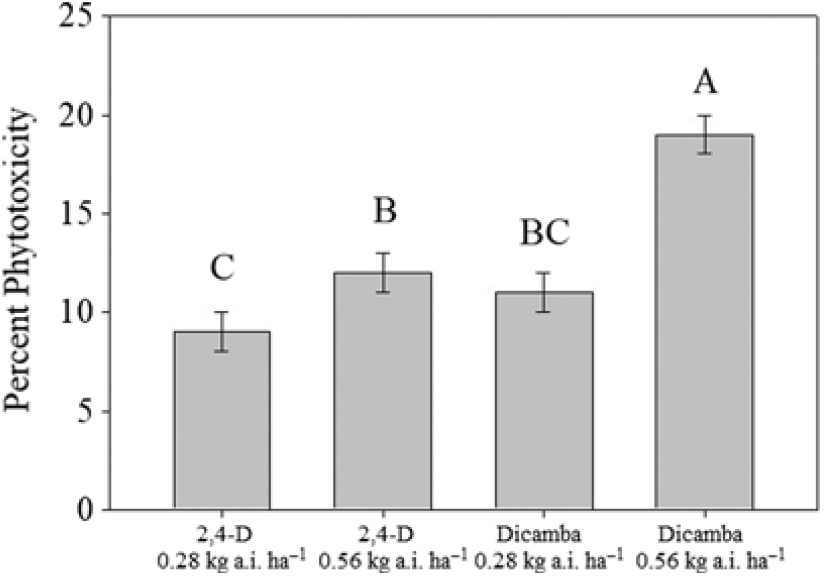
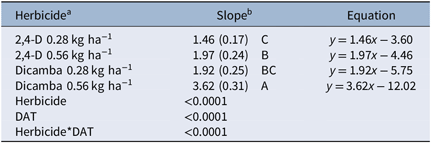
Experimental run by humidity treatment and experimental run by application time interactions were not detected for visible phytotoxicity data within humidity environments, thus results are combined over studies. Only herbicide effects were significant according to the overall ANOVA (Supplementary Table S1). Pooled across humidity treatments and application times, dicamba at the 0.56 kg ha−1 rate resulted in the highest phytotoxicity of 19%, with significantly reduced phytotoxicity from dicamba application at 0.28 kg ha−1 (11%) and 2,4-D application at 0.56 kg ha−1 (12%) (Figure 5). Application of 2,4-D at 0.28 kg ha−1 resulted in 9% phytotoxicity. Phytotoxicity from 2,4-D and dicamba applications at the low rate was statistically similar, as was phytotoxicity from 2,4-D at the high rate and dicamba at the low rate. Herbicide by covariate interactions were significant within the herbicide effect, with the highest slope resulting from dicamba application at 0.56 kg ha−1, followed by a significant decrease with 2,4-D applications at 0.56 kg ha−1 (Table 3). Slopes of both dicamba at the low rate and 2,4-D at the high rate were statistically similar, as were slopes for dicamba and 2,4-D at the low rate.
Means for effect of herbicide/rate combinations pooled across application times and two humidity treatments on visible phytotoxicity in Amaranthus palmeri in growth chamber experiments, 2018. Vertical bars represent standard error of the mean. Means are based on results from analysis of covariance analysis using days after treatment as a covariate. The same letter above vertical bars indicates means do not differ statistically based on pairwise t-tests at α = 0.05.

Slope comparisons for analysis of covariance results comparing effect of herbicide/rate combinations pooled across humidity treatments and application times on percent phytotoxicity in growth chamber experiments, 2018.

a DAT, days after treatment. DAT serves as the covariate in analyses. Insignificant herbicide by covariate effects at a significance level of 0.05 resulted in one slope being reported for each herbicide/rate combination.
b Parentheses represent standard error of the slope estimate. Slope estimates followed by same letters do not differ statistically based on pairwise t-tests of indicator parameterization estimates at α = 0.05.
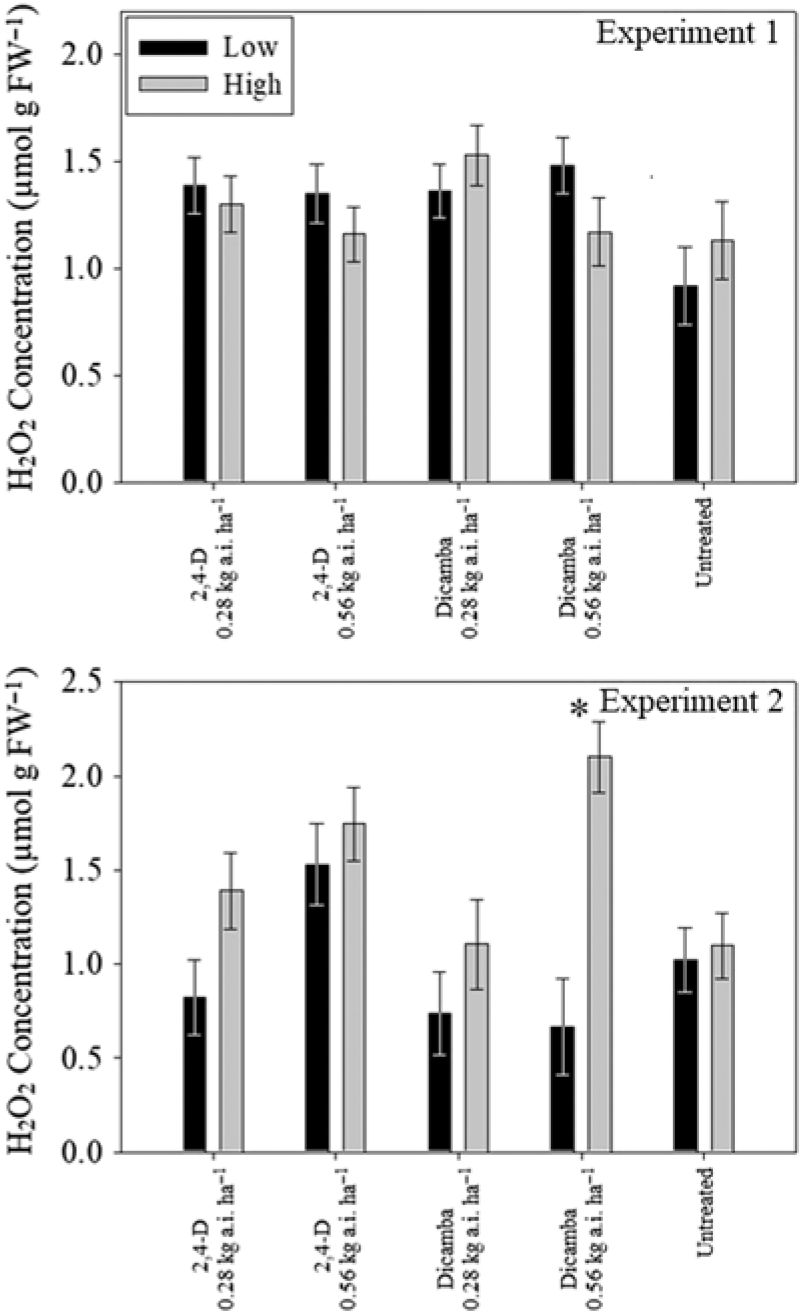
Experimental run by humidity treatment interactions were significant (P < 0.0001) for H2O2 concentration, thus results are presented separately across studies. No significant effects were detected in Experiment 1; however, significant humidity by herbicide interactions were detected in Experiment 2 (Supplementary Table S2). As a result, humidity means are presented within herbicide/rate combinations for both studies for reference (Figure 6).
Means for hydrogen peroxide concentration in Amaranthus palmeri leaf tissue treated with 2,4-D and dicamba under two humidity treatments with different herbicide/rate combinations, pooled across application times in growth chamber experiments, 2018. Vertical bars represent standard error of the mean. Means are based on results from analysis of covariance analysis using days after treatment as a covariate. Asterisks represent significant differences within herbicide/rate combinations based on t-test results at α = 0.05.

The lack of humidity effects suggests temperature may be the most influential environmental factor on differential control of A. palmeri with 2,4-D and dicamba. When herbicide effects were pooled across humidity treatments, trends followed as would be expected; increasing the rate of both 2,4-D and dicamba resulted in significant increases in phytotoxicity, with greater phytotoxicity resulting from dicamba in general. The lack of statistical significance in H2O2 production across treatments in Experiment 1 does not allow for any strong conclusions to be made on humidity effects. However, if H2O2 production is as well correlated with phytotoxicity as was observed for temperature-based environmental factors, there is likely a lack of true, reproducible significant differences across humidity levels using conditions employed in this research. The lack of humidity effects observed here is inconsistent with previous research on 2,4-D and dicamba that linked high humidity to decreased dicamba volatility and/or increased absorption, which would intuitively result in increased phytotoxicity (Al-Khatib et al. Reference Al-Khatib, Parker and Fuerst1992; Behrens and Lueschen Reference Behrens and Lueschen1979; Pallas Reference Pallas1960). Low soil moisture often results in lower phytotoxicity from auxinic herbicides due to plant stress; however, whether or not this has an effect on plant perception of humidity and resulting effects on auxinic herbicide activity demands further investigation (reviewed in Egan et al. Reference Egan, Barlow and Mortensen2014; Friesen and Dew Reference Friesen and Dew1966). The lack of findings in this study, in combination with the reports of previous research displaying increased soybean and cotton sensitivity to 2,4-D and dicamba under dry conditions, suggests this effect is relatively nuanced (Andersen et al. Reference Andersen, Clay, Wrage and Matthees2004; Auch and Arnold Reference Auch and Arnold1978; Kelley et al. Reference Kelley, Wax, Hager and Riechers2005; Weidenhamer et al. Reference Weidenhamer, Triplett and Sobotka1989). Furthermore, moist conditions have been associated with increased sensitivity of cotton alone to 2,4-D and dicamba, convoluting trends even more (reviewed in Egan et al. Reference Egan, Barlow and Mortensen2014; Marple et al. Reference Marple, Al-Khatib, Shoup, Peterson and Claassen2007).
Overall, it appears that temperature-related effects provide the greatest environmental influence on factors tested in this research. In addition, application time effects are significant for 2,4-D and dicamba under different temperature and day/night temperature differential regimes, respectively. Increased rates of dicamba resulted in greater phytotoxicity to A. palmeri in general when negative application time effects were present; however, increasing rates appears to only improve phytotoxicity significantly at lower temperatures. As such, applying dicamba under lower temperatures and conditions where the day/night temperature differential (when possible) is greatest likely provides the best strategy for maximizing efficacy according to this research. Similarly, increasing 2,4-D rates appears to improve phytotoxicity more at low temperatures. In general, 2,4-D−induced phytotoxicity was insensitive to temperature differentials, indicating potentially greater flexibility for growers to apply this herbicide with greatly fluctuating day/night temperatures compared with dicamba. In addition, applications of 2,4-D appear to have greater efficacy at midday across temperatures. Further research is highly warranted on how these effects may differ with respect to other factors, including growth stage, presence of adjuvants, and other coinciding agronomic practices. Development of a rapid H2O2 assay in herbicide-treated plant tissues may provide a useful tool for agronomists to determine the efficacy of 2,4-D and dicamba applications. In the face of rapidly evolving herbicide resistance and the need for maintaining stewardship of auxinic herbicide chemistries, it is critical that agronomists maintain application strategies for 2,4-D and dicamba that take time of application and temperature influences into consideration.
Supplementary Material
To view supplementary material for this article, please visit https://doi.org/10.1017/wsc.2019.51.
Acknowledgments
The authors would like to thank Joseph Gaines and Zack Sanders for technical support during this research. No conflicts of interest have been declared. This research received no specific grant from any funding agency or the commercial or not-for-profit sectors.