Introduction
The greenhouse gas CO2 plays a key role in controlling Earth’s climate (Matear & Hirst Reference Matear and Hirst1999, Plattner et al. Reference Plattner, Joos, Stoccker and Marchal2001, Feely et al. Reference Feely, Sabine, Takahashi and Wanninkhof2001). Recognizing the role of anthropogenic CO2 emissions in climate change, there are many studies designed to investigate, understand and quantify the global carbon cycle (Takahashi et al. Reference Takahashi, Olafsson, Goddard, Chipman and Sutherland1993, Houghton et al. Reference Houghton, Ding, Griggs, Noguer, van der Linden, Dai, Maskell and Johnson2001, Thomas et al. Reference Thomas, Bozec, Elkalay, De Baar, Borges and Schiettecatte2005, Solomon et al. Reference Solomon, Qin, Manning, Chen, Marquis, Averyt, Tignor and Miller2007). Quantifying the air-sea CO2 flux over the global ocean is an important part of this effort (Goyet et al. Reference Goyet, Millero, Poisson and Shafer1993, Conway et al. Reference Conway, Tans, Waterman, Thoning, Kitzis, Masarie and Zhang1994, Sabine et al. Reference Sabine, Feely, Key, Lee, Bullister, Wanninkhof, Wong, Wallace, Tilbrook, Millero, Peng, Kozyr, Ono and Rios2004). Thus, large international projects such as WOCE (the World Ocean Circulation Experiment), or JGOFS (Joint Global Ocean Flux Study), as well as French national projects such as, MINERVE (Mesure à l’INterface Eau-aiR de la Variabilité des Echanges de CO2), or OISO (Océan Indien Service d’Observation) were designed to understand and assess the ocean’s role in the global carbon cycle.
The Southern Ocean presents large sea-surface pCO2 (pCO2sea) variations. It is alternatively a CO2 source and a CO2 sink area for the atmosphere. The specific strength, location, and temporal evolution of these CO2 source/sink areas are still debated (Brévière et al. Reference Brévière, Metzl, Poisson and Tilbrook2006, Borges et al. Reference Borges, Tilbrook, Metzl, Lenton and Delille2007). In order to quantify and understand the spatial and temporal variations of pCO2, repeat cruises in the same ocean area over several years are necessary (Poisson et al. Reference Poisson, Metzl, Brunet, Schauer, Bres, Ruiz-Pino and Louanchi1993, Takahashi et al. Reference Takahashi, Olafsson, Goddard, Chipman and Sutherland1993, Metzl et al. Reference Metzl, Tilbrook and Poisson1995, Reference Metzl, Poisson, Louanchi, Brunet, Shauer and Brès1999, Bakker et al. Reference Bakker, De Baar and Bathmann1997, Jabaud-Jan et al. Reference Jabaud-Jan, Metzl, Brunet, Poisson and Schauer2004, Brévière et al. Reference Brévière, Metzl, Poisson and Tilbrook2006). In the Antarctic Ocean, harsh weather and winter ice cover strongly limit all in situ observations. As a result, the dataset in this ocean area remains relatively sparce.
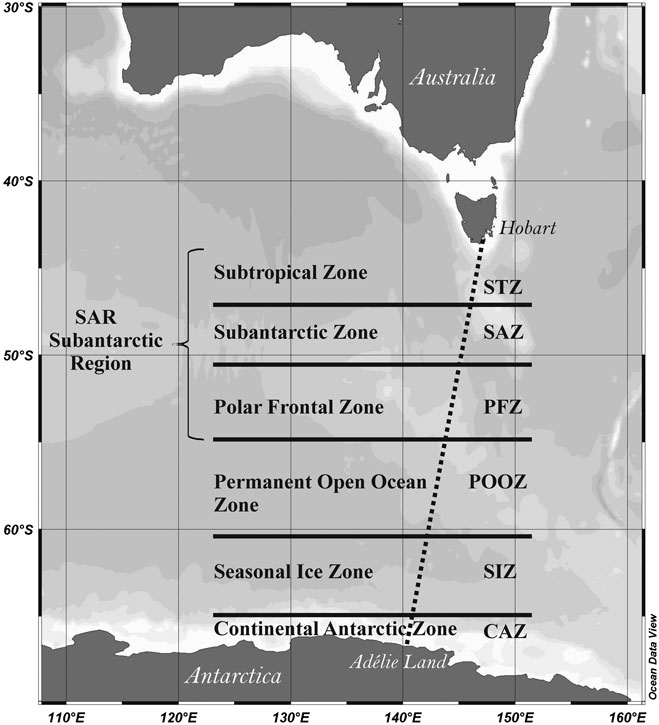
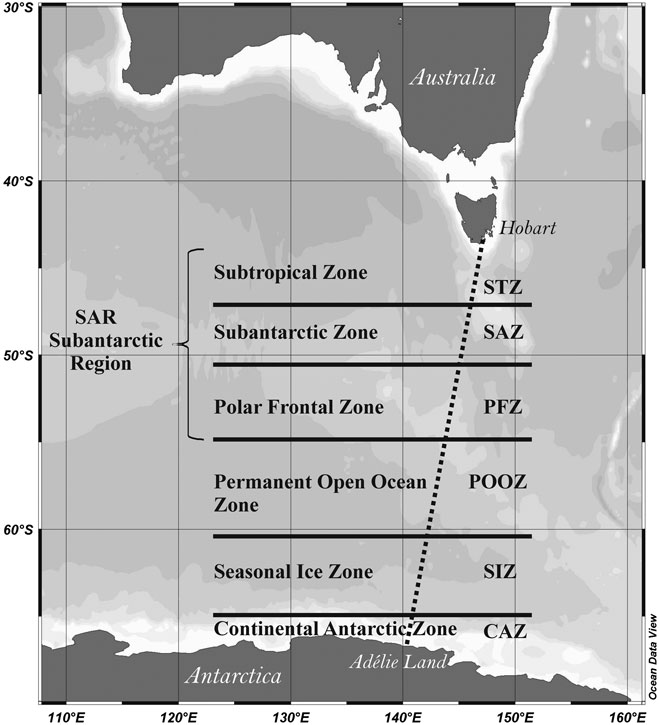
In this paper, we investigate the spatial and temporal variability of air-sea CO2 exchanges in the Southern Indian Ocean from October 2005 (spring) to March 2006 (late summer). The analysis is performed along transects between Hobart (Tasmania, Australia; 43.0°S) and Dumont D’Urville (Adélie Land, Antarctica; 67.0°S) (Fig. 1), for which we continually measured pCO2sea, pCO2air, AT, and CT along with SSS and SST. In spring, the ship broke the ice and we sampled the seawater along the ship’s track for continual measurements of pCO2sea, AT, and CT, providing us data for seawater from under the ice. In this study, we quantify the temporal variations of pCO2sea, as well as those of the air-sea CO2 fluxes, of AT and CT. In particular, we show how they respond to changes in sea surface temperature (SST) and salinity (SSS). The work follows the study of Brévière et al. (Reference Brévière, Metzl, Poisson and Tilbrook2006) who used data from cruises in 2002/2003.
Map showing the study area during MINERVE cruises in October 2005/March 2006. Transect 1: from Hobart (Tasmania, Australia) to Dumont D’Urville (Adélie Land, Antarctica). Transect 2: from Dumont D’Urville to Hobart. The six different hydrographic zones are indicated.
Materials and methods
The three MINERVE cruises on board RV Astrolabe were made between Hobart (43.0°S) and Dumont D’Urville (67.0°S) in 2005–2006 (Fig. 1). The first cruise started in spring from 18 October–8 November 2005, the second cruise in summer from 30 December 2005–26 January 2006, and the third cruise in late summer from 17 February–2 March 2006. Along each cruise track, a pump brought surface seawater (from about 5 m depth) on board for continual measurements of pCO2sea, AT, CT, temperature and salinity. In this ocean area (south of 43°S), seawater from 5 m depth can reasonably be assumed to be “surface seawater” since there is continual turbulence from wind/wave action. In addition, we regularly collected discrete 500 ml samples of surface seawater (six per day), for further AT and CT measurement on shore. These discrete samples were immediately poisoned with saturated mercuric chloride solution (HgCl2) and stored to be later analysed in the Laboratoire d’Océanographie et du Climat: Expérimentations et Approches Numérique (LOCEN/IPSL), Université Pierre et Marie Curie, Paris, France.
Measurements of partial pressure of CO2 in surface seawater (pCO2sea) and in the atmosphere (pCO2air)
The sea surface pCO2 measurement technique has been previously described (Poisson et al. Reference Poisson, Metzl, Brunet, Schauer, Bres, Ruiz-Pino and Louanchi1993, Metzl et al. Reference Metzl, Tilbrook and Poisson1995, Reference Metzl, Poisson, Louanchi, Brunet, Shauer and Brès1999, Jabaud-Jan et al. Reference Jabaud-Jan, Metzl, Brunet, Poisson and Schauer2004, Brévière et al. Reference Brévière, Metzl, Poisson and Tilbrook2006). Surface seawater is continuously equilibrated using a “thin film” type equilibrator thermostated with surface seawater. The CO2 gas from the equilibrated dried gas is measured every six minutes with a non-dispersive infrared analyser (Li-COR 6262) with an accuracy of ± 2 μatm. The continual measurement system was periodically calibrated (every six hours) with standard gases with CO2 partial pressure of 275.5 ± 1.0 μatm, 380.8 ± 1.0 μatm and 498.5 ± 1.0 μatm. The entire measurement system was automated using a computer. The atmospheric pCO2 was automatically measured every six hours in air samples collected from the top of the bridge at approximately 10–12 m above the sea surface.
Temperature and salinity were measured with a Sea-Bird thermosalinograph positioned at the intake of the seawater flow. The temperature in the equilibrium cell was 0.7 ± 0.2°C warmer than in situ temperature due to warming along the line from the intake to the equilibrium cell. We use the Copin-Montégut polynomials (Reference Copin-Montégut1988, Reference Copin-Montégut1989) to correct sea surface pCO2 measurements to the in situ temperature.
In order to quantify the net air-sea CO2 flux (F) (mmol.m-2.d-1), we used the well known relationship:

Where K, is the gas transfer velocity, calculated using the cubic wind speed relationship of Wanninkhof & McGillis (Reference Wanninkhof and McGillis1999). Wind speeds were recorded on board once a minute. The CO2 solubility coefficient (α) is calculated as a function of SSS and SST (Weiss Reference Weiss1974); and ΔpCO2 (pCO2sea - pCO2air) is the difference of pCO2 in surface seawater (pCO2sea) and in the atmosphere (pCO2air). The ΔpCO2 sets the direction of CO2 gas exchange and is controlled by complex physical (mainly temperature and salinity), chemical (mainly total alkalinity and total inorganic carbon) and biological (mainly plankton) interactions. In order to compare our results with the previous ones (Brévière et al. Reference Brévière, Metzl, Poisson and Tilbrook2006), we used the cubic relationship of Wanninkhof & McGillis (Reference Wanninkhof and McGillis1999) to calculate the gas transfer velocities.
Measurements of sea surface total alkalinity (AT) and total dissolved inorganic carbon (CT)
AT and CT measurements were performed in closed cell Goyet et al. (Reference Goyet, Beauverger, Brunet and Poisson1991) using a potentiometric method (Edmond Reference Edmond1970). A fully automated system was maintained at constant temperature (18.0 ± 0.1°C) by a thermostated water bath, and an automatic burette, allowed us to perform continual measurements of sea surface AT and CT about every 25 min along the transect. The ionic strength of the hydrochloric acid solution (0.1 N) used for the titration was adjusted with NaCl in order to be similar to that of the seawater samples. The computer recorded the seawater sample temperature and salinity, transferred the seawater into the cell, and controlled the titration. Then AT and CT were computed using a nonlinear regression method (Dickson & Goyet Reference Dickson and Goyet1994). These AT and CT measurements were referenced to those of CRMs bought from Dr A.G. Dickson (SCRIPPS, USA) measured regularly on board and on shore. The precision of AT and CT measurements were estimated at 3.5 μmol.kg-1 and 2.7 μmol.kg-1, respectively on board, and of 2.9 μmol.kg-1 and 3.0 μmol.kg-1, respectively on shore. The reproducibility estimated from replicate analyses of sea surface samples is 2.9 μmol.kg-1 and 2.2 μmol.kg-1 for AT and CT, respectively.
Comparison between measurements performed on board and on shore and internal consistency between AT, CT and pCO2
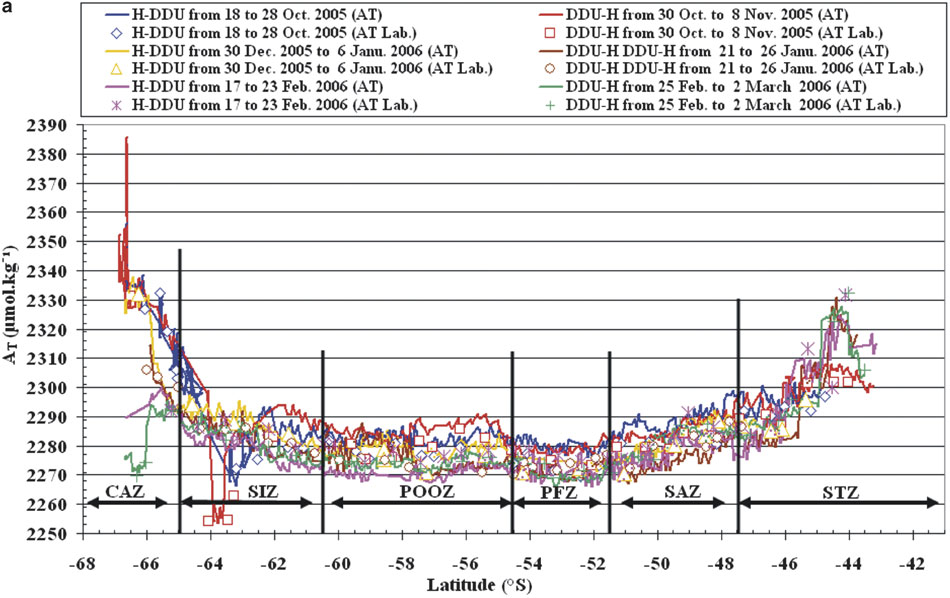
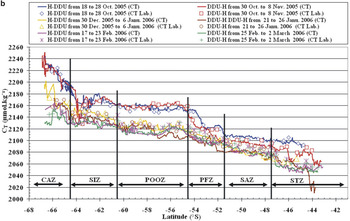
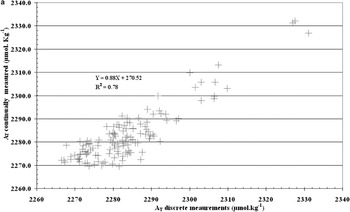
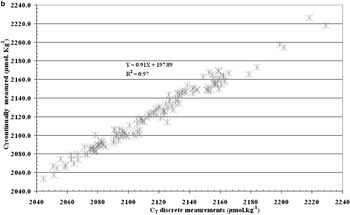
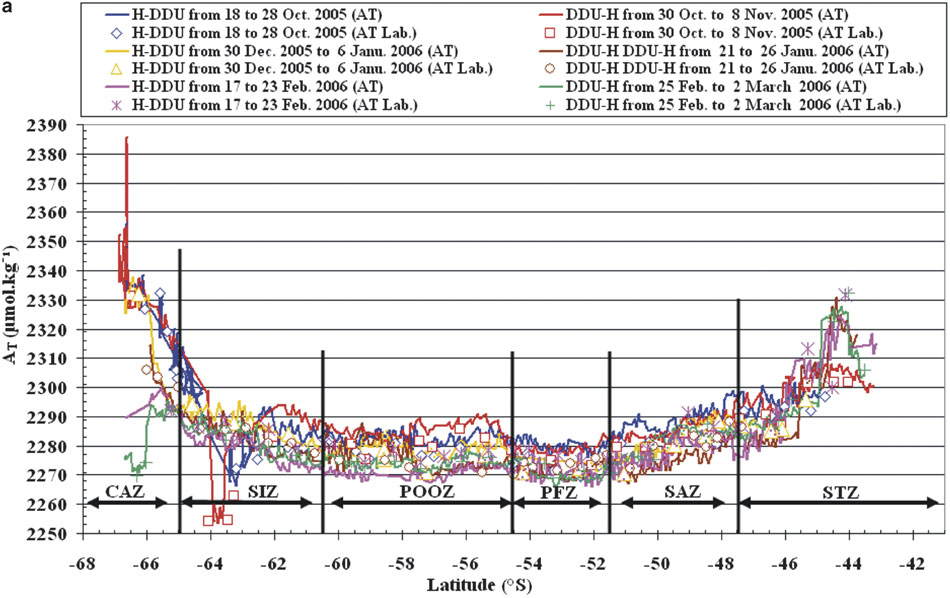
The concentrations of AT and CT continually measured on board were checked against the discrete measurements performed on shore (LOCEN/IPSL). As expected, AT and CT displayed the same tendency along the cruises for both measurements (Fig. 2a & b). Sometimes small differences were observed. The ΔAT (-1.3 μmol.kg-1) and ΔCT (5.5 μmol.kg-1) are the mean differences between measurements on shore (discrete measurements) and on board (continually measured). These differences may be due to changes in the samples during shipping and/or storage. These on shore measurements confirmed the good quality of the on board measurements. The correlation between AT and CT measurements on board and on shore for both seasons (spring and summer) are better for CT than for AT (0.97 and 0.78 respectively) (Fig. 3a & b).
a. Temporal variations of total alkalinity in surface seawater measured: 1 = on board (lines, AT), 2 = in the laboratory (symbols, AT Lab.), along transects between Hobart (H) and Dumont D’Urville (DDU).
b. Temporal variations of total dissolved inorganic carbon in surface seawater measured: 1 = on board (lines, CT), 2 = in the laboratory (symbols, CT Lab.), along transects between Hobart (H) and Dumont D’Urville (DDU).

a. Correlation between the AT measured on board and on shore for both seasons (spring and summer) along transects H–DDU and DDU–H.

b. Correlation between the CT measured on board and on shore for both seasons (spring and summer) along transects H–DDU and DDU–H.

The internal consistency between AT, CT and pCO2 was calculated using the programme CO2SYS of Lewis & Wallace (Reference Lewis and Wallace1998). The programme calculates pCO2 based on user-selected dissociation constants for carbonic acid K1 and K2 (Mehrbach et al. Reference Mehrbach, Culberson, Hawley and Pytkowicz1973, Goyet & Poisson Reference Goyet and Poisson1989, Roy et al. Reference Roy, Roy, Vogel, Porter-Moore, Pearson and Good1993) and CT and AT measurements. The mean differences of ΔpCO2 (pCO2 measured - pCO2 calculated) are 11.7 ± 11.0 μatm, 10.3 ± 16.4 μatm and 10.2 ± 17.0 μatm respectively. Consequently, in this ocean area, the constants of Goyet & Poisson (Reference Goyet and Poisson1989) seem to provide the best results for accuracy and precision. The pCO2 calculated as a function of AT, CT, temperature and salinity can be used to estimate the spatio-temporal variations in the Southern Ocean south of Australia (43–67°S).
Sea surface temperature (SST) and salinity (SSS)
A Sea-Bird thermosalinograph (SBE 21), calibrated at CSIRO (Commonwealth Scientific and Industrial Research Organisation, Australia), continuously measured sea surface temperature (SST) and salinity (SSS) at the seawater intake. The accuracies of these measurements are ± 0.01°C and ± 0.002 respectively.
Results and discussion
Major oceanic zones
The Southern Ocean is divided into four main zones, with well-known fronts as boundaries (Rintoul et al. Reference Rintoul, Donjuy and Roemnich1997, Chaigneau & Morrow Reference Chaigneau and Morrow2002, Sokolov & Rintoul Reference Sokolov and Rintoul2002, Kostianoy et al. Reference Kostianoy, Ginzburg, Frankignoulle and Delille2004). The cruise tracks crossed five hydrological fronts. We used criteria based on sea surface salinity and temperature to characterize the following four different zones:
1. The Sub-Antarctic Region, SAR, located at 48.5 ± 6.0°S. Within this large area, there are three zones:
a. The Sub-Tropical Zone, STZ, located at 45.5 ± 2.0°S (salinity drops from 35.51 at 44.11°S to 34.31 at 47.19°S and temperature decreases from 18.21°C at 43.15°S to 9.46°C at 47.27°S).
b. The Sub-Antarctic Zone, SAZ, located at 49.5 ± 2.0°S (salinity drops from 34.68 at 47.65°S to 33.90 at 51.42°S; temperature falls from 11.57°C at 47.78°S to 7.43°C at 51.47°S).
c. The Polar Frontal Zone, PFZ, located at 53.0 ± 1.5°S (salinity drops from 34.35 at 51.70°S to 33.81 at 54.43°S and temperature decreases from 9.27°C at 51.61°S to 1.48°C at 54.45°S).
2. The Permanent Open Ocean Zone, POOZ, located at 57.5 ± 3.0°S (salinity shows a slight increase from 33.81 at 54.56°S to 33.95 at 60.46°S and a sharp drop in temperature from 4.99°C at 54.55°S to -0.45°C at 60.49°S).
3. The Seasonal Ice Zone, SIZ, located at 63.0 ± 2.0°S (salinity shows an increase from 33.94 at 60.58°S to 34.14 at 64.86°S; temperature falls from 3.77°C at 60.61°S to 1.81°C at 64.88°S).
4. The Continental Antarctic Zone, CAZ, located at 66.0 ± 1.0°S (salinity drops sharply from 34.25 at 65.06°S to 35.17 at 66.62°S; temperature shows a decrease from 0.49°C at 65.13°S to -1.92°C at 66.79°S).
Along the cruise tracks we observed an atmospheric CO2 partial pressure (pCO2air) of 380 ± 2 μatm. Below we analyse within each zone, the temporal variability of pCO2sea, air-sea CO2 fluxes, AT, CT, SSS and SST.
Sub-Tropical Zone (STZ; 45.5 ± 2.0°S)
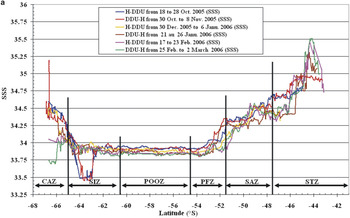
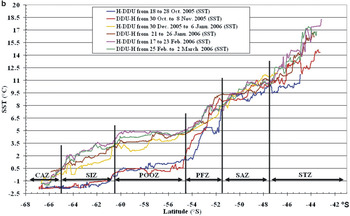
In the STZ the concentrations of AT decreased southward, from 2331.4 μmol.kg-1 to 2275.3 μmol.kg-1; Fig. 2a. These variations are mainly associated with those of salinity and temperature (Fig. 4a & b). Both parameters (SSS and SST) also decreased southward from 35.47 to 34.34 and from 18.0°C to 9.0°C respectively.
a. Distribution of the sea surface salinity (SSS) between Hobart and Dumont D’Urville from October 2005 to March 2006. b. Distribution of the sea surface temperature (SST) along transects (H–DDU and DDU–H) from October 2005 to March 2006.

b. Distribution of the sea surface temperature (SST) along transects (H–DDU and DDU–H) from October 2005 to March 2006.

In contrast, we observe (Fig. 2b), that CT concentrations increased southward, with high concentrations in spring (2056.4–2101.8 μmol.kg-1) and low concentrations in summer (2010.7–2077.8 μmol.kg-1). The data showed large temporal variations for both parameters (AT and CT) with low CT concentrations and high AT concentrations in October 2005 and March 2006 as earlier observed in the southwest Indian Ocean (Goyet et al. Reference Goyet, Beauverger, Brunet and Poisson1991).
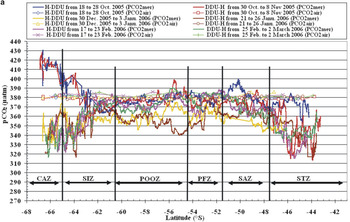
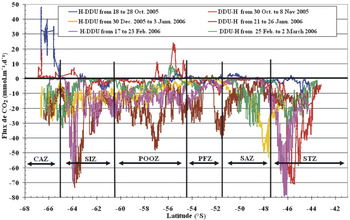
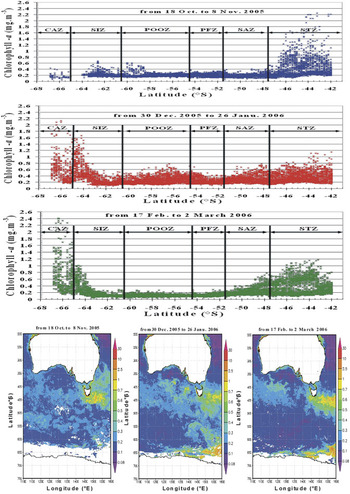
The STZ is considered as a strong sink for atmospheric CO2 (Siegenthaler & Sarmiento Reference Siegenthaler and Sarmiento1993, Metzl et al. Reference Metzl, Poisson, Louanchi, Brunet, Shauer and Brès1995, Caldeira & Duffy Reference Caldeira and Duffy2000, Brévière et al. Reference Brévière, Metzl, Poisson and Tilbrook2006, Borges et al. Reference Borges, Tilbrook, Metzl, Lenton and Delille2007). In this area, pCO2sea decreases from spring to summer (384.4–313.6 μatm; Fig. 5a). The ΔpCO2 is slightly positive in spring (up to + 5.3 μatm) and strongly negative in summer (down to -67.1 μatm; Fig. 5b). As a result, CO2 fluxes (Fig. 6) displayed significant spatio-temporal (spring–summer) variations. In the spring of 2005 the CO2 flux minimum (1.2 mmol.m-2.d-1) was centred at 45.79°S and its maximum (-71.1 mmol.m-2.d-1) was observed at 45.44°S. Whereas in summer 2006, we observed the CO2 flux minimum (-2.2 mmol.m-2.d-1) at 43.56°S and its maximum (-77.0 mmol.m-2.d-1) was detect at 46.33°S. The air to sea CO2 flux exhibits a pattern already noticed south of Tasmania (Inoue et al. Reference Inoue, Ishii, Matsueda, Saito, Midorikawa and Nemoto1999, Metzl et al. Reference Metzl, Tilbrook and Poisson1999, Ishii et al. Reference Ishii, Inoue and Matsueda2002, Inoue & Ishii Reference Inoue and Ishii2005). The seasonal variations of pCO2sea usually follow those of sea surface temperature (Weiss et al. Reference Weiss, Jahne and Keeling1982, Poisson et al. Reference Poisson, Metzl, Brunet, Schauer, Bres, Ruiz-Pino and Louanchi1993, Takahashi et al. Reference Takahashi, Olafsson, Goddard, Chipman and Sutherland1993, Inoue et al. Reference Inoue, Ishii, Matsueda, Ishii, Fushimi, Hitrota, Asanuma and Takasugi1995, Metzl et al. Reference Metzl, Poisson, Louanchi, Brunet, Shauer and Brès1995, Wong et al. Reference Wong, Chan, Page, Smith, Bellegay and Iseki1995). However, pCO2sea is also affected by local biological activity characterized by chlorophyll a (chl a) concentrations. SeaWiFs data show decreased chl a concentrations southward, with high concentrations in spring (0.11–2.21 mg m-3) and low concentrations in summer (0.10–1.15 mg m-3; Fig. 7).
a. Seasonal variability of CO2 partial pressure in surface seawater (pCO2sea) and in atmosphere (pCO2air) along the cruise tracks. b. Distributions of ΔpCO2 = (pCO2sea - pCO2air) in surface seawater of southern Ocean south of Australia along the cruise tracks.

b. Distributions of ΔpCO2 = (pCO2sea - pCO2air) in surface seawater of southern Ocean south of Australia along the cruise tracks.

Temporal variabilities of the CO2 air-sea fluxes in Southern Ocean south of Australia over the six zones from October 2005 to March 2006.

SeaWiFS (http://seawifs.gsfc.nasa.gov/SEAWIFS.html) distribution of monthly mean chl a concentrations (mg.m-3) along transects between Hobart and Dumont D’Urville.

In the STZ the temporal variations of CT and pCO2sea are mainly influenced by those of SST (Lee et al. Reference Lee, Wanninkhof, Takahashi, Doney and Feely1998), especially during the summer when the mixed layer depth is relatively shallow due to reduced vertical mixing. Thus, the sea surface temperature rose from 12.0 ± 3.0°C in spring to 14.0 ± 4.0°C in summer (Fig. 4b). In the STZ both temperature and biological activity affect significantly pCO2sea and CT.
Sub-Antarctic Zone (SAZ; 49.5 ± 2.0°S)
Between 48–51°S AT concentrations (Fig. 2a) are high in spring (2281.3–2298.7 μmol.kg-1), and low in summer (2268.3–2292.0 μmol.kg-1). The variations of AT in surface seawater are linearly linked with those of salinity (Fig. 4a). Within this area, the sea surface temperature decreased southward from 11.6°C to 7.4°C (Fig. 4b).
The CT concentrations in surface seawater increased slightly southward and display significant temporal variations (Fig. 2b). The data indicate high concentrations in spring (2088.5–2110.1 μmol.kg-1) and low concentrations in summer (2067.6–2096.6 μmol.kg-1). The temporal variations of CT are inversely associated with those of sea surface chl a concentrations, which increased from spring (0.06–0.42 mg m-3) to summer (0.07–0.77 mg m-3; Fig. 7).
In the SAZ, pCO2sea increases southward from 343.1 to 399.8 μatm; Fig. 5a. ΔpCO2 (pCO2sea - pCO2air) was positive in spring up to +20.67 μatm (around 50°S) and negative in summer down to -37.03 μatm (around 48°S); Fig. 5b. Thus, during summer the SAZ is a CO2 sink with southward variations of the air to sea CO2 flux (-53.0 to -0.9 mmol.m-2.d-1, Fig. 6). In this area too, the seasonal variations of both sea surface temperature and biological activity controlled the air-sea CO2 fluxes.
Polar Frontal Zone (PFZ; 53.0 ± 1.5°S)
The temporal variations of AT concentrations were relatively small. They decreased slightly from spring (2280 ± 4 μmol.kg-1) to summer (2270 ± 4 μmol.kg-1; Fig. 2a). Simultaneously, the CT concentrations decreased from spring (2124.9 ± 26.9 μmol.kg-1) to summer (2097.2 ± 17.5 μmol.kg-1; Fig. 2b). Sea surface salinity decreased southward, from a mean of 34.09 ± 0.26 in spring to 34.16 ± 0.17 in summer (Fig. 4a). Mean temperature increased from 5.25 ± 2.24°C in spring to 6.95 ± 1.25°C in summer (Fig. 4b).
Within the PFZ, pCO2sea was close to equilibrium with pCO2air (Fig. 5a). As observed earlier (Jabaud-Jan et al. Reference Jabaud-Jan, Metzl, Brunet, Poisson and Schauer2004), the spatial distribution of pCO2sea creates a mosaic with high, low, and near-equilibrium values compared to that of pCO2air. Globally, mean pCO2sea decreased from 375.8 ± 18.9 μatm in spring to 369.9 ± 11.5 μatm in summer. The high variations of ΔpCO2 observed within the PFZ ranged from -34.93 to +8.87 μatm (Fig. 5b). Consequently, the estimated air-sea CO2 flux varied from -40.6 to +2.3 mmol.m-2.d-1 in summer, and from -10.5 to +2.5 mmol.m-2.d-1 in spring (Fig. 6).
In the PFZ the pCO2sea and CT are higher during spring than during summer. This is probably linked to the deepening of the mixed-layer in winter (i.e. mixing of surface water with CO2 enriched subsurface waters). In summer, the increase of temperature induces a relatively shallow mixed layer and reduces upwelling. The mean primary production in surface waters is relatively low especially during summer (0.18 ± 0.08 mg m-3; Fig. 7) where nutrients are low. We conclude that sea surface temporal pCO2 variations are mostly controlled by seasonal changes of vertical dynamics.
Permanent Open Ocean Zone (POOZ; 57.5 ± 3.0°S)
In POOZ the AT concentrations (2271 ± 7 μmol.kg-1; Fig. 2a) display no significant spatio-temporal variations. In contrast, CT concentrations show significant temporal variations with high concentrations in spring (2157.2 ± 5 μmol.kg-1) and low concentrations in summer (2117.4 ± 14.8 μmol.kg-1; Fig. 2b). Salinity (33.86 ± 0.10; Fig. 4a) does not vary enough to create significant temporal variation in AT. As observed earlier (Volk & Hoffert Reference Volk and Hoffert1985) the temporal variations of CT are inversely correlated with those of SST (0.58 ± 0.47°C in spring and 4.19 ± 0.61°C in summer; Fig. 4b).
The pCO2sea varies from 397.1 μatm in spring to 346.7 μatm in summer (Fig. 5a). The mixed layer depth is relatively shallow, about 40–60 m in summer (Chaigneau et al. Reference Chaigneau, Morrow and Rintoul2004), and reduced vertical mixing contributes to an increase of SST (Fig. 4b). Primary production is much higher (0.11–0.78 mg m-3) in summer than in spring (0.13–0.61 mg m-3; Fig. 7). Therefore, the sea surface spatio-temporal variations are mainly controlled by biological activity. As a result, the POOZ was a CO2 sink in summer (on average of ΔpCO2 = -15.6 ± 10.3 μatm; Fig. 5b) with an associated average CO2 flux of -11.5 ± 8.9 mmol.m-2.d-1 (Fig. 6).
Seasonal Ice Zone (SIZ; 63.0 ± 2.0°S)
The SIZ is a contrasting area with a transition from the permanent free ice seawater to the seasonal ice covered area. From 60.5°S to 63.0°S, within the free seawater area, we observe small variations of pCO2sea and AT, in contrast to large temporal variations of CT.
The general trend of AT indicates stable concentrations around 2284.75 ± 7.15 μmol.kg-1 (Fig. 2a), associated with stable salinity around 33.88 ± 0.10 (Fig. 4a). The AT concentrations in surface seawater are linearly linked with those of salinity as observed by others over the sea surface ocean (Poisson & Chen Reference Poisson and Chen1987, Takahashi et al. Reference Takahashi, Olafsson, Goddard, Chipman and Sutherland1993, Millero et al. Reference Millero, Lee and Roche1998). CT concentrations increase southward slightly with large temporal variations (Fig. 2b). Concentrations are higher in spring (2166.69 ± 5.97 μmol.kg-1) than in summer (2132.35 ± 10.55 μmol.kg-1). As shown earlier (Weiss Reference Weiss1974, Goyet & Brewer Reference Goyet and Brewer1993, Takahashi et al. Reference Takahashi, Sutherland, Sweeney, Poisson, Metzl, Tilbrook, Bates, Wanninkhof, Feely, Sabine, Olafsson and Noijri2002, Ishii et al. Reference Ishii, Inoue and Matsueda2002) the temporal variations of CT were negatively correlated with SST (-1.22 ± 0.37°C in spring and 2.54 ± 0.77°C in summer; Fig. 4b).
The measurements show low pCO2sea around 367.13 ± 7.01 μatm (Fig. 5a) with negative ΔpCO2 down to -12.98 ± 6.76 μatm (Fig. 5b). The CO2 flux from the atmosphere to the ocean increases from spring (-2.86 ± 2.41 mmol.m-2.d-1) to summer (-12.92 ± 8.40 mmol.m-2.d-1; Fig. 6). The free-ice seawater area displays relatively small air-sea CO2 flux variations associated with small variation of mean chl a concentrations (0.22 ± 0.07 mg m-3 in spring and 0.21 ± 0.16 mg m-3 in summer; Fig. 7).
From 63°S to 65°S in the seasonal ice covered area, growth of ice in winter and the melting of ice in summer induce strong seasonal variations. In spring, AT concentrations decrease in the area between 62.61°S and 63.79°S (from 2289.4 to 2253.4 μmol.kg-1; Fig. 2a) associated with a salinity decrease (from 33.88 to 33.45; Fig. 4a). CT concentrations show large temporal variations (Fig. 2b). In spring, CT increases strongly southward from 2155.6 μmol.kg-1 to 2201.3 μmol.kg-1 corresponding to low SST (-1.71 ± 0.16°C; Fig. 4b). The lowest CT concentrations are observed in summer (2125.4 to 2159.4 μmol.kg-1) associated with high SST (1.35 ± 0.74°C).
In the southern part of the SIZ, pCO2 concentrations are high in spring (364.2–406.2 μatm) and strongly decrease in summer (361.9–322.9 μatm; Fig. 5a). Thus ΔpCO2 is positive in spring (+10.55 ± 8.97 μatm) and negative (-34.74 ± 11.56 μatm) in summer (Fig. 5b). The CO2 fluxes from the atmosphere to the ocean increase from spring (+1.61 ± 2.09 mmol.m-2.d-1) to summer (-18.59 ± 17.75 mmol.m-2.d-1; Fig. 6).
In spring, in the presence of ice, CO2 (CT) accumulates in seawater under the ice (Ishii et al. Reference Ishii, Inoue and Matsueda2002). In summer, after the ice has melted, the SIZ is a strong CO2 sink. The phytoplankton biomass is important in summer (Ishii et al. Reference Ishii, Inoue and Matsueda2002). The intense CO2 flux in summer corresponds with increased CO2 uptake and a significant increase in mean sea surface chl a concentrations from spring (0.21 ± 0.05 mg m-3) to summer (0.59 ± 0.32 mg m-3; Fig. 7).
Continental Antarctic Zone (CAZ; 66.0 ± 1°S)
The CAZ is covered by seasonal ice in spring and free of ice in summer. AT concentrations (Fig. 2a) increase southward in this zone. The highest concentrations are observed in spring (2305.9–2385.4 μmol.kg-1) around Antarctica. During seasonal cooling, the intensive vertical mixing brings deep waters rich in CaCO3 to the surface and thus increases surface AT (Volk & Hoffert Reference Volk and Hoffert1985). In summer, the AT concentrations are variable (2304.25 ± 33.35 μmol.kg-1) due to variable activity of marine biota which generally occurs with an increase in SST. CT concentrations are higher in spring (2184.0–2250.6 μmol.kg-1) than in summer (2127.3–2198.5 μmol.kg-1; Fig. 2b). During spring, CT concentrations are inversely correlated with SST (Fig. 4b), which limits in turn phytoplankton production (Lee et al. Reference Lee, Wanninkhof, Takahashi, Doney and Feely1998, Jabaud-Jan et al. Reference Jabaud-Jan, Metzl, Brunet, Poisson and Schauer2004). In summer, relatively high SST (-1.5 ≤ SST ≤ 0.5°C), high solar radiation, and melting of ice favour growth of phytoplankton (Fig. 7).
The CAZ is characterized by strong pCO2sea temporal variations (Fig. 5a). In spring 2005, the pCO2sea minimum (388.0 μatm) was centred at 65.07°S and the maximum (429.5 μatm) was detected near the DDU station (67°S). In summer 2006, pCO2sea concentrations decreased from 370.0 μatm to 316.1 μatm. The increase of mean water temperature from spring to summer (about 3°C) had a direct impact of increased phytoplankton growth in sea surface water and could explain the seasonal pCO2sea variations.
The CAZ is an important area for springtime CO2 accumulation below ice. The retreat of the ice edge would cause considerable outgassing of CO2 to the atmosphere associated with high wind speed enhancing air-sea exchange with a mean ΔpCO2 of +32.91 ± 7.78 μatm. In contrast, during summer this area is a strong CO2 sink with a mean ΔpCO2 of -37.41 ± 12.72 μatm (Fig. 5b). Thus, we observed large temporal variations of CO2 fluxes (Fig. 6). The CO2 fluxes decreased from spring (average of +14.9 ± 13.8 mmol.m-2.d-1) to summer (average of -12.3 ± 8.45 mmol.m-2.d-1; Fig. 6). The intense air to sea CO2 flux is associated with greater CO2 uptake by phytoplankton biomass correlated with increased of mean sea surface chl a concentrations from spring (0.17 ± 0.07 mg m-3) to summer (0.68 ± 0.43 mg m-3).
Relative importance of the temperature and biology effects
In order to assess the relative importance of the temperature and biological effects on the temporal variability of pCO2sea, we used the approach earlier published by Takahashi et al. (Reference Takahashi, Sutherland, Sweeney, Poisson, Metzl, Tilbrook, Bates, Wanninkhof, Feely, Sabine, Olafsson and Noijri2002).
In order to remove the temperature effect from the observed pCO2sea, the observed pCO2 values are normalized to a constant temperature, the mean annual temperature:

where T is the temperature in °C, and the subscripts “mean” and “obs” indicate the annual average and observed values, respectively.
The “net biology” effect on pCO2sea has been computed using the equation:

Where the subscripts “max” and “min” indicate the seasonal maximum and minimum values of pCO2sea at Tmean.
The effect of temperature changes on pCO2sea has been computed by perturbing the mean annual pCO2 with the difference between the mean and observed temperature Eq.
(3):

The “net temperature” effect on pCO2sea has been computed:

Where the subscripts “max” and “min” indicate the seasonal maximum and minimum values of pCO2sea at Tobs.
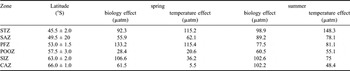
The relative importance of biological and temperature effects on pCO2 varies according to location (Table I). In general, the temperature effect dominates the biological effect in subtropical zone (STZ) increasing from 115.2 μatm in spring to 148.3 μatm in summer when the mean temperature rises from 11.45 ± 1.46°C to 13.70 ± 2.12°C, respectively. The biology effect intensifies southward, especially in the areas south of the Polar Frontal Zone (PFZ) from POOZ to the shelf areas of Antarctica (SIZ and CAZ). This confirms that the photosynthetic drawdown of CO2 in the Southern Ocean waters, as well as the shelf waters around Antarctica, plays an important role for the transport of atmospheric CO2 into the deep ocean (Takahashi et al. Reference Takahashi, Sutherland, Sweeney, Poisson, Metzl, Tilbrook, Bates, Wanninkhof, Feely, Sabine, Olafsson and Noijri2002). In mid-latitude areas, the dominant effect alternates between spring (temperature in SAZ and biology in PFZ) and summer (biology in SAZ and temperature in PFZ).
Regional effects of temperature and biology on distribution of pCO2sea along transects between Hobart and Dumont D’Urville from October 2005 to March 2006.

Comparison with previous observations
Interannual variations of CO2 fluxes were determined in the Southern Indian Ocean using data from MINERVE cruises in October 1996 and February 1997, October 2002 and February 2003 (Brévière et al. Reference Brévière, Metzl, Poisson and Tilbrook2006). Here we show results from the same area from October 2005 to February 2006. The mean of air-sea CO2 fluxes, sea surface temperature, sea surface salinity and chl a concentrations in the four different regions of the Southern Ocean along transects between Hobart and Dumont D’Urville are summarized in Table II.
Averaged air-sea CO2 fluxes, temperature and salinity in the four different regions of the Southern Ocean in October 1996 and February 1997, October 2002 and February 2003 (Brévière et al. Reference Brévière, Metzl, Poisson and Tilbrook2006), as well as our measurements in October 2005 and February 2006 along transects between Hobart and Dumont D’Urville.

In the sub-Antarctic region (SAR = STZ + SAZ + PFZ), the CO2 flux is always higher in summer than in spring. The mean CO2 flux increased slightly from February 1997 to 2003 (-12.3 mmol.m-2.d-1 to -13.6 mmol.m-2.d-1, respectively) and then decreased in February 2006 (-9.9 mmol.m-2.d-1). The mean temperature, salinity and chl a concentrations increased from February 1997 to 2003 (11.00°C to 11.10°C, 34.46 to 34.73 and 0.35 mg m-3 to 0.52 mg m-3 respectively) and then decreased in February 2006 (10.33°C, 34.36 and 0.27 mg m-3).
The CO2 flux in the POOZ displays contrasting interannual changes in February. The CO2 flux increases from -0.3 mmol.m-2.d-1 in February 1997 to -20.6 mmol.m-2.d-1 in February 2003 and decreases to -8.2 mmol.m-2.d-1 in February 2006. The mean of sea surface temperature and chl a concentrations increased from February 1997 to February 2003 (4.70°C to 5.20°C and 0.06 to 0.52 mg m-3 respectively) and decreased in February 2006 (4.45°C and 0.12 mg m-3 respectively). The mean salinity increased from February 1997 to February 2003 (33.64 to 33.73) and to February 2006 (33.84).
On average in the SIZ surface waters, the CO2 sink increases with time. The CO2 flux varies from -1.6 mmol.m-2.d-1 in February 1997 to +2.6 mmol.m-2.d-1 in February 2003 and to -10.9 mmol.m-2.d-1 in February 2006. The mean of temperature and chl a concentrations decreased from February 1997 to February 2003 (2.90°C to 2.27°C and 0.26 mg m-3 to 0.07 mg m-3, respectively) and increased to February 2006 (2.45°C and 0.21 mg m-3). The mean salinity increased from February 1997 to February 2003 (33.53 to 33.75) and to February 2006 (33.89).
In POOZ and SIZ, the interannual variations of CO2 flux are only associated with those of temperature and chl a concentrations.
In the CAZ, in October 2005 the mean CO2 flux is positive +14.9 mmol.m-2.d-1 and is associated with negative mean temperature (-1.77°C), low mean chl a concentrations (0.17 mg m-3) and high mean salinity (34.44). In contrast, the mean air to sea CO2 flux increases from February 1997 and 2003 (-3.1 mmol.m-2.d-1 and -4.7 mmol.m-2.d-1, respectively) to February 2006 (-8.4 mmol.m-2.d-1). The mean of temperature and salinity increased from February 1997 to 2003 (0.00°C to 0.32°C and 33.70 to 33.95 respectively) and decreased to February 2006 (-0.73°C and 33.91 respectively). The mean chl a concentrations increased from February 1997 and 2003 (0.31 mg m-3 and 0.44 mg m-3) to 2006 (0.68 mg m-3). Then in this zone, the interannual variations of CO2 flux are only associated with those of chl a concentrations.
Considerable seasonal and interannual variability is observed. The few data available do not allow us to determine a clear trend in the interannual evolution of the CO2 fluxes in these ocean areas. It is thus important to continue such time series measurements to quantify the temporal variations over a few decades.
Relationship of total alkalinity with salinity and temperature
A few years ago, Lee et al. (Reference Lee, Tong, Millero, Sabine, Dickson, Goyet, Oark, Wanninkhof, Feely and Key2006) indicated that in the Southern Ocean, in surface waters AT can be estimated by the following relationship as a function of temperature (SST) and salinity (SSS):

Their study indicates that this general relationship can be applied at all longitudes over the large latitudinal range 30°S–70°S, for SST < 20°C and 33 < SSS < 36.
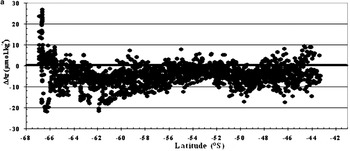
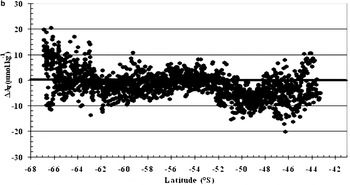
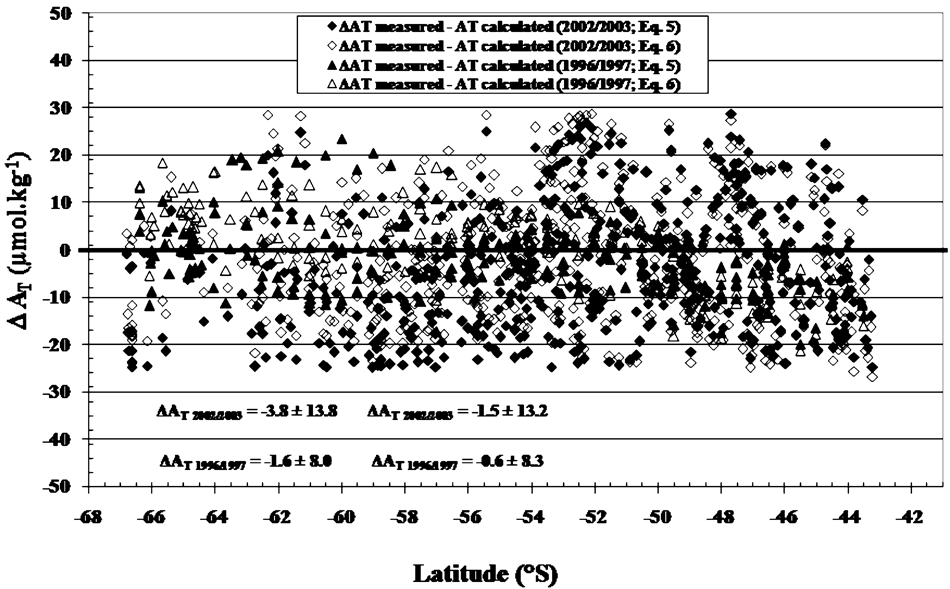
The mean difference ΔAT (measured - calculated with Eq.(5)) is -4.3 ± 5.5 μmol.kg-1 for both seasons (spring: from 18 October–8 November 2005 and summer: from 30 December 2005–26 January 2006 and from 17 February–2 March 2006; Fig. 8a). In high latitudes regions (63–67°S), we observed large variabilities (0.4 ± 9.2 μmol.kg-1 in spring and -5.2 ± 5.9 μmol.kg-1 in summer). These variations are mainly due to salinity changes by freshwater inputs through the melting of ice and are in part due to the increase in the convective mixing of deep waters rich in AT during seasonal cooling. Therefore, the increase of surface AT concentrations are correlated with input of CaCO3 rich deep waters to the upper layers.
a. Representation of ΔAT (AT measured - AT calculated from Eq.(5)) for both seasons (spring 2005 and summer 2006) along transects H–DDU and DDU–H. b. Representation of ΔAT (AT measured - AT calculated from the new equation; Eq.(6)) for both seasons (spring and summer) along transects from H–DDU and DDU–H.

b. Representation of ΔAT (AT measured - AT calculated from the new equation; Eq.(6)) for both seasons (spring and summer) along transects from H–DDU and DDU–H.

In order to describe more specifically the MINERVE datasets we developed a new simple AT relationship for both seasons (spring and summer). Using the software package TABLE CURVE™, these 2005–2006 data are best fitted with the following function involving the two properties SSS and SST:

This equation is valid only in the limited ocean area between Hobart (∼43°S ∼147°E) and Dumont D’Urville (∼67°S ∼140°E) with SST < 20°C, and 33 < SSS < 36.
The mean difference ΔAT (measured - calculated with Eq.(6)) is -1.7 ± 5.4 μmol.kg-1 (Fig. 8b). The two main differences between the model of Lee et al. (Reference Lee, Tong, Millero, Sabine, Dickson, Goyet, Oark, Wanninkhof, Feely and Key2006, Eq.(5)) and this new model (Eq.(6)) are: 1) the formulation of the function with second and first degrees, respectively, 2) Eq.(5) is general for the whole Southern Ocean and Eq.(6) is specific to the limited ocean area between Hobart and Dumont D’Urville.
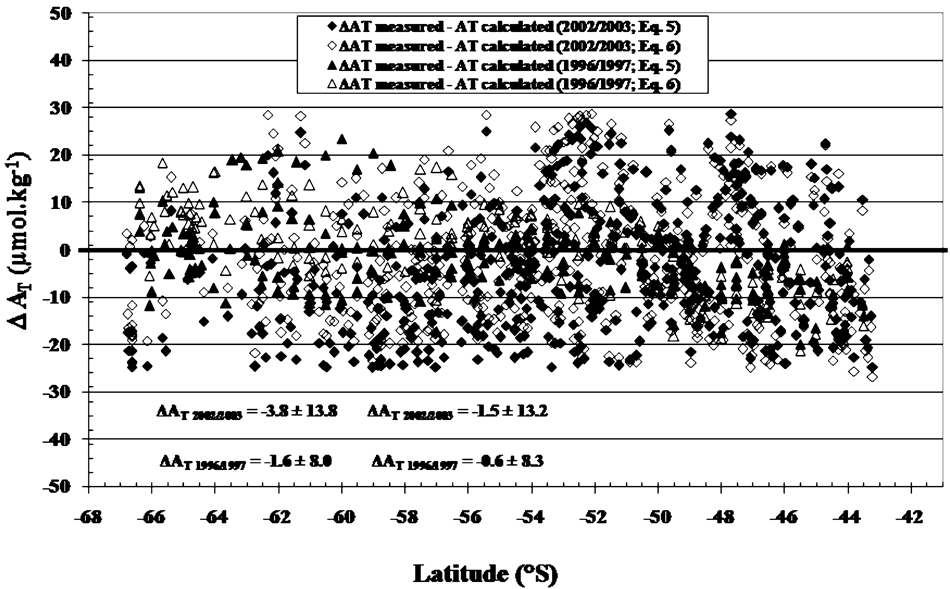
In order to further validate Eq.(6), we used the earlier 1996/1997 and 2002/2003 datasets from the same ocean area. Results indicate that the mean difference ΔAT1996/1997 (measured - calculated with Eq.(5)) is -1.6 ± 8.0 μmol.kg-1 (Fig. 9) and ΔAT1996/1997 (measured - calculated with Eq.(6)) 0.6 ± 8.3 μmol.kg-1. In 2002/2003, the ΔAT (measured - calculated with Eq.(5)) is -3.8 ± 13.4 μmol.kg-1 and ΔAT (measured - calculated with Eq.(6)) is -1.5 ± 13.2 μmol.kg-1 (Fig. 9). These results show greater variability in 2002/2003 than in 1996/1997. Nevertheless, these two earlier datasets confirm the validity of Eq.(6) for the limited ocean area between Hobart and Dumont D’Urville.
Relationship of total inorganic carbon with total alkalinity and temperature
In order to estimate CT variabilities in the Southern Ocean between Hobart and Dumont D’Urville, we also used the 2005/2006 dataset with the software package TABLE CURVE™ to develop a simple relationship to estimate CT as a function of AT and SST:

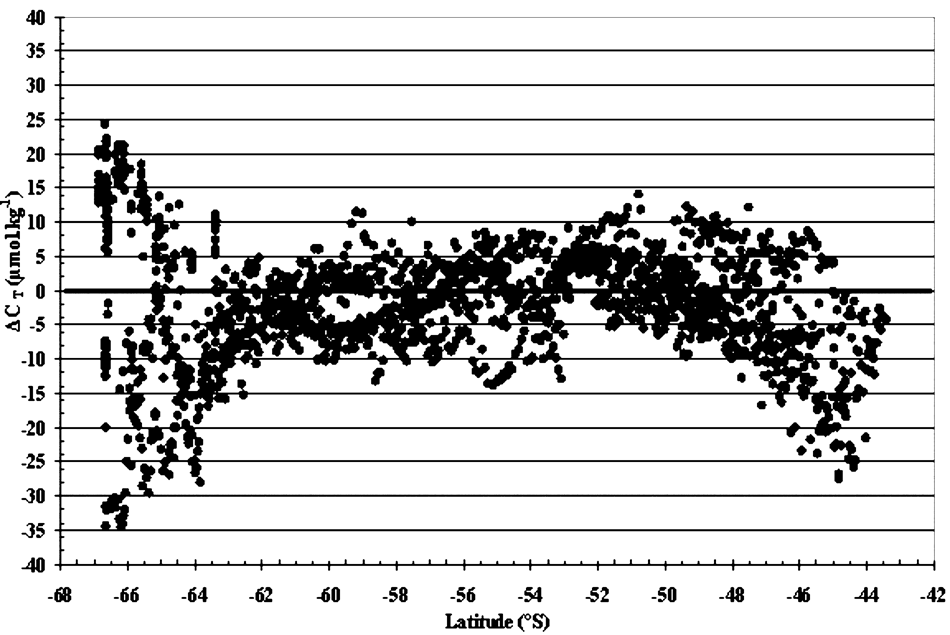
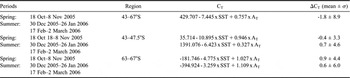
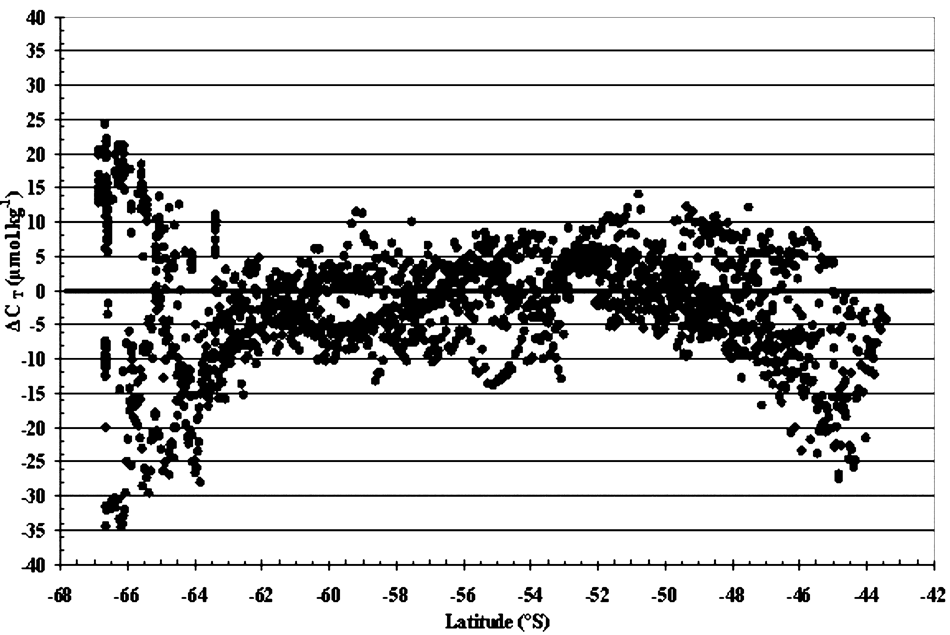
The mean difference of ΔCT (measured - calculated with Eq.7) is -1.8 ± 8.9 μmol.kg-1 for all data from October 2005–February 2006 (Fig. 10). We observed some variability at latitudes ranging from 43–47.5°S, with a mean ΔCT of -6.9 ± 8.6 μmol.kg-1 correlated with temporal variations of 0.8 ± 5.6 μmol.kg-1 in spring and -11.8 ± 6.3 μmol.kg-1 in summer. In addition, at high latitudes from 63–67°S, the highest variabilities (-2.6 ± 14.9 μmol.kg-1) are associated with highest temporal variations (10.1 ± 7.9 μmol.kg-1 in spring and -15.1 ± 8.0 μmol.kg-1 in summer). In order to improve the model accuracy, it could be best to formulate two equations for CT calculations: a specific equation for spring and another for summer for each of these two regions (43–47.5°S and 63–67°S, Table III).
Representation of ΔCT (CT measured - CT calculated from Eq.(7)) for both seasons (spring and summer) along transects H–DDU and DDU–H in 2005/2006.
Regional and temporal representations of surface total dissolved inorganic carbon (CT) calculated in the Southern Ocean south of Australia between Hobart and Dumont D’Urville (43–67°S).

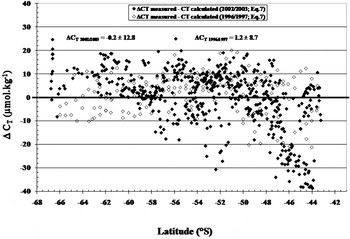
In order to validate this relationship (Eq.(7)), we used the 1996/1997 and 2002/2003 datasets. Similarly to ΔAT, the mean difference of ΔCT (measured - calculated with Eq.7) shows greater variability in 2002/2003 (-0.2 ± 12.8 μmol.kg-1) than in 1996/1997 (1.2 ± 8.7 μmol.kg-1; Fig. 11). Nevertheless, these results confirm the validity of Eq.(7) for the ocean area between Hobart and Dumont D’Urville.
Representation of ΔCT (CT measured - CT calculated from the equation Eq.(7)) for both seasons (spring and summer) along transects H–DDU and DDU–H in 1996/1997 and 2002/2003.

Concluding remarks
In this paper, we studied the temporal variability of air-sea CO2 fluxes in four main oceanic regions in the Southern Indian Ocean from 43.0–67.0°S between October 2005 and March 2006. The distributions of pCO2sea and CT were mainly associated with variations in SST and chl a concentrations. The variations of AT were directly associated with SSS and SST changes.
Temporal pCO2sea (spring–summer) measurements south of Tasmania indicate that the surface seawaters of the STZ and POOZ are stronger CO2 sinks in summer than in spring. The spring–summer cycle of CO2 fluxes in these zones (STZ and POOZ) exhibits a pattern noticed earlier south of Tasmania (Inoue & Ishii Reference Inoue and Ishii2005, Brévière et al. Reference Brévière, Metzl, Poisson and Tilbrook2006).
During both spring and summer, large variability in CO2 flux was observed in the SIZ and CAZ. Particularly, the presence of seasonal ice had a direct impact on pCO2sea with high CT concentrations below the ice in spring. The effect of biological CO2 uptake in summer had a larger effect than rising temperature after the retreat of the sea ice. Low pCO2 waters are formed by the juxtaposition of the cooling of warm waters with the biological drawdown of pCO2 in the nutrient rich subpolar waters. High wind speeds over these low pCO2 waters increase the ocean CO2 uptake rate.
The partial pressure pCO2 is calculated from the measured AT and CT using the software developed by Lewis & Wallace (Reference Lewis and Wallace1998) with the equilibrium constants for the dissociation of carbonic acid proposed by Mehrbach et al. (Reference Mehrbach, Culberson, Hawley and Pytkowicz1973), Goyet & Poisson (Reference Goyet and Poisson1989) and Roy et al. (Reference Roy, Roy, Vogel, Porter-Moore, Pearson and Good1993). In this ocean area, the calculated surface water pCO2 using the Goyet & Poisson (Reference Goyet and Poisson1989) constants provide the most accurate and precise results.
pCO2 calculated as a function of AT and CT can be used to estimate the spatio-temporal variations in the Southern Ocean south of Australia (43–67°S) where AT and CT are known.
Using the approach of Takahashi et al. (Reference Takahashi, Sutherland, Sweeney, Poisson, Metzl, Tilbrook, Bates, Wanninkhof, Feely, Sabine, Olafsson and Noijri2002) we assess the seasonal biology and temperature effects on pCO2sea in the different hydrographic regions along our transect between Hobart and Adélie Land. The effect of temperature is dominant in STZ, in contrast with POOZ, SIZ and CAZ where the seasonal variation of pCO2sea is entirely attributed to the biological utilization of CO2. In SAZ and PFZ, the seasonal amplitude of surface-water pCO2 at a given location is regulated by the biological utilization of CO2 and temperature.
The mean of air-sea CO2 fluxes, sea surface temperature, sea surface salinity and chl a concentrations in the four different regions of the Southern Ocean were compared with data from MINERVE cruises in October (1996, 2002 and 2005) and February (1997, 2003 and 2006). In the sub-Antarctic region (SAR = STZ + SAZ + PFZ), the interannual variations of the CO2 flux are associated with those of temperature, salinity and chl a concentrations. The interannual variations of CO2 flux in POOZ and SIZ are only associated with those of temperature and chl a concentrations. In the CAZ, the interannual variations of CO2 flux are only associated with those of chl a concentrations.
Furthermore, this work presents new equations suitable for studying the spatio-temporal variations of AT and CT using SST and SSS measurements in the surface waters of the Southern Ocean south of Australia. These new AT and CT equations are simple and accurate. They have been validated using all data available from 1996 to 2006.
These results clearly indicate that it is very important to continue such time series measurements in order to quantify the temporal variations over several decades and the impact on the Earth’s climate.
Acknowledgements
We would like to thank everyone who facilitated our work during the programme MINERVE, including the funding agencies IPEV, CNRS (through the PROOF and LEFE programmes), the crew of the RV Astrolabe, as well as our colleagues from CSIRO, LOCEAN and IMAGES laboratories.