


Introduction
Numerical models of weather, climate and sea ice typically use radiative-flux parameterizations that are based on the assumption that the underlying surface is homogeneous. Recent studies have shown that this assumption can result in errors in estimating surface radiation and turbulent fluxes because some atmospheric and surface properties are non-linear with respect to surface radiation fluxes (Reference MahrtMahrt, 1987; Reference SellersSellers, 1991; Reference FriedlFriedl, 1996). How large are the errors in radiative fluxes computed from area-average surface and cloud properties? The magnitude of the error depends on the degree of non-linearity in the relationship and on the spatial variability of the parameters. For example, the relationship between cloud optical depth and shortwave radiation is highly non-linear and the spatial variability of optical depth is often large. Conversely, surface albedo and shortwave radiation are linearly related and, except for the summer months, the surface albedo of sea ice is relatively homogeneous over large areas.
The purposes of this paper are to (a) assess the degree of spatial variability in the surface, cloud and radiative parameters over sea ice using satellite data, (b) evaluate the differences in radiative fluxes calculated from area-average surface and cloud properties vs averages of fluxes calculated at a relatively high spatial resolution, and (c) express the averaging error in terms of its effect on sea-ice thickness. The objective is to determine the importance of parameterizing sub-gridcell variability in sea-ice and climate models.
Formulation, Data and Methods
The instantaneous value of a surface radiation-flux quantity φ at a given point in space and time is a function of the atmospheric forcing 7 and surface properties to:

where f is a function describing the relationship between 0, 7 and to. For the purpose of this study, to includes surface forcing terms such as temperature, albedo and surface type, and 7 includes the atmospheric temperature and humidity profiles, cloud optical depth, cloud fraction, cloud temperature, cloud optical depth, incoming solar radiation at the top of the atmosphere, aerosol amount and ozone amount. The estimate of φ over an area A is then given by the integration of Equation (1):
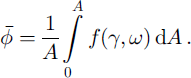
Since f is inherently micro-scale in nature and both 7 and w may vary in space and time, continuous expressions such as Equation (2) cannot be solved analytically. Unless the relationships between φ, γ and ω are linear,

where the overbar represents an average, i.e. the average flux over some area computed as in Equation (2) is not equal to the flux calculated from the average surface and cloud properties for that area. If three-dimensional effects are not considered, then  which can be calculated from data using a discrete form of Equation (2). We refer to this as the "pixel average". A similar concept, the "independent pixel approximation", has been used in studies of three-dimensional radiative transfer effects (cf Reference Marshak, Davis, Cahalan and WiscombeMarshak and others, 1998).
The pixel-average concept is employed here to show the magnitude of the inequality in Expression (3). Surface radiative fluxes were computed from satellite-derived surface and cloud properties on a 5 km pixel scale. These were then averaged over a 255 × 255 km2 area representing a climate-model gridcell. The average gridcell flux was also computed from the mean cloud and surface properties within the grid-cell. (The mean of the natural logarithm of cloud optical depth was used because of the exponential relationship between it and surface radiation.) We refer to this method as simply the "area average". These two gridcell averages correspond to the left and right sides, respectively, of Expression (3).
Semivariance analysis is employed to describe the spatial and temporal variability of the surface radiative fluxes, cloud and surface properties. The semivariogram is a structure function that, like autocorrelation, describes the correspondence between observations made at some distance or time lag. Therefore, a parameter measured at one location or time provides some information about the parameter at other locations or times. The semivariance r(h) is defined as:

The change in semivariance with lag illustrates how rapidly the autocorrelation changes, while the magnitude of the semivariance indicates the degree of variability. One characteristic value of the semivariogram is the "sill". The sill is the ordinate value at which the semivariogram reaches a maximum and becomes asymptotic, indicating that beyond the corresponding distance (time or space) the variance does not increase substantially.
Data from the Advanced Very High Resolution Radiometer (AVHRR), on board U.S. National Oceanic and Atmospheric Administration polar-orbiting satellites, are used in this study. The specific dataset is a product of the AVHRR Polar Pathfinder (APP) project (Reference Maslanik, Fowler, Key, Scambos, Hutchinson and EmeryMaslanik and others, 1997, Reference Maslanik, Lynch and Fowler1999, Reference Maslanik, Key, Fowler, Nguyen and Wang2000; W. N. Meier and others, 1997, http://earthinteractions.org). The APP data are twice-daily composites available at 5 km pixel size for June 1981−98. The study period (September 1997−August 1998) and the area (Fig. 1) encompass the Surface Heat Budget of the Arctic Ocean (SHEBA) field experiment, where an ice-breaker drifted with the pack ice for lyear (Reference Moritz, Curry, Thorndike and UntersteinerMoritz and others, 1993). The APP standard products are clear-sky surface temperature and broadband albedo, a cloud mask, sea-ice motion and the calibrated, geolocated channel data and viewing/illumination geometry. We have extended this product set to include the all-sky surface skin temperature and broadband albedo, cloud properties (particle phase, effective radius, optical depth, temperature and pressure) and radiative fluxes using algorithms in the Cloud and Surface Parameter Retrieval (CASPR) system (Reference KeyKey, 1999). The calculation of cloudy-sky surface skin temperature is based on an empirical relationship between the clear-sky surface skin temperature, wind speed and solar zenith angle (daytime). The cloudy-sky broadband surface albedo is determined using the clear-sky broadband albedo (interpolated from nearby pixels) adjusted by the cloud optical depth and the solar zenith angle. Radiative fluxes are computed in CASPR using FluxNet (Reference Key and SchweigerKey and Schweiger, 1998). See Reference KeyKey (1999) and references therein for more information on the algorithms and their validation.
The study area. the curve is the drift track oft sheba ship during the year-long experiment. it started at 75.70° n, 144.10° won 2 october 1997 and ended at 78.20° n, 160.70° won 3 august 1998.

Temporal and Spatial Variability
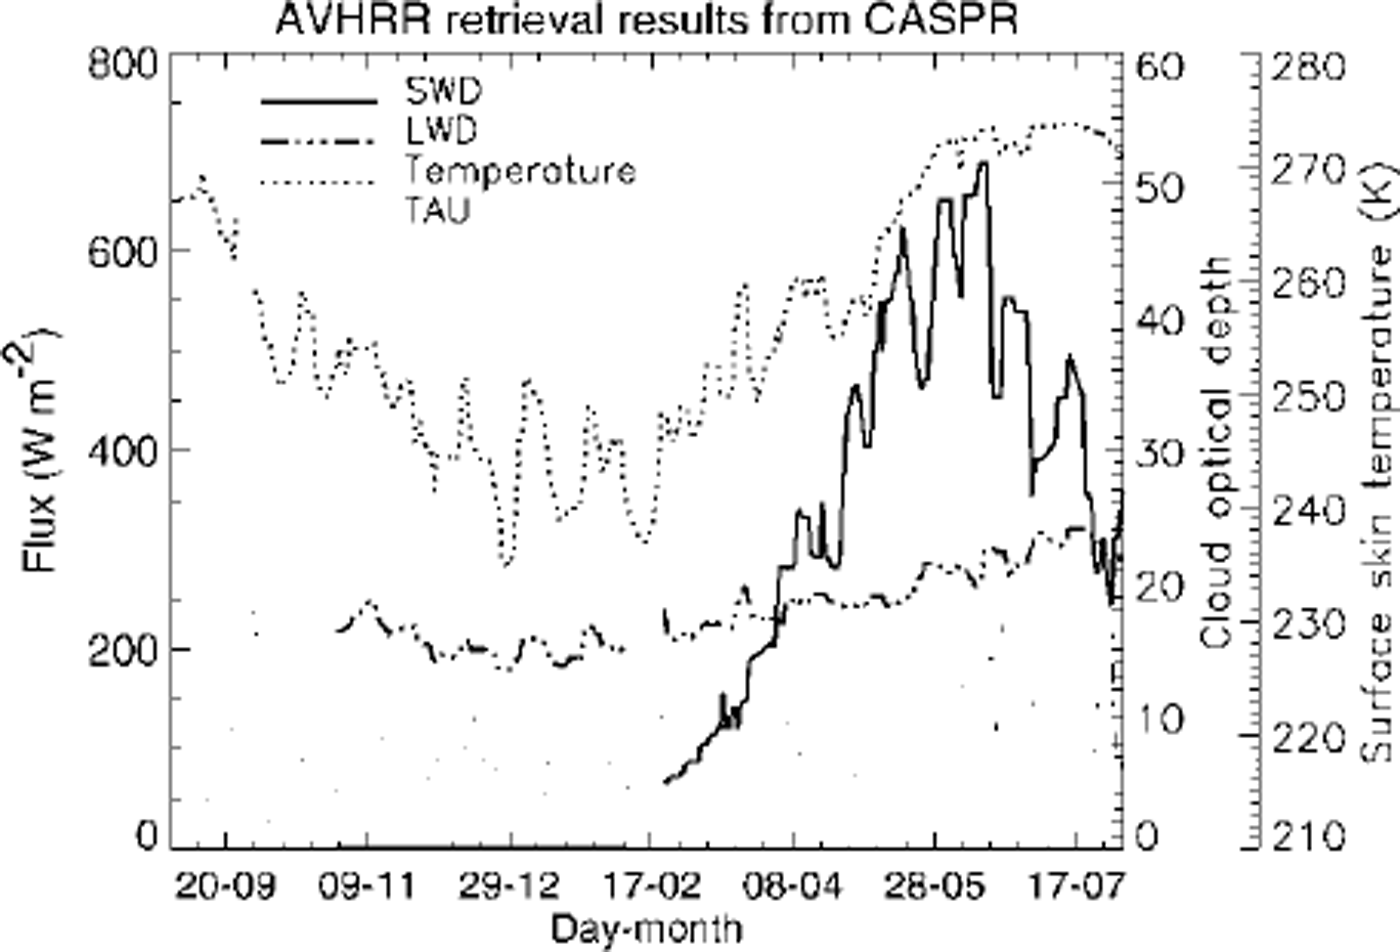
Figure 2 shows a time series of AVHRR retrievals for down-welling shortwave and longwave fluxes at the surface (SWD and LWD, respectively), cloud optical depth (TAU) and surface temperature around the SHEBA ship site. The results shown are averages over a 55 × 55 km2 area centered on the ship and smoothed with a 5 day running-mean filter. The temporal persistence of downwelling short- and longwave fluxes, net radiation flux (NET), cloud fraction, cloud optical depth, surface broadband albedo and surface skin temperature is illustrated as a semivariogram in Figure 3. The semivariance of each parameter was normalized by the maximum semivariance. For both downwelling shortwave and longwave fluxes the sill is reached after 180 days, implying strong temporal correlations. But for cloud fraction and cloud optical depth the persistence is weak, indicating that there is almost no temporal correlation. Another interesting feature is that the net radiation flux at the surface has a different range than that of downwelling short- and longwave fluxes, reaching the sill about after 220 days.
Time series oft downwelling shortwave (swd) and longwave (lwd) fluxes at the surface, cloud optical depth ( tau) and surface temperature. values are averages over an area of 55 x55 km2 centered on the sheba ship and smoothed with a 5 day running mean.
Tine-lag semivariogram for surface downwelling short- and longwave fluxes (swd and lwd), cloud optical depth (tau), cloud fraction, surface broadband albedo, surface skin temperature and net radiation at the surface. the semivariance of each parameter was normalized by the maximum semivariance.
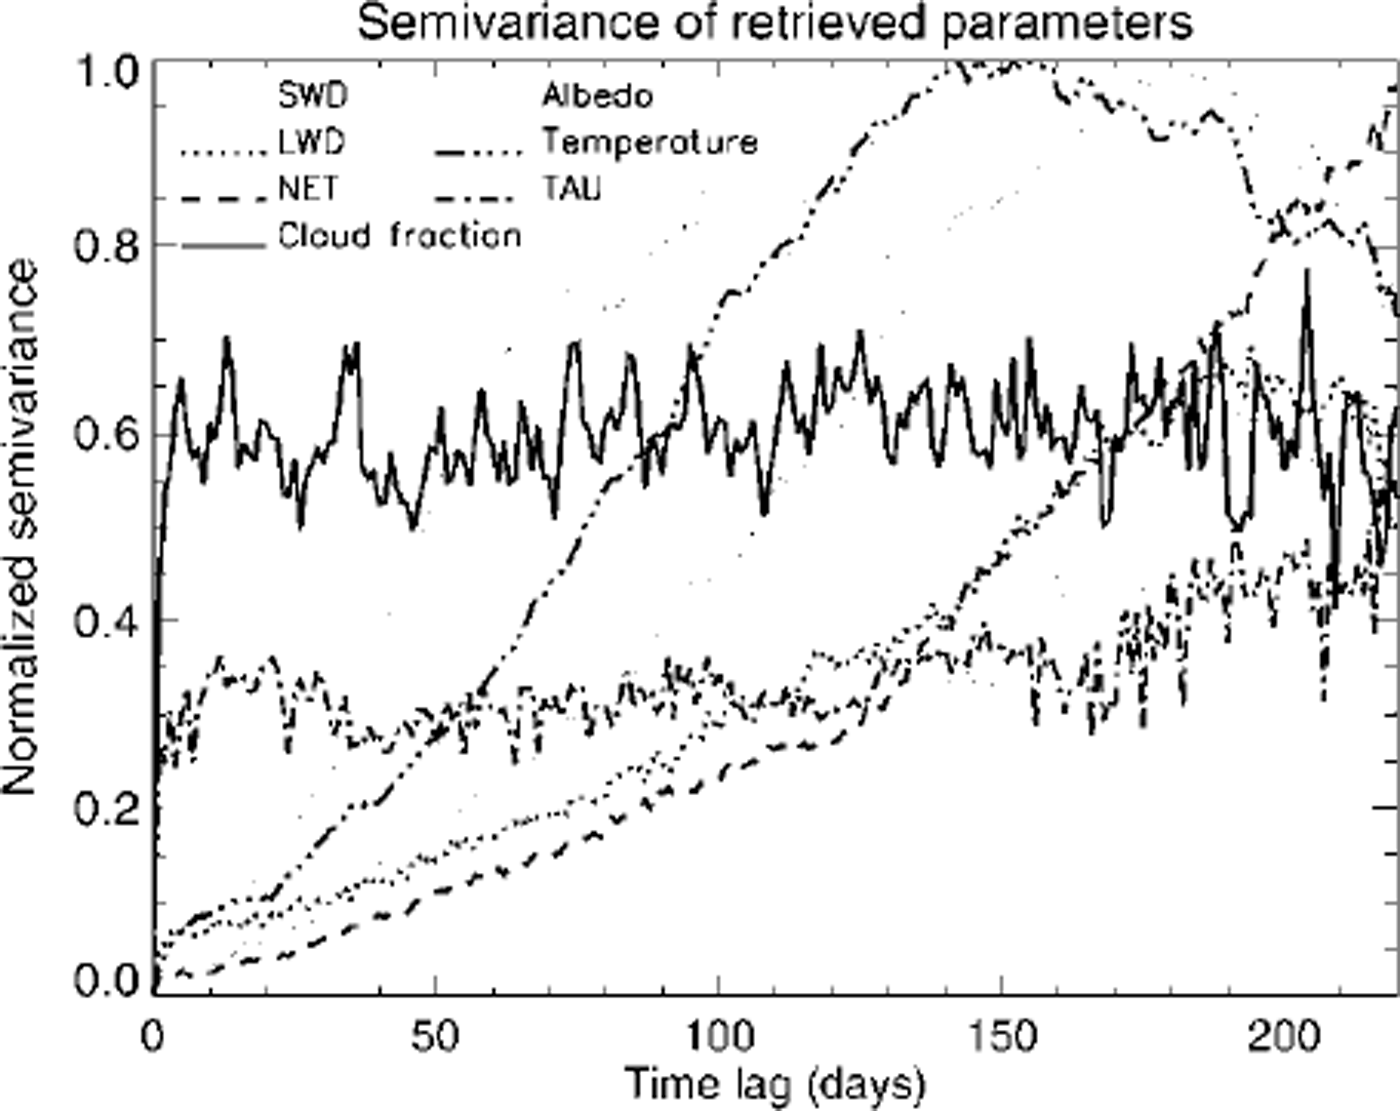
Figure 4 shows the spatial semivariogram of surface and cloud properties for June 1998, based on monthly mean values along the longitude 165° W. Cloud fraction is not shown because sub-pixel cloud fraction was not computed. As with the temporal semivariogram, radiative fluxes, surface skin temperature and surface broadband albedo show persistence with distance. Cloud particle effective radius and optical depth do not, indicating that clouds in this area and time are not horizontally homogeneous as is commonly assumed in sea-ice and climate models. The gradual increase in the normalized semivariance of surface skin temperature and broadband albedo relative to that of cloud optical depth and shortwave radiation implies that the spatial variance increases much less rapidly for surface properties than for cloud properties. An interesting feature of downwelling fluxes and surface albedo is that the semivariograms show sinusoidal wave patterns with spatial scale. Cloud optical depth also shows a similar wave pattern with spatial scale. This phenomenon may be related to synoptic-scale weather systems, at least in June over this part of the Arctic. When such patterns are present, spatial averaging must be done with care.
Space-lag semivariogram for surface downwelling short- and longwave fluxes (swd and lwd), cloud optical depth ( tau), cloud fraction, surface albedo, surface skin temperature, cloud effective radius, and net radiation flux at the surface. the semivariance of each parameter was normalized by the maximum semivariance. monthly means along longitude 165° w were used.

Area-Average and Pixel-Average Flux Bias
Given that (a) surface and cloud parameters exhibit spatial variability on scales less than that of a typical climate- or ice-model gridcell, (b) the magnitude of the variability differs for each parameter, and (c) the relationship between some parameters and surface radiation is non-linear, one would expect that radiative fluxes calculated using average surface and cloud properties over a gridcell would be different from the average of fluxes calculated at some arbitrarily small scale (high resolution) within the cell. In the terminology presented previously, the pixel average for a gridcell must be different from the area average. How different are they for radiative fluxes over sea ice?
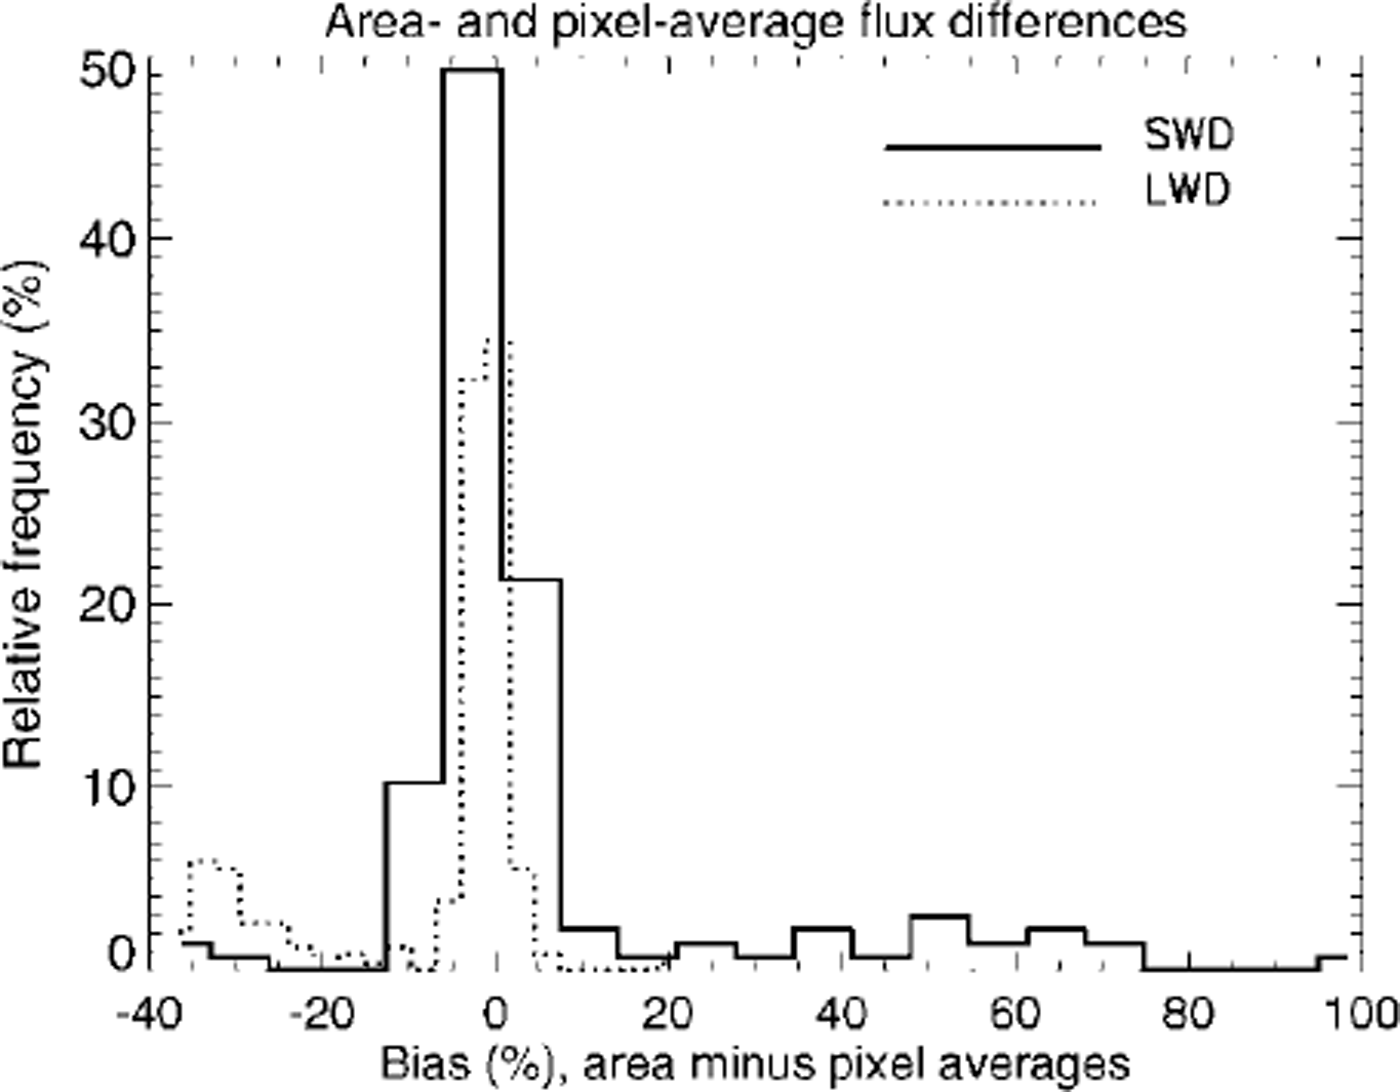
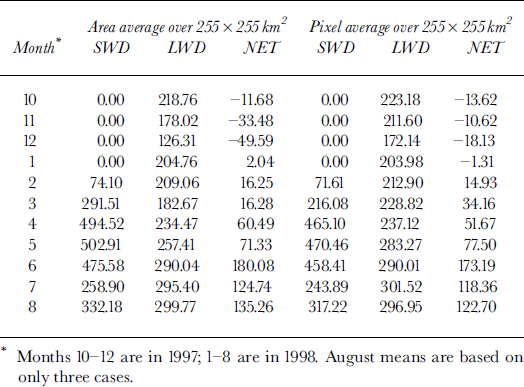
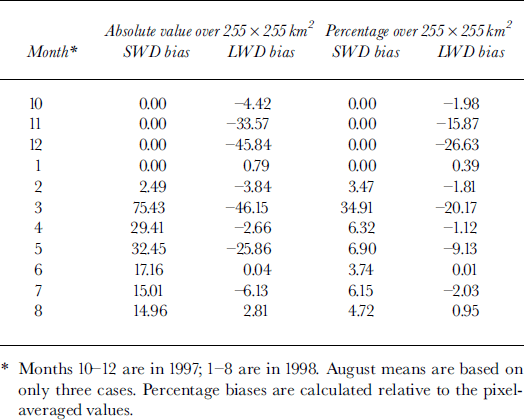
Monthly mean downwelling short- and longwave fluxes over 255 × 255 km2 are given in Table 1 for the two different averaging methods. Table 2 shows both the absolute value of the bias and the percentage bias, where bias is defined as the area-average flux minus the pixel-average flux. Figure 5 shows the frequency of the flux bias for downwellmg short- and longwave fluxes. Shortwave biases are generally positive, with a mean annual bias of 9.46%. Longwave flux biases are negative, with a mean annual bias of −7.04%. The largest monthly mean bias was nearly 35% in March 1998 for downwellmg shortwave flux, and −27% for the downwellmg longwave flux in December 1997.
Relative frequency of flux differences for the area-average and pixel-average flux computations. values shown are for the period september 1997−august 1998. downwelling short- and longwave radiation fluxes are denoted by swd and lwd, respectively
Monthly means of downwelling shortwave (swd), longwave (lwd) and net (net) radiation fluxes at the surface (wm−2)
Monthly mean bias of downwelling shortwave (swd) and longwave (lwd) radiation fluxes at the surface
The bias introduced by using area-averaged surface and cloud properties to compute surface fluxes can lead to over-or underestimates of latent heat, sensible heat and ultimately snow and ice thickness in models. Reference Ebert and CurryEbert and Curry (1993; hereafter EB93) evaluated the sensitivity of the equilibrium ice thickness in the Arctic to changes in surface and atmospheric parameters using a one-dimensional sea-ice model. They show that the equilibrium ice thickness changes from 4.3 m to 1.5 m for changes in the annual average downwelling shortwave flux of - 5% to +5%, where the baseline equilibrium ice thickness is approximately 3 m (EB93, fig. 15). In the context of the EB93 sensitivity study, our mean annual shortwave bias of 9.46% implies a decrease in the equilibrium ice thickness to approximately 0.5 m. Regarding the longwave flux bias, the mean annual value of −7.04% determined here would increase ice growth, and result in an equilibrium ice thickness of > 10 m based on the EB93 sensitivity results.
However, there are a number of reasons why the radiative-flux biases may have less impact on ice thickness than the comparisons to EB93 sensitivities imply First, EB93 show a nearly linear response of ice thickness to changes in the downwelling shortwave flux, but a highly non-linear response to the downwelling longwave flux. The two-dimensional dynamic-thermodynamic model used by Reference Maslanik and SilcoxMaslanik and Silcox (1993) exhibited a linear response of ice thickness to changes in the shortwave flux, but, unlike EP93, the response to the longwave flux was also linear. They speculate that the different response may be a result of including ice dynamics. Second, the short- and longwave annual flux biases are of opposite sign, and would therefore be offsetting to some degree. Third, flux biases during the freezing season may have a much smaller effect on ice thickness than similar biases in the summer. For example, if the downwelling longwave flux is increased during the winter, the upwelling long-wave and turbulent fluxes may respond such that there is only a modest decrease in ice growth. Conversely, during the summer melt season all of the excess energy would go directly into ice melting, resulting in a large impact on overall thickness (personal communication from G. Maykut, 2000). Fourth, the biases found here were less than the expected uncertainties in the satellite retrievals for some months. In such cases the method used to calculate area-average fluxes may not be important.
Conclusions
Satellite retrievals of surface, cloud and radiation parameters over sea ice were used to investigate the spatial and temporal variability of surface and atmospheric parameters in the western Arctic during the SHEBA experiment. Downwelling short- and longwave fluxes at the surface exhibit temporal correlation over a long time period (about 180 days), but cloud optical depth and cloud fraction have nearly no correlation over the time period. Radiative fluxes, surface skin temperature and surface broadband albedo also show persistence with distance, while cloud particle effective radius and optical depth do not. The spatial variance increases much less rapidly for surface properties than for cloud properties.
Given the spatial variability of surface and cloud parameters and, in some cases, their non-linear relationship with radiative fluxes, one would expect that using mean surface and cloud properties within a climate- or ice-model gridcell to compute radiative fluxes could result in substantial errors. This was investigated by computing average radiative fluxes for a 255 × 255 km2 gridcell as (a) the mean of fluxes calculated for every 5 km pixel, and (b) the result of using area-average mean surface and cloud properties in the flux calculation. As annual averages the mean shortwave flux bias was 9.46%, while the mean longwave flux bias was −7.04%. For the SHEBA case this indicates that using mean surface and cloud properties to compute surface radiative fluxes for a gridcell results in an overestimate of the downwelling shortwave flux and an underestimate of the downwelling longwave flux. In terms of ice growth and melt, sensitivity studies done by other investigators imply that the biases observed here may result in substantial errors in the modeled equilibrium ice thickness. Therefore, it is recommended that sub-gridcell inhomogeneity of surface and atmospheric properties be taken into account in sea-ice and climate models.
Acknowledgements
This research was supported by NASA grants NAG5-8625 and NAG5-6666 and U.S. National Science Foundation grant OPP-0096085. We thank C. Fowler, J. Maslanik, T Scambos and T. Haran for all their work on the APP dataset.



