1. INTRODUCTION
With the development of modern industry, many critical mechanical components such as crankshafts, vehicle axles, and propeller shafts are subjected to multiaxial fatigue loading during their service life. Multiaxial fatigue seems to be more complex than uniaxial fatigue because of the complex stress state, complicated loading history, and different orientations of the crack initiation. In recent decades, various multiaxial high-cycle fatigue criteria and their life prediction models, which can be divided into three main approaches, have been proposed. First, as the value of the second invariant of the stress deviator could be used to judge the plasticity or elasticity of the body (Johnson, Reference Johnson1973), Sines (Reference Sines, Sines and Waisman1959) proposed a criterion composed of the amplitude of the second invariant of the stress deviator and the amplitude of the hydrostatic stress. Crossland (Reference Crossland1956) also presented a criterion similar to Sines (Reference Sines, Sines and Waisman1959), which just used the maximum hydrostatic stress instead of the amplitude of the hydrostatic stress. However, these two criteria cannot predict the orientation of the crack initiation, and the predicted life under nonproportional loading is commonly nonconservative (Wang & Yao, Reference Wang and Yao2004). Second, some other researchers support the view that the orientation of the crack initiation always initiates on a particular plane, which is called the critical plane method (Findley, Reference Findley1959; Matake, Reference Matake1977; McDiarmid, Reference McDiarmid1987; Liu & Mahadevan, Reference Liu and Mahadevan2005, Reference Liu and Mahadevan2007; Ninic & Stark, Reference Ninic and Stark2007; Carpinteri et al., Reference Carpinteri, Spagnoli and Vantadori2009). For instance, Findley (Reference Findley1959) proposed that the crack parameters governing fatigue life were the amplitude of the shear stress and the maximum normal stress on the critical plane, which was called the maximum damage plane, whereas Matake (Reference Matake1977) used the same crack parameters and regarded the maximum shear stress amplitude plane as the critical plane. Both of the distinct critical planes are acceptable for multiaxial fatigue analysis on given conditions. Third, Papadopoulos (Reference Papadopoulos1994, Reference Papadopoulos2001; Papadopoulos et al., Reference Papadopoulos, Davoli, Gorta, Filippini and Bernasconi1997) proposed a new criterion called the mesoscopic approach consisting of the generalized shear stress amplitude and the maximum hydrostatic stress on the basis of Dang-Van's research (Reference Dang-Van, McDowell and Ellis1993; Van, Reference Van, Van and Papadopoulos1999; Van et al., Reference Van, Cailletaud, Flavenot, Le Douaron, Lieurade, Brown and Miller2013; Van & Griveau, Reference Van, Griveau, Brown and Miller2013). Generally, this criterion appears to be suitable for hard steel materials.
Most criteria actually treat fatigue from a deterministic point of view (Crossland, Reference Crossland1956; Findley, Reference Findley1959; Sines, Reference Sines, Sines and Waisman1959; Matake, Reference Matake1977; Dang-Van, Reference Dang-Van, McDowell and Ellis1993; Papadopoulos, Reference Papadopoulos1994; Papadopoulos et al., Reference Papadopoulos, Davoli, Gorta, Filippini and Bernasconi1997; Van, Reference Van, Van and Papadopoulos1999; Van et al., Reference Van, Cailletaud, Flavenot, Le Douaron, Lieurade, Brown and Miller2013; Van & Griveau, Reference Van, Griveau, Brown and Miller2013), which choose the appropriate damage parameters, such as uniaxial endurance limit and shear endurance limit, and convert the complex stress state into an equivalent stress through assumption and simplification to some extent. However, the equivalent stress is always just close to the fatigue strength rather than equal to it due to the influence of two kinds of uncertainties: material property uncertainty and the fuzziness of multiaxial fatigue criteria. In terms of the material property uncertainty, the probabilistic method is the best method if the fatigue data are sufficient. Otherwise, the uniaxial stress–life (S-N) curve is often imprecise, and its corresponding coefficients are usually inappropriate. In addition, the transformation process of a multiaxial stress state into an equivalent uniaxial stress state σeq is full of fuzziness due to subjective simplification and assumption. Deterministic a multiaxial fatigue criterion always implies that fatigue just has only two states: a perfect state and a failure state. Nevertheless, real fatigue phenomenon is a damage accumulation process, and there is a transition process from definitely perfect state to definitely failure state. When systems or components are in the transition process, the damage is fuzzy and difficult to calculate accurately. Commonly, the probabilistic method is used to analyze the uniaxial S-N curve. Based on the probability statistics of uniaxial fatigue strength S N, the multiaxial fatigue probalilistic S-N (P-S-N) is determined by calculating the probability of P(σeq < S N) (Flaceliere & Morel, Reference Flaceliere and Morel2004). However, the fuzziness of multiaxial criteria is ignored obviously.
This paper focuses on the fuzziness of multiaxial fatigue criteria and tries to acquire the fuzzy multiaxial fatigue strength for two criteria under a small sample condition. In addition, the fuzzy reliability analysis is conducted by regarding the multiaxial equivalent stress and multiaxial fatigue strength as a constant and a fuzzy variable, respectively. Finally, the fatigue data of two materials are used to evaluate and discuss the effectiveness of this method.
2. TRADITIONAL MULTIAXIAL FATIGUE CRITERION AND ITS LIFE PREDICTION
2.1. Matake criterion
The Matake criterion (Matake, Reference Matake1977) consists of the maximum shear stress amplitude C a(φ, θ) and the maximum normal stress N max(φc, θc) on the critical plane, which is regarded as the maximum shear stress amplitude plane. The orientation of the plane can be defined by the spherical coordinates (φ, θ), and (φc, θc) represents the direction of the critical plane:
 $$\lpar {{\rm \varphi}_{\rm c}\comma \, {\rm \theta}_{\rm c}} \rpar :\hbox{max}\lcub {C_{\rm a} \lpar {{\rm \varphi}\comma \, {\rm \theta}} \rpar} \rcub .$$
Once the critical plane has been found, the failure criterion can be created:
 $$C_{\rm a} \lpar {{\rm \varphi}_{\rm c}\comma \, {\rm \theta}_{\rm c}} \rpar + uN_{{\rm max}} \lpar {{\rm \varphi}_{\rm c}\comma \, {\rm \theta}_{\rm c}} \rpar \le {\rm \lambda\comma \,} $$
 $$u = \lpar {2T_{\rm e}} \rpar /S_{\rm e} - 1;{\rm \lambda} = T_{\rm e}\comma \, $$
where S e and T e are the uniaxial endurance limit and the shear endurance limit, respectively. According to Karolczuk and Macha (Reference Karolczuk and Macha2005), the life prediction model can be formed:
 $${\rm \tau} _{{\rm eq}} = C_{\rm a} \lpar {{\rm \varphi}_{\rm c}\comma \, {\rm \theta}_{\rm c}} \rpar + uN_{{\rm max}} \lpar {{\rm \varphi}_{\rm c}\comma \, {\rm \theta}_{\rm c}} \rpar = {\rm \tau} _f^{\prime} \lpar {2N} \rpar ^b\comma \, $$
where τeq is the equivalent shear stress, and τ′ f and b are the material constants of pure torsional fatigue S-N curve.
2.2. Papadopoulos criterion
The Papadopoulos criterion is composed of the generalized shear stress amplitude T
a, whose definition is illustrated in Papadopoulos (Reference Papadopoulos2001), on the critical plane and the maximum value of hydrostatic stress
 $\rm\sigma{_{H\comma \max}}$
:
 $$\max T_{\rm a} + {\rm \alpha \sigma} _{H\comma \,{\rm max}} \le T_{\rm e}\comma \, $$
 $${\rm \alpha} = 3\lpar {T_{\rm e} /S_{\rm e} - 0.5} \rpar \comma \,$$
where the maximum generalized shear stress amplitude plane is defined as the critical plane, and the life prediction model can be created:
 $${\rm \tau} _{\rm eq} = \displaystyle{{\max T_{\rm a} + {\rm \alpha \sigma} _{H\comma \,{\rm a}} \over 1 - \displaystyle{{3{\rm \alpha}} \over {T_{\rm e}}} {\rm \sigma} _{H\comma \,m}}} = {\rm \tau} _f^{\prime} \lpar {2N} \rpar ^b\comma \, $$
where σ H,a and σ H,m are the amplitude of the hydrostatic stress and the mean hydrostatic stress, respectively.
3. FUZZY LINEAR REGRESSION MODEL FOR MULTIAXIAL FATIGUE S-N EQUATION
3.1. The fuzzy multiaxial fatigue S-N equation
Similar to the uniaxial fatigue S-N curve, multiaxial fatigue equivalent S-N can also be given as in Eq. (4) and Eq. (7). The logarithm type of S-N can be written as follows:
 $$\hbox{ln}\, {\rm \tau} _{{\rm eq}} = {\rm \tau} _{f}^{\prime} - b\;\hbox{ln}(2N).$$
As mentioned above in Section 1, the fuzziness of multiaxial fatigue criteria is one of the main causes of uncertainties for multiaxial fatigue life prediction. Therefore, it is reasonable to build the multiaxial fatigue fuzzy S-N equation as follow according to Eq. (8):
 $$\tilde S_{{\rm eq}} = \tilde B_1 - \tilde B_2 X\comma \,$$
where X = ln(2N) and
 $\tilde S_{{\rm eq}} $
is the logarithm fuzzy multiaxial fatigue strength and
 $\tilde B_1 $
and
 $\tilde B_2 $
are the corresponding fuzzy material parameters. Under a small sample condition, the fuzzy regression coefficients
 $\tilde B_1 $
and
 $\tilde B_2 $
can be calculated and the corresponding fuzzy multiaxial fatigue strength can be determined.
3.2. Fuzzy linear regression model
In this paper, one classical fuzzy linear regression model proposed by Tanaka et al. (Reference Tanaka, Satoru and Asai1982) is used. It is defined that there is linear relationship between variables y and x 1, x 2 , … , x n, as follows:
 $$y = \tilde A_1 \,x_1 + \tilde A_2 \,x_2 + \tilde A_3 \,x_3 + \cdots + \tilde A_n \,x_{n\;}\comma \, $$
where x
1, x
2 , … , x
n are the input data and y is the output data, respectively.
 $\tilde A_1 $
,
 $\; \tilde A_2 $
, … ,
 $\tilde A_n $
are the fuzzy regression coefficients.
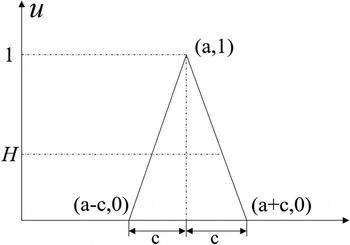
Fuzzy regression coefficient
 $\tilde A_n $
is usually defined as symmetrically triangular fuzzy number A
n
(a
n
, cn
) illustrated in Figure 1, and its membership function u
A
(z) can be given as
 $$u_{A_n} \lpar z \rpar = \left\{\matrix{\!\!1 - \displaystyle{\vert {z - a_n} \vert \over c_n}\comma \, \; \; a_n - c_n \le z \le a_n + c_n \cr \!0\comma \, \hbox{otherwise}} \right.\comma $$
where it means that the value of
 $\tilde{A}_n $
is approximate to a
n
, which is the mean value, and c
n
is the fuzzy range. After determining the fuzzy regression coefficients, the membership function of y can be calculated as with a small samples y
1, y
2 , … , y
m:
 $$u_y (y_i ) = \left\{\matrix{\!\!1 - \displaystyle{\vert y_i - \sum\nolimits_{\,j = 1}^n \,a_j x_{\,j\comma \,i}} \vert \over \sum\nolimits_{\,j = 1}^n \, c_j \vert x_{\,j\comma \,i} \vert, & \matrix{\sum_{\,j = 1}^n \,a_j x_{\,j\comma \,i} - \sum_{\,j = 1}^n \,c_j \vert x_{\,j\comma \,i} \vert \le y_i \le \hfill \cr \sum_{\,j = 1}^n \,a_j x_{\,j\comma \,i} + \sum_{\,j = 1}^n \,c_j \vert x_{\,j\comma \,i} \vert \hfill} \hfill \cr 0\comma \,\hfill &\hbox{otherwise}\hfill} \right..$$
The definition of symmetrically triangular fuzzy number for
 $\tilde A_n $
.

In order to calculate the mean value and fuzzy range, two other definitions are required.
Definition 1. The fuzzy ranges of all fuzzy coefficients should be minimum:
 $$\hbox{min}\,J{\rm} = {\rm} c_1 + c_2 + {\rm} \cdots {\rm} + c_n.$$
■
Definition 2. Under certain H confidence level, the membership of all data should be larger than H as shown in Figure 1:
 $$\; u_y \lpar {y_i} \rpar \ge H \quad 0 \le H \le 1.$$
■
By combining Eqs. (12–14), this solving process becomes a simple optimization problem, and its optimization algorithm is given as
 $$\left\{ {\matrix{ {\min J = c_1 + c_2 + \cdots + c_n} \cr {{\hbox{such that}}\; \; \mathop \sum \limits_{\,j = 1}^n a_j x_{\,j\comma \,i} - \lpar {1 - H} \rpar \mathop \sum \limits_{\,j = 1}^n c_j \vert {x_{\,j\comma \,i}} \vert \le y_i} \cr {\; \; \; \; \; \; \; \; \; \; \; \; \; \; \; \mathop \sum \limits_{\,j = 1}^n a_j x_{\,j\comma \,i} + \lpar {1 - H} \rpar \mathop \sum \limits_{\,j = 1}^n c_j \vert {x_{\,j\comma \,i}} \vert \ge y_i} \cr}} \right..$$
After this searching process, the finally optimal value of a n and c n can be found.
4. FUZZY RELIABILITY CALCULATION
After determining the fuzzy multiaxial fatigue strength, the corresponding fuzzy reliability can be conducted. It should be noticed here that this paper only focuses on the case that the stress is a constant σ and the strength is a fuzzy variable
 $\tilde S$
. Therefore, the fuzzy reliability can be conducted as P(σ
 $ \le \tilde S$
). Let us assume that the λ truncated subset of
 $\tilde S$
in the domain U:
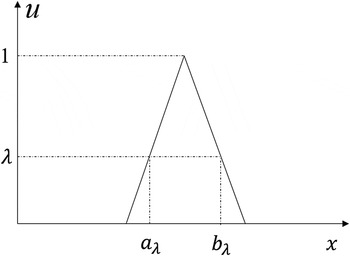
 $$\tilde S_{\rm \lambda} = \lcub {x{\rm \vert} x \in U\comma \,\; u_{\tilde S} \lpar x \rpar \ge {\rm \lambda}} \rcub \;\;\;\;{\rm \lambda} \in [0\comma \,1]. $$
The geometrical meaning of λ truncated subset is illustrated in Figure 2 and
 $\tilde S_{\rm \lambda} $
= [a
λ, b
λ]. Normally, this λ truncated subset
 $\tilde S_{\rm \lambda} $
can be considered as a random variable following uniform distribution
 $f_{\tilde {\rm \sigma}_{\lambda}} $
(Yuge, Reference Yuge2001). Hence, the fuzzy reliability R
λ of the fuzzy event σ
 $ \le \tilde S_{\rm \lambda} $
is
 $$R_{\rm \lambda} = P\lpar {{\rm \sigma } \le \tilde S_{\rm \lambda}} \rpar = \hbox{max}\left[ {\min \left( {\displaystyle{{b_{\rm \lambda} - {\rm \sigma}} \over {b_{\rm \lambda} - a_{\rm \lambda}}}} \right)\comma \ 0} \right].$$
The definition of λ truncated subset in domain U.

The fuzzy reliability R of the fuzzy event σ
 $ \le \tilde S$
finally can be given as
 $$R = P \lpar {{\rm \sigma } \le \tilde S} \rpar = \int\nolimits_0^1 R_{\rm \lambda} d{\rm \lambda} = \int\nolimits_0^1 \hbox{max}\left[ {\min \left( {\displaystyle{{b_{\rm \lambda} - {\rm \sigma}} \over {b_{\rm \lambda} - a_{\rm \lambda}}}} \right)\comma \,0} \right]d{\rm \lambda} {\rm.} $$
5. APPLICATION AND DISCUSSION
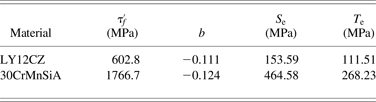
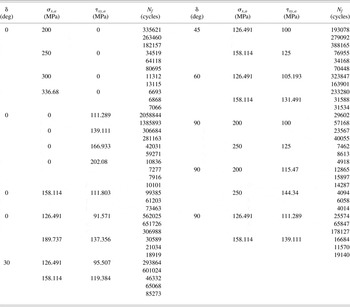
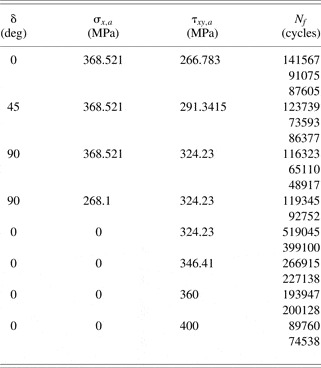
In this section, fatigue data of two materials, LY12CZ aluminum and 30CrMnSiA steel (Zhang, Reference Zhang2011; Zhang & Yao, Reference Zhang and Yao2011), are used, and the fuzzy reliability analysis based on the two criteria mentioned above is conducted. The fatigue properties of torsional S-N for two materials are described in Table 1, and the fatigue data of two materials, including proportional and nonproportional cases, are summarized in Table 2 and Table 3, respectively.
Fatigue properties of uniaxial S-N and shear S-N of two materials

Note: The data are according to Zhang (Reference Zhang2011).
Fatigue life of LY12CZ under different loading paths

Note: The data are according to Zhang (Reference Zhang2011).
Fatigue life of 30CrMnSiA under different loading paths

Note: The data are according to Zhang (Reference Zhang2011).
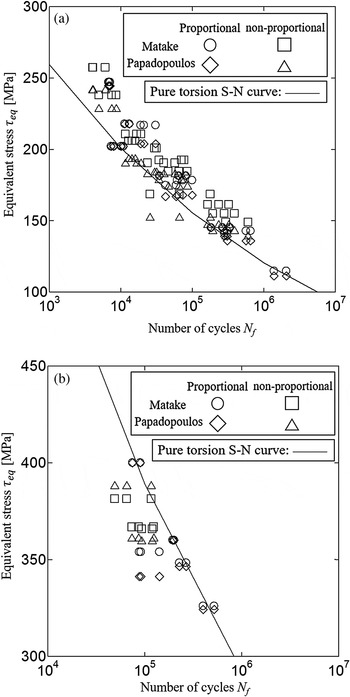
The prediction life for these two materials by using deterministic multiaxial fatigue criteria is depicted in Figure 3. It can be found clearly that the criteria have different prediction capabilities for LY12CZ and 30CrMnSiA. More specifically, both criteria can give conservative prediction for a majority of LY12CZ data, while almost all data in 30CrMnSiA fall below the pure torsional S-N curve meaning nonconservatively. Furthermore, the prediction with high precision can usually be conducted for proportional loading by using criteria as shown in Figure 3 for two materials, whereas multiaxial criteria generally overestimate the fatigue life of nonproportional case. This comparison mainly implies the existence of fuzziness in multiaxial fatigue criteria, which cannot be ignored even though the material dependence has already been considered in criteria to some extent.
The prediction capability of two criteria for (a) LY12CZ and (b) 30CrMnSiA.

Based on the fuzzy linear regression method and fatigue data in Table 2 and Table 3, the fuzzy regression coefficients
 $\tilde B_1 \lpar {b_1\comma \, c_1} \rpar $
and
 $\tilde B_2 \lpar {b_2\comma \, c_2} \rpar $
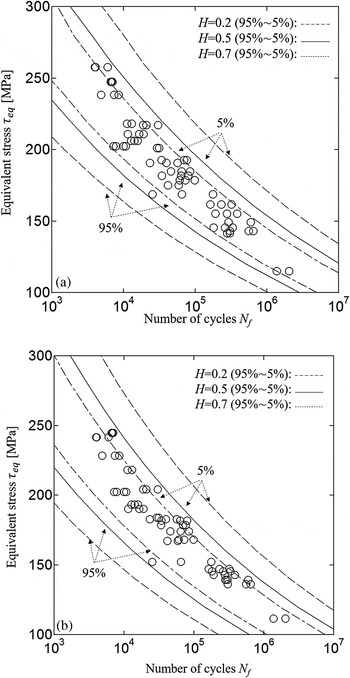
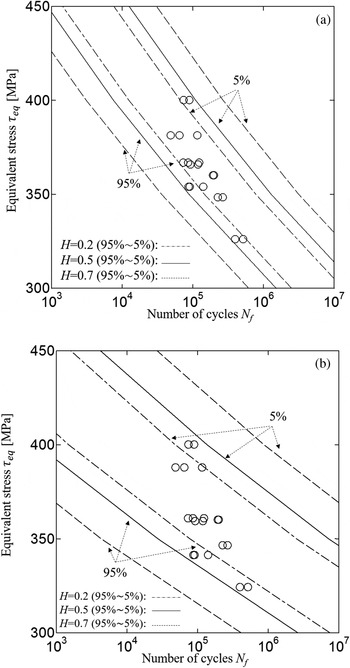
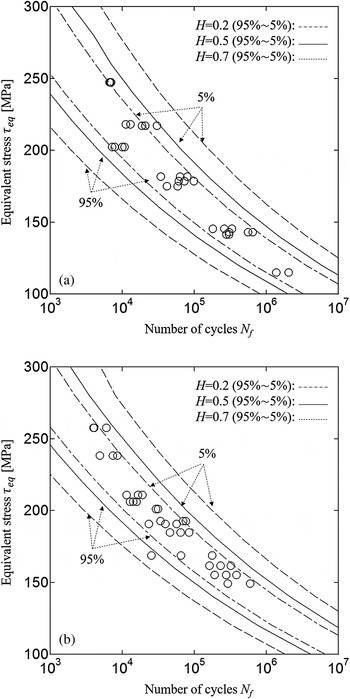
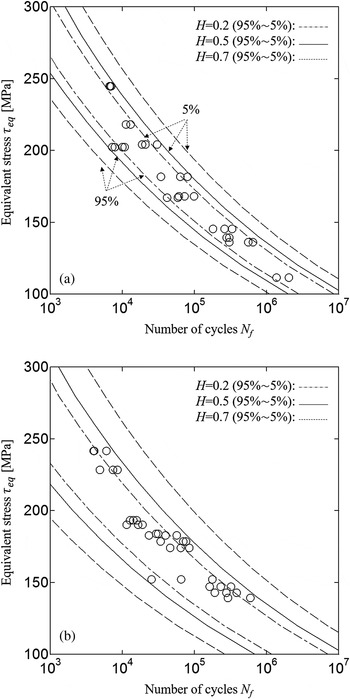
in Eq. (12) can be calculated, and the corresponding fuzzy multiaxial fatigue strength for two criteria can also be determined. Hence, the multiaxial fatigue fuzzy P-S-N curve for these two materials are revealed in Figure 4 and Figure 5 by using two criteria, respectively. In terms of Figure 4, although there is no large difference about the slope of 95% P-S-N and 5% P-S-N between these two criteria for a certain H confidence level, the P-S-N curve of the Papadopoulos criterion seems to be more conservative, namely, the fuzzy range of fuzzy multiaxial fatigue strength from the Papadopoulos criterion is larger than that of the Matake criterion at least for LY12CZ aluminum. Similarly, the P-S-N for 30CrMnSiA is also calculated in Figure 5. Obviously, the slope of P-S-N by using the Matake criterion is smaller than that by using the Papadopoulos criterion due to two main reasons. First, as mentioned above, the fatigue criterion has different prediction accuracy for different materials, which results in different fuzzy regression coefficients in Eq. (12). Second, the number of fatigue data plays another important role in the value of slope in the P-S-N curve. Furthermore, as can be seen from Figure 4 and Figure 5, three H confidence levels are selected. With the increase of H value, the interval between the 95% P-S-N and 5% P-S-N curves becomes larger, which means the prediction becomes safer. That is to say, how to choose an H value becomes a critical problem for fuzzy fatigue reliability. Because the use of fuzzy theory is subjective, the determination of the H value depends on the designers’ experience, the number of fatigue data, and so forth. Specifically, if the designer is much more familiar with the multiaxial fatigue criterion he chooses and the kind of material he uses or a large number of fatigue data exists, a relatively low H value can be selected. Otherwise, a relatively high H value is better in order to ensure the design safety. Moreover, although only a symmetrically triangular fuzzy number for a fuzzy regression coefficient, in this paper, is used as shown in Figure 1, other types of fuzzy numbers, such as asymmetrically triangular fuzzy numbers and quadric fuzzy numbers, can also be selected, which is also dependent on a designer's subjective choice.
The multiaxial fatigue fuzzy probabilistic stress–life curves of LY12CZ by using (a) Matake and (b) Papadopolous.

The multiaxial fatigue fuzzy probabilistic stress–life curves of 30CrMnSiA by using (a) Matake and (b) Papadopolous.

Finally, as multiaxial fatigue criteria can result in different prediction accuracies for proportional loading and nonproportional loading cases (Karolczuk & Macha, Reference Karolczuk and Macha2005), it is reasonable to carry the fuzzy reliability analysis separately. The corresponding figures by using two criteria with LY12CZ data are shown in Figure 6 and Figure 7. By comparing the P-S-N curve with proportional or nonproportional data, there is almost no difference in Figure 6 by using the Matake criterion, while notable difference exists if the Papadopoulos criterion is used. Consequently, before conducting the fuzzy multiaxial fatigue reliability analysis, a series of factors, such as the number of fatigue data, the loading condition of data, and the designers’ experience about the selected multiaxial fatigue criterion and used materials, should be considered. After that, an appropriate H confidence level can be selected and a multiaxial fatigue fuzzy P-S-N curve can be calculated.
The multiaxial fatigue fuzzy probabilistic stress–life curves of LY12CZ by using Matake criterion: (a) proportional data and (b) nonproportional data.

The multiaxial fatigue fuzzy probabilistic stress–life curves of LY12CZ by using Papadopolous criterion: (a) proportional data and (b) nonproportional data.

6. CONCLUSION
In this paper, the fuzziness of the multiaxial fatigue criterion is investigated and analyzed. The fuzzy theory is combined with the two traditional multiaxial fatigue criteria to build the multiaxial fatigue equivalent fuzzy S-N equation. The fuzzy linear regression method is used to determine the fuzzy regression coefficients in the multiaxial fatigue fuzzy S-N equation and finally calculate the fuzzy multiaxial fatigue strength. Moreover, the fuzzy reliability analysis is carried out for a certain case that stress is a constant and strength is a fuzzy variable, and corresponding 95% and 5% P-S-N curves are acquired. Finally, a large amount of fatigue data from two materials are used to evaluate this method, and it provides a series of fuzzy P-S-N curves with different H confidence levels to make reliability assessment for multiaxial fatigue under a small sample condition.
ACKNOWLEDGMENTS
This work is supported by the Major Program of the National Natural Science Foundation of China (Grant 51490662), the National Key Research and Development Project of China (Grant 2016YFD0701105), and the National Science Foundation of China (Grant 51605153).
Bochuan Li is a doctoral student at Kyushu University, where he is majoring in metal fatigue problems. He received his BS and MS degrees in mechanical engineering from Hunan University in 2011 and 2014, respectively.
Chao Jiang is a Professor in the College of Mechanical and Vehicle Engineering at Hunan University. He received his doctoral degree in mechanical engineering from Hunan University in 2007. Dr. Jian’s research interests include computational mechanics, vehicle design, and metal fatigue.
Xu Han is a Professor in the College of Mechanical and Vehicle Engineering at Hunan University. He received his doctoral degree in mechanical engineering from the National University of Singapore in 2001. Dr. Han's research interests include computational mechanics, computer-aided engineering design, and optimization.
Yuan Li is an Associate Professor at the National University of Defense Technology in Hunan. He received his doctoral degree in mechanical engineering from Hunan University in 2013. Dr. Li’s research field includes structural design for fatigue problems.