




No CrossRef data available.
Article contents
Use of micro-rotation imaging to study JNK-mediated cell survival in Theileria parva-infected B-lymphocytes
Published online by Cambridge University Press: 16 February 2005
Abstract
Lymphocytes infected with the protozoan parasite Theileria parva are transformed to permanently proliferating cells, an event underlying the pathology of the disease. However, the molecular signalling mediating this process is complex and poorly understood. Here, we show that down-regulation of JNK signalling by transient over expression of a dominant-negative mutant of JNK (JNK-APF) significantly increases Annexin-V-phycoerythrin (V-PE) labelling on infected B cell populations observed using flow cytometry. To establish whether this increase was specifically due to apoptosis, we used a novel single-cell imaging method: micro-rotation (MR)-imaging, designed to allow high-resolution 3-dimensional imaging of single cells in suspension. With this method we visualized subcellular patterns of V-PE uptake and chromatin organization in lymphocytes co-transfected with JNK-APF and GFP-tagged histone-H2B. This single-cell approach allowed us to clearly reveal characteristic apoptotic phenotypes, whose patterns reflected progressive states of programmed cell death due to JNK down-regulation. Our results strongly suggest a role for JNK in the survival of Theileria-infected B cells, and demonstrate the powerful utility of a new and unique 3-dimensional imaging method for living cells in suspension.
Information
- Type
- Research Article
- Information
- Copyright
- © 2005 Cambridge University Press
INTRODUCTION
Tropical Theileriosis and East Coast Fever are two tick-borne diseases of cattle caused by protozoan parasites of genus Theileria: T. parva and T. annulata, respectively. Both species can infect B cells, but T. parva has a pronounced tropism for T cells, whereas T. annulata prefers macrophages in infected animals from endemic regions. In all types of bovine leukocyte Theileria-infection induces changes that result in host cell transformation, promoting cell survival and uncontrolled proliferation (Dobbelaere & Rottenberg, 2003). The multi-nucleated macroschizont divides in phase with its host cell, thereby ensuring that the parasite population is increased (Irvin et al. 1983). While in vivo, parasite-induced leukocyte transformation eventually leads to formation of lesions that resemble multicentric lymphosarcoma; in vitro, Theileria-transformed leukocytes provide a useful paradigm to investigate the molecular basis of leukocyte transformation in general (Chaussepied & Langsley, 1996).
The presence within infected leukocytes of live intracellular parasites leads to a constitutive decrease in certain pro-apoptotic proteins (Guergnon et al. 2003a) and induction of a number of anti-apoptotic ones (Kuenzi, Schneider & Dobbelaere, 2003). This suggests that Theileria somehow alters the balance of these key regulators in favour of host-lymphocyte survival and one mechanism it employs is the permanent activation of the NF-κB signalling pathway (Heussler et al. 2002). We previously reported that a TNF-autocrine loop contributes to NF-κB activation, yet inhibition of TNF did not provoke apoptosis (Guergnon et al. 2003b). This suggests that death-receptor signalling per se is not manipulated by the parasite and consistently, upon drug-induced parasite death and host lymphocyte apoptosis one observes strong induction of only an intrinsic (caspase 9 to caspase 3) pathway of programmed host-cell death (Guergnon et al. 2003a). Evidently, this pathway does not signal a NF-κB-mediated anti-apoptotic response (Heussler et al. 2001). Furthermore, parasite-provoked constitutive PI3-K induction does not translate into an anti-apoptotic response, suggesting that activation of the Akt/PKB survival pathway is not involved in Theileria-induced leukocyte survival (Baumgartner et al. 2000; Heussler et al. 2001).
An alternative hypothesis is suggested from the observation that in Theileria-transformed B cells constitutive exclusion of Csk from Hck-positive membrane microdomains promotes proliferation and AP-1 induction via a PI3-K independent pathway (Baumgartner et al. 2003). Consistent with this view, we previously demonstrated that AP-1 induction and c-Jun phosphorylation is mediated exclusively by constitutive activation of the c-Jun N-terminal kinase (JNK) in Theileria-transformed leukocytes (Chaussepied et al. 1998). JNK is a stress-activated protein kinase (SAPK) and a member of the mitogen-activated protein kinase (MAPK) family, activated by multiple stress-related stimuli (e.g. cytokines, DNA-damaging agents and environmental stress) (Weston & Davis, 2002). It is known that JNK can directly phosphorylate and regulate the activity of paxillin (Huang et al. 2003), and members of the anti-apoptotic Bcl-2 family, as well as Mcl-1 (Inoshita et al. 2002). This diversity of kinase targets has led to an apparent contradiction whereby JNK signalling can regulate both pro-apoptotic and anti-apoptotic pathways (Ameyar et al. 2003), perhaps dependent on a balance determined by different stimuli and cellular contexts. As such the survival function of JNK activation in Theileria-induced leukocyte survival has proved difficult to demonstrate directly.
Our own studies on the function of JNK in infected B cell survival have used cell populations and were limited by the available experimental tools (e.g. transient transfection of infected lymphocytes followed by flow-cytometric analysis). This made it difficult to distinguish clearly the subtleties surrounding an effect of JNK suppression on apoptosis. This problem was particularly exacerbated by the fact that lymphocytes are non-adherent therefore precluding the use of single cell approaches, and especially subcellular visualization using high-resolution microscopic imaging that could give a clearer picture of apoptotic events in this paradigm. In the current study we have overcome this problem. Our experimental strategy used transient over-expression of a trans-dominant-negative mutant form of JNK (JNK-APF), together with GFP-tagged histone H2B (H2B-GFP) to reveal alterations in chromatin organization due to apoptosis. With this approach we visualized chromatin organization revealing patterns characteristic of apoptosis following transient suppression of JNK signalling in T. parva-infected B cells. This was made uniquely possible using a novel multi-dimensional imaging method for high-resolution 3-dimensional analysis of individual living cells in suspension: Micro-rotation (MR) imaging. Providing direct evidence that Theileria-dependent JNK activation contributes to survival of infected leukocytes and consequently also the pathology of this widespread bovine disease; our results also demonstrate the powerful utility of a new 3-dimensional imaging modality for visual analysis of intact living cells in suspension.
MATERIALS AND METHODS
Cells and cell culture
TpMD409.B2 is a T. parva muguga-infected B cell clone (B2) described elsewhere, and the characteristics of cell culture have been described previously (Moreau et al. 1999). All cell lines were cultured in RPMI-1640 supplemented with 10% fetal calf serum, 25 mM HEPES, 4 mM glutamine, 100 g/ml penicillin, 100 g/ml streptomycin, 10 μM mercaptoethanol at 37 °C with 5% CO2 in air.
Expression vectors
pcDNA3-Flag-JNK-APF (hereafter called JNK-APF) is a JNK1 phosphorylation mutant, where threonine and tyrosine residues (which can be phosphorylated by MKK4 and MKK7) have been replaced by alanine and phenylalanine (Tournier et al. 2001). The plasmid was a kind gift of Roger Davis. For expression of GFP-H2B the GFP expression vector tagging histones 2B was used as described previously (Kanda et al. 1998). The plasmid was a kind gift of Marie Chaussepied.
Cell transfection by electroporation
TpMD409 B2 cells were grown to approximately 0·5–0·7×106 cells/ml. Cells (1×10⁷ cells/ml) were centrifuged and re-suspended in serum-free RPMI containing 1 mM DTT, 1 mM D-glucose at room temperature. From this cell suspension a 0·5 ml aliquot (containing 5×10⁶ cells) was introduced into an electroporation cuvette (0·4 cm; Bio-Rad 1652088) and electroporated using a Bio-Rad Gene Pulser II (280 v; 500 μF; 2 pulses) in the presence of an appropriate concentration of DNA. Cells were kept in the electroporation cuvette for 15 min at room temperature and then re-suspended in 4·5 ml of pre-warmed RPMI (10% serum), transferred to a 6-well plate, and incubated at 37 °C with 5% CO2 in air for between 24 and 48 h.
Micro-rotation imaging of cells in suspension
After transfection cells were removed from culture at times between 24 and 48 h, centrifuged and re-suspended once into cold PBS, and then finally into 1 ml of Cytocon™ buffer II (Evotec Technologies, Germany), to give a final concentration of 3×10⁶ cells per ml. From this, a 5 μl aliquot (~150000 cells) was further diluted into 490 μl of Cytocon™ buffer II, containing 5 μl of Annexin-V-phycoerythrin (V-PE) (BD PharMingen). After 15 min of incubation on ice, in the dark, the cells were again centrifuged and then re-suspended in 500 μl of Cytocon™ buffer II, without Annexin, or added calcium. This cell suspension sample was then introduced into the micro-fluidics reservoir of our Cytocon™ 300 system (Evotec, Germany) and gently pulsed, using a syringe, into the computer-controlled micro-fluidics flow-line serving regulated perfusion through the Cell-Processor chip (DFC3, DFC4) at constant flow-rates between ~1 and 15 μl/h. Inside the cell-processor chip, cells were aligned into a single file using two in-line primary funnel electrode configurations. Following this the cells passed through a channel containing three in-line 3-dimensional cage electrode configurations of tip-to-tip dimensions of 20–40 μm. As cells passed through the centre of the flow channel, the cage-electrodes were alternately activated (manually) until individual cells were trapped, and then rotated.
For cell trapping in suspension, we used GFP fluorescence as a selective marker, and retained GFP-positive cells for visualization inside the activated electrode cages. Before micro-rotation imaging the micro-fluidic flow was minimized or stopped. Next, selected fluorescent cells trapped inside the dielectric cage apparatus, were induced into a rotation around the x, y-axes using a pre-defined rotation-mode protocol based upon differential electrode phasing in 3-dimensions. Invariably, this resulted in stable cell rotation through the z-axis, at speeds between 0·2–1 revolutions/s. Having induced stable and reproducible cell rotation, the wide-field conventional optics imaging system was activated to record images as quickly as possible (usually ~5–8 fps; with 20–100 ms exposure integration times) during continuous epi-fluorescent excitation illumination lasting just a few seconds. This way micro-rotation image-series were resolved at sufficient angular rotation steps (~15–30° rotation per frame) that the resulting micro-rotation movies comprised highly resolved 3-dimensional content.
Image acquisition and analysis
All MR-image series were collected using an Axiovert 200 M microscope (Carl Zeiss, Germany) equipped with epi-fluorescence illumination, filter-sets appropriate to FITC/TRITC/Cy3/Cy5, and a 100× NeoFluor 1·3 n.a. objective. An Orca-ER firewire camera (Hamamatsu, Japan) was used to acquire fluorescence images, and the hardware set-up (microscope and camera etc) was piloted using Compix-Simple-PCI (Hamamatsu, Japan). For 488 nm excitation, the imaging system yielded a calculated lateral (x,y) optical resolution of ~244 nm, and a theoretical depth of field (approximating z-axis resolution) of ~542 nm. For comparison the resolution at the camera defined as pixel size in the resulting image was ~129 nm (using 2×2 binning). GFP and V-PE fluorescent emission images were recorded using the appropriate filter-sets and, where stated, comparative estimates of specific fluorescence intensity from defined regions of interest were calculated as a function of background signal. Differences were assessed using the unpaired Student's t-test, and differences were considered statistically significant at P<0·05. All optical calculations used “Microscope Resolution Calculator Applet v1.0” freely available from our Web-site. http://www.pfid.org
Flow cytometry (FACS)
At 40 h following transfection 3×10⁵ cells were washed twice with cold PBS, and re-suspended in 100 μl of 1X binding buffer (Hepes/NaOH 10 mM pH 7·4; NaCl 140 mM and CaCl2 5 mM) with fluorescent (phycoerythrin conjugated) anti-Annexin V (V-PE; 0·5 μl/ml). After 15 min of incubation in the dark, 400 μl of 1X binding buffer was added. A total of 10000 cells were analysed for GFP and Annexin V staining using a Becton-Dickinson FACScan. The intensity relationship of GFP-H2B-positive to V-PE-positive cells was measured. As a positive control, 2×10⁵ cells (non-transfected Theileria-infected B cells) were irradiated (450 Rads/γ of caesium 137; Irradiateur IBL 637) 24 h before FACS analysis, and stained with V-PE. Flow cytometry results were assessed by one-way ANOVA paired Student's t-test. All differences were considered statistically significant when P<0·05.
RESULTS
JNK suppression increases V-PE uptake in T. parva-infected B cell populations
Theileria-infected B-lymphocytes were cultured in suspension and co-transfected by electroporation with plasmids coding H2B-GFP, and either dominant negative JNK (JNK-APF), or the pcDNA3 ‘empty’ vector. After 24–40 h intact living cells were then stained with anti-Annexin-V-phycoerythrin (V-PE) and analysed using fluorescence flow cytometry. With this approach we found that GFP signals were present in around 30% of the total cell population, which corresponds to the average transfection efficiency of T. parva-infected B cells. V-PE signals were detected exclusively in a subpopulation of the GFP-positive cells, implying that not all co-transfected lymphocytes displayed apoptosis. However, and importantly, the size of the V-PE-positive subpopulation was significantly (P<0·05) enhanced in samples transfected in the presence of JNK-APF (42·5±2·3%; n=5), compared with cells transfected in the presence of pcDNA3 (25·7±2·3%; n=5). This increased level of V-PE staining suggests that apoptosis was increased (~17%) by transient down-regulation of JNK signalling and is consistent with a survival role for JNK activation in Theileria-induced lymphocyte transformation. Accordingly, this evidently modest increase, combined with raised background levels of non-specific V-PE uptake due to electroporation, next brought us to examine the effects of JNK-APF induced apoptosis at the single cell level, in order to extract more precisely information coming only from those cells undergoing classical apoptosis.
MR-imaging reveals chromatin rearrangements accompanying apoptosis induced in T. parva-infected B cells
We used a novel imaging approach better suited to examine the precise qualitative (phenotypic) characteristics of V-PE labelling and gross chromatin organization in JNK-APF- and pcDNA3-transfected B cells. Thus, micro-rotation-imaging (MR-imaging) was applied in order to characterize changes in nuclear chromatin organization based on detection of H2B-GFP inside individual living Theileria-infected lymphocytes. This method allowed an ‘all viewpoints’ image series to be generated from single, suspended cells, such that 3-dimensional information concerning structures not readily visualized in a single focal plane were clearly observed. This approach provided the advantage that after review of the multiple viewpoint image series, representative images containing the pertinent information (that would necessarily have been missed using conventional imaging) were simply selected. For the MR-imaging system and Cell-Processor chips used for MR-imaging see Figs S1 and S2 in supplementary material.
In Theileria-infected lymphocytes, 24–48 h following transfection, MR-imaging revealed that cells co-transfected with H2B-GFP and pcDNA3 (empty vector control) strong green fluorescence was distributed diffusely throughout the cell nucleus indicating a ‘normal’ (non-apoptotic) chromatin organization (Fig. 1A; plus movie S1A). However, in cells co-transfected with JNK-APF, H2B-GFP fluorescence distribution was completely different: chromatin was densely compacted, and nuclei were reduced in size. In this context, MR-imaging gave remarkable insights, revealing additionally fine, straddling ‘loops’ of chromatin that were clearly captured from certain angles of view (Fig. 1B; plus movie S1B). This pattern of H2B-GFP resembled an apoptotic chromatin distribution, which was characteristic of JNK-APF co-transfected B cells, but not readily observed in controls where lymphocytes were transfected with pcDNA3.

Fig. 1. Changes in chromatin organization induced by transfection of JNK-APF dominant negative mutant in Theileria-infected B-cell. Two representative examples of transmission and fluorescence images recorded using MR-imaging 24 h following co-transfection of Theileria-infected cells with either: pcDNA3 and H2B-GFP (upper panels, A), or JNK-APF and H2B-GFP (lower panels, B). H2B-GFP fluorescence patterns are pseudo-coloured green, whereas annexin V-PE staining is pseudo-coloured in red. Scale bar is 5 μm. See also supplementary movies Fig. S1A and S1B.
Characterization of apoptosis in individual T. parva-infected B cells
At the single cell level subcellular compartmentalization of V-PE can reveal important information concerning the mode and stage of cell death occurring. In early apoptosis, V-PE staining is restricted to the outer surface of the plasma membrane by virtue of annexin-V's specificity for binding to phosphatidylserine residues exposed at the intact plasma membrane during apoptosis. However, when the plasma membrane becomes leaky, during late apoptosis, or cataclysmic cell death (like that caused by cellular damage), V-PE enters into the cytoplasmic compartment, where it stains internal membranes. In non-adherent living lymphocytes such distinctions can be difficult to establish using conventional 3-dimensional imaging approaches due to the uncertainty caused by movement of the target cell during axial acquisition. By contrast, MR-imaging allowed us to characterize these fluorescence patterns precisely, and without artefacts. We trapped individual fluorescently labelled B cells, and acquired 3-dimensional image series from them. Based on these results we measured the averaged relative intensity of V-PE staining for each individual cell, and sorted the image data accordingly (Fig. 2). This approach yielded a striking correlation: as a function of V-PE intensity (Fig. 2A) we observed 5 distinct phenotypic patterns of cellular chromatin organization and V-PE fluorescence (Fig. 2B). In phenotype 1 the H2B-GFP fluorescence was distributed across the nucleus in a diffuse patchy pattern, which occupied the majority of the cell volume, whereas V-PE stain intensities were weak, being only barely detectable above background levels. In phenotype 2, chromatin was still relatively diffuse except for the presence of a few conspicuous aggregates appearing as small, brightly green fluorescent points inside nuclei; correspondingly V-PE stain intensities were elevated, but nonetheless restricted to the plasma-membrane surface, excluded from the interior cytoplasmic compartment. In phenotype 3, we detected gross changes in chromatin distribution inside cell nuclei: H2B-GFP distribution was strongly aggregated into a body occupying a compacted volume, and V-PE stain intensity while still restricted to the plasma membrane, was further elevated. Phenotype 4 displayed a strong, heterogeneous V-PE labelling pattern that was evidently restricted to the plasma membrane surface when observed using MR-imaging (see supplementary movies S2). Correspondingly, nuclear chromatin was compacted, but was distinguished from phenotype 3 by the conspicuous presence of fine loops of DNA extending outwards from the nucleus, and probably due to chromatin tearing. Finally, phenotype 5 displayed patterns of V-PE staining that clearly corresponded to signal derived from inside the cytoplasmic compartment, presumably due to the total loss of plasma membrane integrity. Consistent with this view, the H2B-GFP fluorescence pattern indicated extreme disruption of chromatin organization, whereby heterogeneous signal was detected from throughout the cytoplasm.

Fig. 2. Characterization of apoptosis in individual Theileria parva-infected B cells. (A) Distribution of averaged fluorescence intensities measured for annexin V-PE staining in individual B cells transfected with JNK-APF and H2B-histone-GFP (note: intensity was measured as signal/background, and the results are shown sorted into ascending order). (B) Representative examples of the 5 phenotypes detected, which correspond to the ascending V-PE intensities shown in (A). For phenotype Ph4 see also supplementary movies Fig. S2. (C) The percentage of cells comprised from each of the 5 phenotypic patterns shown in (B), for B cells co-transfected with either H2B-GFP/pcDNA3 (solid black bars), or H2B-GFP/JNK-APF (grey-bars). Actual cell numbers are shown in parenthesis at the top of each bar. Note the complete absence of apoptotic phenotypes 3, 4 and 5 among pcDNA3-treated cells.

Fig. S1. MR-imaging system. The five image series shows the MR-imaging system used in these studies from several different angles of view. Panel A shows the fluorescence microscope on anti-vibration table beside the micro-fluidics pumps and image acquisition computer. Panel B is a close-up view of the microscope stage adapted for the cell processor chips DFC3/4 and micro-fluidics injection syringe (left) used for loading the cells into the perfusion system; whereas on the right hand side the small z-rotation adaptor can be seen connected to the chip via a relay cable. Panel C shows the high-precision pumps used to drive the micro-fluidics flow Panel D is a front-view to the microscope showing the position of the CCD camera (small box mounted on lower left side of microscope). Panel E shows the rack mounting of the micro-electrode amplifiers (top) connected to the Cell-Processor piloting computer (bottom) via a cable relay control box (middle).
Movie M1: MR-imaging of H2B-GFP labelling of chromatin inside individual livingTheileria-infected B-cells co-transfected with either pcDNA3, or JNK-APF. Movie 1A shows H2B-GFP fluorescence signal inside individual pcDNA3 co-transfected B cell. Note the diffuse labelling characterising a healthy, non-apoptotic nucleus.
Movie 1B shows H2B-GFP fluorescence signal inside individual B cell co-transfected with JNKN-APF. Note particularly the “added value” of motion-image visualization that allows us to clearly describe the three-dimensional structure of each nucleus. In this case the nucleus of the pcDNA3 transfected cell is shaped like a ring, containing a single deep infold; whereas the JNK-APF transfected cell nucleus shows a large straddling figure-of-eight chromatin loop characteristic of chromatin-tearing expected during apptosis.

Fig. S2. Cell-Processor chips used for MR-imaging. Images showing close-up views of the DFC3/4 type Cell-Processor chips used for MR-imaging. Panel A DFC3 and DFC4 Cell-Processor chips photographed next to a coin for scale (the chip dimensions are ~2·5 cm×7 cm). Panel B microscope panorama of electrode configuration in DFC chips, showing from left to right (the direction of flow): two “funnel” electrodes used to center the cell flow, and subsequently three “octode cages” used for cell trapping (panorama represents dimensions ~1cm width and 0·25 cm in height) Panel C close-up low-power microscope image showing photolithographic circuitry imprint to a single octode cage (top, image size is ~1 mm_); and transmission image of a single living Hela cell trapped at the center of an octode cage (bottom, image size is ~200 μm_). Panel D three-dimensional cartoon perspective indicating schema of octode cage (top); and table (bottom) showing basic command phase separations between AC current in each electrode that yield: vertical rotation, stable positioning, horizontal rotation, and alternative stable positioning respectively.
Movie M2: MR-imaging of H2B-GFP and annexin V-PE labelling inside an apoptoticTheileria-infected B-cell. The four image series movies show: transmission, H2B-GFP (green), annexin V-PE (red), and finally an approximate H2B-GFP/V-PE merged image series recorded by MR-imaging from an individual B cell co-transfected with JNK-APF, and consequently showing a phenotype 4 pattern. Note how the motion-image visualization reveals clearly that the V-PE signal is aggregated heterogeneously across the cell plasma membrane surface, delineating a shell of staining that evidently suggests its majority exclusion from the cytoplasm.
Based on our qualitative characterization of fluorescence patterns into 5 phenotypes, we compared the percentage number of each phenotype present from cells co-transfected with either JNK-APF, or pcDNA3 (Fig. 2C). With this approach we found that cells co-transfected with H2B-GFP+pcDNA3 comprised exclusively phenotypes 1 and 2 (non-apoptotic cells), whereas ~45% of cells co-transfected with H2B-GFP+JNK-APF displayed phenotypes characteristic of apoptosis (Ph. 3, 4 and 5). Accordingly, among JNK-APF expressing B cells the intensity of V-PE labelling averaged from the ph.3, 4 and 5 subgroups (2·31±0·17, 12 cells) was significantly (P<0·05; un-paired Student's t-test) higher than that averaged from phenotypes 1 and 2 (1·55±0·28, 7 cells). That phenotypes 3, 4 and 5 (apoptotic) dominated in the JNK-APF expressing B cells compared with an exclusive predominance of phenotypes 1 and 2 (non-apoptotic cells) in conditions using pcDNA3 control co-transfections, demonstrated unequivocally that suppression of JNK caused apoptosis in Theileria-infected lymphocytes.
DISCUSSION
MR-imaging is unique in its capacity to allow cells in suspension to be manipulated in a non-tactile manner in 3-dimensions. As such this technique makes possible stable, high-resolution, 3-dimensional imaging in non-adherent cells, and is especially useful for paradigms where the target cell type comprises only a small proportion of the total cell population. The utility of this method allowed an unprecedented view of H2B-GFP and V-PE signals inside individual, intact, infected B cells where only a small percentage of cells that were successfully transfected, displayed coordinated phenotypic characteristics of apoptosis. Infected cells were co-transfected with JNK-APF (a dominant negative mutant of JNK, that suppresses endogenous JNK signalling) and H2B-histone-GFP (to reveal chromatin organization). MR-imaging was performed on living cells during 24–48 h following transient transfection, and revealed that ~50% of cells were apoptotic, the remainder presenting non-apoptotic phenotypes. This is surprising given that flow cytometry in cell populations indicated the numbers of cells displaying V-PE staining was increased by only ~17% compared with controls. The reasons for these differences are undoubtedly multi-fold. In part this difference probably reflects the practical sensitivity of these two methods. For example, using micro-rotation imaging a large proportion (~30%) of cells that were defined as apoptotic according to their phenotypic pattern of H2B fluorescence did not display V-PE intensities of more than 2–3 times over background. Thus, the V-PE signal was, in our hands, a weak signal and given this low signal-to-noise ratio it is therefore, perhaps not too surprising that such a subtle effect (a modest 2-fold increase in the averaged V-PE fluorescence) exerted on less than 50% of cells at any given moment in time was poorly discriminated using flow cytometry. Second, as the selection of cells using MR-imaging relies upon their dielectric membrane properties that are likely compromised in cells having undergone a loss of membrane integrity, the selection process is implicitly biased towards cells in an early apoptotic state. In contrast, flow cytometry detects all fluorescent cells labelled with V-PE, including cells that have undergone non-specific loss of membrane integrity. Our novel multi-parameter single-cell imaging approach (MR-imaging) therefore excelled in detecting inside living cells early changes in apoptosis triggered by suppression of JNK signalling.
Theileria-induced transformation of bovine B cells is somewhat reminiscent of mice lymphomas generated by BCR-ABL infection, where it has been shown that JNK1 mediates an anti-apoptotic signal involving Bcl2 transcription (Hess et al. 2002). However, in Theileria-transformed B cells, where JNK1 signalling underlies AP-1 activation (Chaussepied et al. 1998) Bcl2 levels do not change following drug treatments that kill the parasite (Guergnon et al. 2003b). This contrasts with T. parva-infected CD8+ T cells (Guergnon et al. 2003a) and T. parva-infected CD4+ T cells (Keunzi et al. 2003), where we do observe a drop in Bcl2 levels upon apoptosis. Clearly, JNK has a plethora of possible targets depending on the cellular context and our preliminary data imply that Mcl1 and c-IAP, rather than Bcl2 might play a role in T. parva-infected B cells (data not shown), and c-IAP might be implicated in T. parva-infected CD4+ T cells (Kuenzi et al. 2003). In addition, JNK may directly phosphorylate a number of proteins including Bcl2 and Mcl1 thereby altering their activity independent of transcriptional changes (Inoshita et al. 2002). Thus, while the detailed molecular pathways remain to be elucidated, our results demonstrating the function of JNK signalling at the single-cell level open the way towards unravelling the complexities of this important pathological model.
PFID is supported by Institut Pasteur, Fondation pour la Recherche Medicale, La ministre deleguee a la recherche et aux nouvelles technologies, La Région Ile-de-France (programme SESAME), and the European Union (EAMNET). This work also received financial support from CNRS. R. L. is supported by a fellowship from the National Medicine Academy, and J. G. is supported by a fellowship from the French Ministry of Education (MRT). We thank Emmanuelle Perret and Mathieu Marchand for technical assistance, and Gabriel Gradl and Rolf Guenther for logistical support.
References
REFERENCES
AMEYAR, M.,
WISNIEWSKA, M. &
WEITZMAN, J. B. (
2003).
A role for AP-1 in apoptosis: the case for and against.
Biochimie
85,
747–752.CrossRefGoogle Scholar
BAUMGARTNER, M.,
CHAUSSEPIED, M.,
MOREAU, M. F.,
WERLING, D.,
DAVIS, W. C.,
GARCIA, A. &
LANGSLEY, G. (
2000).
Constitutive PI3-K activity is essential for proliferation, but not survival, of Theileria parva-transformed B cells.
Cellular Microbiology
2,
329–339.CrossRefGoogle Scholar
BAUMGARTNER, M.,
ANGELISOVA, P.,
SETTERBLAD, N.,
MOONEY, N.,
WERLING, D.,
HOREJSI, V. &
LANGSLEY, G. (
2003).
Constitutive exclusion of Csk from Hck-positive membrane microdomains permits Src kinase-dependent proliferation of Theileria-transformed B lymphocytes.
Blood
101,
1874–1881.CrossRefGoogle Scholar
BOTTERON, C. &
DOBBELAERE, D. (
1998).
AP-1 and ATF-2 are constitutively activated via the JNK pathway in Theileria parva-transformed T-cells.
BBRC
246,
418–421.Google Scholar
CHAUSSEPIED, M.,
LALLEMAND, D.,
MOREAU, M. F.,
ADAMSON, R.,
HALL, R. &
LANGSLEY, G. (
1998).
Upregulation of Jun and Fos family members and permanent JNK activity lead to constitutive AP-1 activation in Theileria-transformed leukocytes.
Mol Biochem Parasitol
94,
215–226.CrossRefGoogle Scholar
CHAUSSEPIED, M. &
LANGSLEY, G.
(
1996).
Theileria transformation of bovine leukocytes: a parasite model for the study of lymphoproliferation.
Res Immunol
147,
127–138.CrossRefGoogle Scholar
DOBBELAERE, D. A. &
ROTTENBERG, S. (
2003)
Theileria-induced leukocyte transformation.
Curr Opin Microbiol
6,
377–382.CrossRefGoogle Scholar
GUERGNON, J.,
DESSAUGE, F.,
LANGSLEY, G. &
GARCIA, A. (
2003 a).
Apoptosis of Theileria-infected lymphocytes induced upon parasite death involves activation of caspases 9 and 3.
Biochimie
85,
771–776.Google Scholar
GUERGNON, J.,
CHAUSSEPIED, M.,
SOPP, P.,
LIZUNDIA, R.,
MOREAU, M. F.,
BLUMEN, B.,
WERLING, D.,
HAWARD, C. J. &
LANGSLEY, G.
(
2003 b).
A tumour necrosis factor alpha autocrine loop contributes to proliferation and nuclear factor-kappaB activation of Theileria parva-transformed B cells.
Cell Microbiol
5,
709–716.Google Scholar
HESS, P.,
PIHAN, G.,
SAWYERS, C. L.,
FLAVELL, R. A. &
DAVIS, R. J. (
2002).
Survival signaling mediated by c-Jun NH(2)-terminal kinase in transformed B lymphoblasts.
Nat Genet.
32,
201–205.CrossRefGoogle Scholar
HEUSSLER, V. T.,
KUENZI, P.,
FRAGA, F.,
SCHWAB, R. A.,
HEMMINGS, B. A. &
DOBBELAERE, D. A. (
2001).
The Akt/PKB pathway is constitutively activated in Theileria- transformed leucocytes, but does not directly control constitutive NF- kappaB activation.
Cell Microbiol
3,
537–550.CrossRefGoogle Scholar
HEUSSLER, V. T.,
ROTTENBERG, S.,
SCHWAB, R.,
KUENZI, P.,
FERNANDEZ, P. C.,
McKELLAR, S.,
SHIELS, B.,
CHEN, Z. J.,
ORTH, K.,
WALLACH, D. &
DOBBELAERE, D. A. (
2002).
Hijacking of host cell IKK signalosomes by the transforming parasite Theileria.
Science
298,
1033–1036.CrossRefGoogle Scholar
HUANG, C.,
RAJFUR, Z.,
BORCHERS, C.,
SCHALLER, M. D. &
JACOBSON, K. (
2003).
JNK phosphorylates paxillin and regulates cell migration.
Nature, London
424,
219–223.CrossRefGoogle Scholar
INOSHITA, S.,
TAKEDA, K.,
HATAI, T.,
TERADA, Y.,
SANO, M.,
HATA, J.,
UMEZAWA, A. &
ICHIJO, H. (
2002).
Phosphorylation and inactivation of myeloid cell leukemia 1 by JNK in response to oxidative stress.
J Biol Chem
277,
43730–43734.CrossRefGoogle Scholar
IRVIN, A. D.,
DOBBELAERE, D. A.,
MWAMACHI, D. M.,
MINAMI, T.,
SPOONER, P. R. &
OCAMA, J. G. (
1983).
Immunisation against East Coast fever: correlation between monoclonal antibody profiles of Theileria parva stocks and cross immunity in vivo.
Res. Vet. Sci.
35,
341–346.Google Scholar
KANDA, T.,
SULLIVAN, K. F. &
WAHL, G. M. (
1998)
Histone-GFP fusion protein enables sensitive analysis of chromosome dynamics in living mammalian cells.
Curr Biol
8,
377–385.CrossRefGoogle Scholar
KUENZI, P.,
SCHNEIDER, P. &
DOBBELAERE, D. A. (
2003)
Theileria parva-transformed T cells show enhanced resistance to Fas/Fas ligand-induced apoptosis.
J Immunol
171,
1224–1231.CrossRefGoogle Scholar
MOREAU, M.-F.,
THIBAUT, J.-L.,
BEN MILED, L.,
CHAUSSEPIED, M.,
BAUMGARTNER, M.,
DAVIS, W. C.,
MINOPRIO, P.,
LANGSLEY, G. (
1999).
Theileria annulata and CD5-positive macrophages and B1 cells.
Inf Immunity
67,
6678–6682.Google Scholar
TOURNIER, C.,
DONG, C.,
TURNER, T. K.,
JONES, S. N.,
FLAVELL, R. A. &
DAVIS, R. J. (
2001).
MKK7 is an essential component of the JNK signal transduction pathway activated by proinflammatory cytokines.
Genes Dev
15,
1419–1426.CrossRefGoogle Scholar
WESTON, C. R. &
DAVIS, R. J. (
2002).
The JNK signal transduction pathway.
Curr Opin Genet Dev
12,
14–21.CrossRefGoogle Scholar
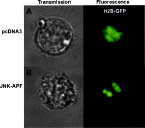
Fig. 1. Changes in chromatin organization induced by transfection of JNK-APF dominant negative mutant in Theileria-infected B-cell. Two representative examples of transmission and fluorescence images recorded using MR-imaging 24 h following co-transfection of Theileria-infected cells with either: pcDNA3 and H2B-GFP (upper panels, A), or JNK-APF and H2B-GFP (lower panels, B). H2B-GFP fluorescence patterns are pseudo-coloured green, whereas annexin V-PE staining is pseudo-coloured in red. Scale bar is 5 μm. See also supplementary movies Fig. S1A and S1B.
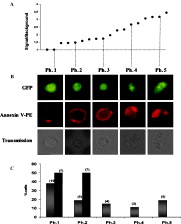
Fig. 2. Characterization of apoptosis in individual Theileria parva-infected B cells. (A) Distribution of averaged fluorescence intensities measured for annexin V-PE staining in individual B cells transfected with JNK-APF and H2B-histone-GFP (note: intensity was measured as signal/background, and the results are shown sorted into ascending order). (B) Representative examples of the 5 phenotypes detected, which correspond to the ascending V-PE intensities shown in (A). For phenotype Ph4 see also supplementary movies Fig. S2. (C) The percentage of cells comprised from each of the 5 phenotypic patterns shown in (B), for B cells co-transfected with either H2B-GFP/pcDNA3 (solid black bars), or H2B-GFP/JNK-APF (grey-bars). Actual cell numbers are shown in parenthesis at the top of each bar. Note the complete absence of apoptotic phenotypes 3, 4 and 5 among pcDNA3-treated cells.
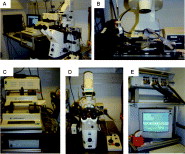
Fig. S1. MR-imaging system. The five image series shows the MR-imaging system used in these studies from several different angles of view. Panel A shows the fluorescence microscope on anti-vibration table beside the micro-fluidics pumps and image acquisition computer. Panel B is a close-up view of the microscope stage adapted for the cell processor chips DFC3/4 and micro-fluidics injection syringe (left) used for loading the cells into the perfusion system; whereas on the right hand side the small z-rotation adaptor can be seen connected to the chip via a relay cable. Panel C shows the high-precision pumps used to drive the micro-fluidics flow Panel D is a front-view to the microscope showing the position of the CCD camera (small box mounted on lower left side of microscope). Panel E shows the rack mounting of the micro-electrode amplifiers (top) connected to the Cell-Processor piloting computer (bottom) via a cable relay control box (middle).Movie M1: MR-imaging of H2B-GFP labelling of chromatin inside individual livingTheileria-infected B-cells co-transfected with either pcDNA3, or JNK-APF. Movie 1A shows H2B-GFP fluorescence signal inside individual pcDNA3 co-transfected B cell. Note the diffuse labelling characterising a healthy, non-apoptotic nucleus.Movie 1B shows H2B-GFP fluorescence signal inside individual B cell co-transfected with JNKN-APF. Note particularly the “added value” of motion-image visualization that allows us to clearly describe the three-dimensional structure of each nucleus. In this case the nucleus of the pcDNA3 transfected cell is shaped like a ring, containing a single deep infold; whereas the JNK-APF transfected cell nucleus shows a large straddling figure-of-eight chromatin loop characteristic of chromatin-tearing expected during apptosis.
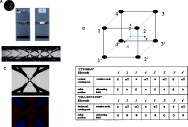
Fig. S2. Cell-Processor chips used for MR-imaging. Images showing close-up views of the DFC3/4 type Cell-Processor chips used for MR-imaging. Panel A DFC3 and DFC4 Cell-Processor chips photographed next to a coin for scale (the chip dimensions are ~2·5 cm×7 cm). Panel B microscope panorama of electrode configuration in DFC chips, showing from left to right (the direction of flow): two “funnel” electrodes used to center the cell flow, and subsequently three “octode cages” used for cell trapping (panorama represents dimensions ~1cm width and 0·25 cm in height) Panel C close-up low-power microscope image showing photolithographic circuitry imprint to a single octode cage (top, image size is ~1 mm_); and transmission image of a single living Hela cell trapped at the center of an octode cage (bottom, image size is ~200 μm_). Panel D three-dimensional cartoon perspective indicating schema of octode cage (top); and table (bottom) showing basic command phase separations between AC current in each electrode that yield: vertical rotation, stable positioning, horizontal rotation, and alternative stable positioning respectively.Movie M2: MR-imaging of H2B-GFP and annexin V-PE labelling inside an apoptoticTheileria-infected B-cell. The four image series movies show: transmission, H2B-GFP (green), annexin V-PE (red), and finally an approximate H2B-GFP/V-PE merged image series recorded by MR-imaging from an individual B cell co-transfected with JNK-APF, and consequently showing a phenotype 4 pattern. Note how the motion-image visualization reveals clearly that the V-PE signal is aggregated heterogeneously across the cell plasma membrane surface, delineating a shell of staining that evidently suggests its majority exclusion from the cytoplasm.

Lizundia et al. supplementary material
Legends for movies

File
28.2 KB
Lizundia et al, supplementary material
Colour slides
File
4.9 MB
M1B Supplementary movie
Movie 1B. MR-imaging of H2B-GFP fluorescence signal inside individual JNKN-APF co-transfected B cell.
Video
2.1 MB
M2 Supplementary movie
Movie 2. MR-imaging of H2B-GFP and anexin V-PE labelling inside apoptotic Theileria-infected B cell.
Video
6.4 MB
 You have
Access
- 20
- Cited by