INTRODUCTION
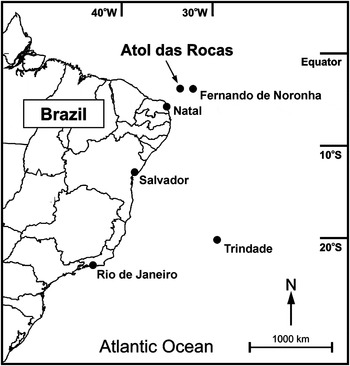
Green turtles (Chelonia mydas Linnaeus, 1758) nest in Brazil almost exclusively on oceanic islands. Trindade Island in eastern Brazil is their main nesting site in the country (Moreira et al., Reference Moreira, Baptistotte, Scalfone, Thomé and de Almeida1995; Almeida et al., Reference Almeida, Moreira, Bruno, Martins, Bolten and Bjorndal2011a); significant nesting also occurs in north-eastern Brazil on Atol das Rocas (Rocas Atoll: Bellini et al., Reference Bellini, Marcovaldi, Sanches, Grossman and Sales1996) and, in smaller numbers, on the Fernando de Noronha Archipelago (Bellini & Sanches, Reference Bellini and Sanches1996). Despite the large extent of the Brazilian mainland coast (about 7500 km: Figure 1), a relatively small number of green turtle nesting events (about 20–70 nests per year between 1999 and 2008) have been recorded there, mainly on the northern coast of the State of Bahia, but also in the States of Rio Grande do Norte, Sergipe, Espírito Santo and Rio de Janeiro (Projeto TAMAR-ICMBio (TAMAR), the Brazilian sea turtle conservation programme (Marcovaldi & Marcovaldi, Reference Marcovaldi and dei Marcovaldi1999), unpublished data). The green turtle and the other species of sea turtle found in Brazil are fully protected by law and are included on the Brazilian government's official list of endangered fauna (Marcovaldi & Marcovaldi, Reference Marcovaldi and dei Marcovaldi1999; Machado et al., Reference Machado, Drummond and Paglia2008). An assessment of the current conservation status of the green turtle in Brazil was presented by Almeida et al. (Reference Almeida, Santos, Thomé, Bellini, Baptistotte, Marcovaldi, dos Santos and Lopez2011b). The green turtle is currently classified as Endangered by the International Union for Conservation of Nature (IUCN: Seminoff, Reference Seminoff2004).
Map of Brazil (with its division in states), showing the location of Atol das Rocas and two other important green turtle nesting sites in the country: Fernando de Noronha and Trindade.

Atol das Rocas is the only known atoll in the south-western Atlantic Ocean (Kikuchi, Reference Kikuchi2000). Besides harbouring green turtle nesting, Atol da Rocas is a foraging area for juvenile green and hawksbill (Eretmochelys imbricata) turtles (Marcovaldi & Marcovaldi, Reference Marcovaldi and dei Marcovaldi1999; Grossman et al., Reference Grossman, Mendonça, da Costa and Bellini2007; TAMAR, unpublished data). It is also an important nesting area for some species of sea birds and a resting place for other migratory species of sea birds. The main sea bird species that nest regularly on the atoll are: masked booby (Sula dactylatra), brown booby (Sula leucogaster), brown noddy (Anous stolidus), black noddy (Anous minutus) and sooty tern (Sterna fuscata) (Schulz Neto, Reference Schulz Neto1998). In the sea inside or around the atoll, dolphins, sharks, a diversity of other fishes and other marine fauna can be found (Floeter & Gasparini, Reference Floeter and Gasparini2000; Paiva et al., Reference Paiva, Young and Echeverría2007; Baracho et al., Reference Baracho, Cipolotti, Marcovaldi, Apolinário and Silva2008; Freitas et al., Reference Freitas, Rosa, Wetherbee and Gruber2009). The Atol das Rocas Biological Reserve, including an ocean area of about 360 km2 around the atoll (up to the 1000 m isobath), was established on 5 June 1979 by the Brazilian federal government (Decree No. 83.549) and was the first marine protected area in Brazil. Neither resource exploitation nor recreational activities are allowed there, and only scientific research can be carried out under the Brazilian government's permission (Kikuchi, Reference Kikuchi1994, Reference Kikuchi2000). Since 2001 Atol das Rocas and the neighbouring Fernando de Noronha Archipelago have constituted a United Nations Educational, Scientific and Cultural Organization (UNESCO) World Natural Heritage Site (http://whc.unesco.org/en/list/1000).
TAMAR has operated on Atol das Rocas since 1982. Preliminary survey expeditions were carried out in 1982 and 1986 in order to assess the period of green turtle nesting on the atoll and to produce some rough estimates of the annual number of nests. After the significance of the atoll as a green turtle nesting area was established, yearly monitoring of the nesting beaches started in 1990 (Bellini et al., Reference Bellini, Marcovaldi, Sanches, Grossman and Sales1996).
In this paper, data on green turtle nesting on Atol das Rocas based on fieldwork (beach patrols) carried out between 1990 and 2008 are presented: temporal distribution of nesting events in each season; annual number of nests; carapace length of nesting females; clutch size; hatching success; incubation period; internesting interval; clutch frequency; observed reproductive lifespan; and remigration period. The Atol das Rocas data will be subjected to comparative analysis focusing mainly on Ascension Island and Trindade Island, the two nearest major green turtle nesting sites in the South Atlantic (Mortimer & Carr, Reference Mortimer and Carr1987; Almeida et al., Reference Almeida, Moreira, Bruno, Martins, Bolten and Bjorndal2011a).
MATERIALS AND METHODS
Study area and period
Atol das Rocas (3°51′50″S 33°48′40″W) is located 260 km north-east of Natal, the capital of the State of Rio Grande do Norte, north-eastern Brazil, and 150 km west of the Fernando de Noronha Archipelago (Figure 1). The atoll is bathed by the Southern Equatorial Current, which originates off the African coast and flows westwards (Kikuchi, Reference Kikuchi2000). It has an area of about 7 km2 and is approximately elliptical in shape: its greater axis, oriented east–west, is about 3.7 km long, and the minor axis, oriented north–south, is about 2.5 km long. Inside the atoll, two cays of biogenic sand are permanently raised above sea level: Ilha do Cemitério (Cemetery Island) and Ilha do Farol (Lighthouse Island) (Kikuchi, Reference Kikuchi2000). These islands are partially covered by natural vegetation (mainly Portulaca oleracea, Sesuvium portulacastrum, Cyperus ligularis and Eragrostis prolifera); a small number of introduced coconut palms Cocos nucifera are also found there (Schulz Neto, Reference Schulz Neto1998). On the islands there is approximately 1.5 km of beach, on which green turtles nest.
Data from both the preliminary survey expeditions carried out in 1982 and 1986 and the post-1990 monitoring work on Atol das Rocas showed that generally the nesting season there occurs from December to May, but the proportion of December nesting events is relatively small (less than 4% in the post-1990 seasons that were completely monitored). In this paper, a nesting season is referred to by the year that includes the month of January for that season, e.g. nesting events that occurred between December 2004 and May 2005 constituted the 2005 nesting season.
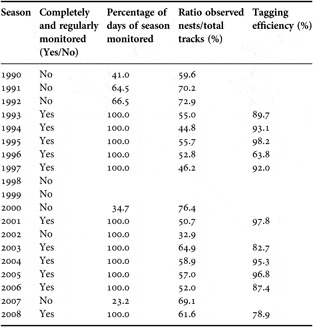
The study period included the nesting seasons from 1990 to 2008. In that period, eleven seasons (1993–1997, 2001, 2003–2006 and 2008) were completely and regularly monitored: the total nesting season was covered by the field team and beach patrols for nest counting (see the section ‘Field methods') were performed at every morning of each of these seasons. With regard to the other seasons, the following remarks apply: (1) no regular beach monitoring was carried out in 1998 and 1999. However some data, obtained opportunistically by TAMAR personnel on trips to the study site, are available for these two nesting seasons. With the exception of tagging data in both 1998 and 1999 (when analysing remigrations periods) and carapace length data in 1999 (no turtles were measured in 1998), these data will not be analysed further; (2) five seasons (1990, 1991, 1992, 2000 and 2007) were only partially monitored: beach monitoring started when the season had already begun and ended before the season's end. The percentage of the season's days actually monitored in each of these five seasons is presented in Table 1. In these seasons beach patrols were performed each morning of the monitoring period. The total number of nests in each of the five seasons was estimated by a method that used the information obtained in the eleven seasons that were completely and regularly monitored (see the section ‘Estimation of the annual number of nests'); and (3) although the 2002 nesting season was completely monitored, an analysis of the data indicated that some problems possibly occurred with data collection in that season. This was the only season with a bimodal temporal distribution of nesting events, and also the season when the ratio of nesting events to total tracks was much lower than that for all other seasons (Table 1). Although some real and unusual temporal nesting pattern could have occurred in 2002, we believe it more likely that there was some operational problem with the fieldwork and/or data recording. Accordingly we have considered 2002 to be a special season; we have not regarded it as completely and regularly monitored and we have estimated the number of nests in that season by a method deemed to be suitable to the season's data (see the section ‘Estimation of the annual number of nests').
Green turtle nesting on Atol das Rocas, Brazil, 1990–2008 (data on fieldwork characteristics by season). Tagging efficiency is presented only for the completely and regularly monitored seasons. Only opportunistic observations were carried out in 1998 and 1999.

Field methods
Beach monitoring and data collection followed standard TAMAR methods (Marcovaldi & Laurent, Reference Marcovaldi and Laurent1996; Marcovaldi & Marcovaldi, Reference Marcovaldi and dei Marcovaldi1999). In the eleven nesting seasons that were completely and regularly monitored, TAMAR personnel arrived at the atoll in mid-December, at the start of the season, and remained there until the end of May, when the last clutches were laid. In five seasons (1993–1997) the Tamar team stayed additionally on the atoll until the end of July, when the last hatchlings emerged from their nests; this allowed collection of data on clutch size, hatching success and incubation period. In 1994, some nesting events were also recorded during this additional period of fieldwork. Beach patrols were carried out on foot daily in the morning and also at night. Morning patrols were performed on both islands, which ensured that every crawl was recorded and all nests from the previous night could be counted. Depending on the tide, night patrolling, whose prime objective was the tagging and measurement of nesting turtles, was performed during the period between three hours before and three hours after the high tides, when the reefs around the islands remained submerged so allowing the nesting turtles to reach the sandy beaches. During that period of time, patrols were carried out every hour. Night patrols on Ilha do Cemitério were carried out only occasionally. Not all emergences of females were observed because Ilha do Cemitério was not patrolled every night. In addition some females on Ilha do Farol could be missed by the field team either due to the simultaneous nesting of several turtles, which made it difficult to keep track of each individual turtle, or when a turtle which remained inside the atoll and was stranded in the lagoon (which, during low tides, often has very low levels of water) crawled towards a beach and reached it only when the patrol had already ceased; these turtles had to wait for the next high tide to negotiate the outer reefs and return to the open sea.
Nesting females were double tagged with monel tags (National Band and Tag Co., USA, style 681), with a tag applied on the trailing edge of each fore flipper. Curved carapace length (CCL) and width were measured with a flexible plastic tape. However for operational reasons measurements were not carried out for every female found on the beach. CCL was measured from the anterior point at midline (nuchal scute) to the posterior tip of the supracaudal scutes.
From 1993 to 1997 systematic sampling (Cochran, Reference Cochran1977) was applied to select nests to be followed through incubation and later excavated, so that data concerning clutch size, hatching success and incubation period could be obtained. As a rule, every fourth nest (the nests were ordered by their date and time of construction) was selected. For each selected nest, after 45 days of incubation the nest was monitored generally three times a day, in the morning, late afternoon and during night patrols, in order to determine the moment of hatchling emergence. Whenever hatchling emergence was not directly observed, hatchling tracks on the sand and/or the sand level over the nest provided clues indicating that hatchlings had emerged from the nest. Nests were excavated within 24 hours after the majority of hatchlings had emerged. A nest that did not produce any hatchlings was excavated at a date determined by assessing the incubation periods of clutches laid at dates close to the date of construction of the nest itself. Clutch size was determined by counting egg shells and unhatched eggs.
Data analysis
Statistical analyses were carried out with the software R 2.14.1 (R Development Core Team, 2011); significance level was alpha = 0.05. The base map in Figure 1 was generated by the Maptool software (http://www.seaturtle.org).
Hatching success was calculated as the percentage of eggs that produced live hatchlings, including live hatchlings encountered during nest excavation. Incubation period was calculated as the number of days between clutch deposition and time of emergence of the first hatchlings. Clutch size, hatching success and incubation period distributions for each season were tested for normality by means of Shapiro–Wilk normality tests (Royston, Reference Royston, Balakrishnan, Read and Vidakovic2006). As these distributions were generally non-normal, clutch size, hatching success and incubation period were compared among seasons by means of permutation tests (Berry et al., Reference Berry, Johnston and Mielke2011), using the package coin of the R software (Hothorn et al., Reference Hothorn, Hornik, van De Wiel and Zeileis2008). The temporal distribution of nesting events, defined as the daily number of nesting events in a season, was also compared among seasons by means of a permutation test. For that test, the date of each nesting event was converted to an absolute date, consecutively counted from 1 December of the season to which the nesting event belonged. The same date, 1 December, was used for date conversion in each season, no matter what the actual starting date of the season was. This was because the objective of the test was to detect time shifts among seasonal distributions of nesting events, which required that the absolute dates be counted from the same date in each season.
The analyses of the trend in the annual number of nests and of CCL variation over the seasons were performed by means of non-parametric local polynomial regressions with simultaneous confidence bands, using the package locfit of the R software (Loader, Reference Loader1999). When analysing the CCL distribution by season only the first CCL measurement of each turtle in each season was used. Whenever necessary for carapace size comparisons with other populations, published straight carapace lengths were converted to CCLs using the formula in Teas (Reference Teas1993).
Tagging efficiency was calculated only for the completely and regularly monitored seasons, as the ratio between the number of nests for which the nesting female was tagged or checked for tags at the moment of laying the clutch and the total number of observed nests. This mode of calculating tagging efficiency gives information on tagging coverage related to the calculation of internesting intervals and clutch frequency, which depend only on nesting emergences. For determining remigration periods, observed reproductive lifespans, and for annual CCL calculations, every encounter of a turtle on the beach (including non-nesting emergences) provided tagging information, and in that regard the tagging efficiency, as calculated above, is not the most appropriate measure of the tagging effort.
For a turtle nesting in a determinate season, her observed clutch frequency (OCF) was the number of clutches she was actually observed laying in the season. On the basis of data from Atol das Rocas, it was assumed that the actual internesting interval was in the range of 8–17 days (see the section ‘Clutch frequency, internesting intervals and remigrations'). Observed internesting intervals shorter than 8 days were considered likely due either to faulty data recording (in one of the emergences, although it was recorded as a nesting event, in fact no eggs were laid) or to split egg clutches. Consequently, clutches recorded at intervals shorter than 8 days were counted as just one clutch for the OCF calculations.
For a turtle nesting in a determinate season, her estimated clutch frequency (ECF) was calculated by adding a number of clutches to the OCF, according to a method based on Frazer & Richardson (Reference Frazer and Richardson1985), presented below (in the description of the method, a non-egg-laying emergence means an emergence for which a nest was dug but no eggs were laid, so false crawls, without nest digging, were not considered):
(1) Besides assuming that the actual internesting interval was in the range of 8–17 days, it was assumed that the mean internesting interval (for all turtles and seasons) was the one observed at Atol das Rocas, namely 11.8 days (see the section ‘Clutch frequency, internesting intervals and remigrations'). However in a determinate season, the mean internesting interval for an individual turtle nesting more than once in the season could actually be either greater or smaller than 11.8 days.
(2) Whenever a non-egg-laying emergence was observed, it was taken as an indication that a nesting event occurred at a near date (in fact, non-egg-laying emergences and egg-laying ones (nesting events) were many times recorded on the same day at Atol das Rocas). If no nesting event was recorded within less than 8 days of a non-egg-laying emergence, the non-egg-laying emergence was counted as one more clutch to be added to the OCF, on the assumption that some nesting at a near date went unrecorded. If a nesting event was recorded within less than 8 days of a non-egg-laying emergence, the non-egg-laying emergence was disregarded for the ECF calculation.
(3) For an individual turtle nesting in a determinate season, the time periods between consecutive observed clutches (already included in the OCF calculations) or clutches estimated to have been laid through an analysis of non-egg-laying emergences (item 2 above) were evaluated. When a time period was greater than 17 days, it was divided by an estimate of the mean internesting interval for that turtle in the season, if such an estimate could be calculated. Otherwise it was divided by the general mean internesting interval of 11.8 days. The estimated number of clutches to be added to the OCF was the result of that division, rounded to a whole number, minus one. These calculations were based on the assumption that every long internesting interval was due to one or more unrecorded nesting events between two recorded (or estimated) ones, although this interpretation has been questioned by Schulz (Reference Schulz1975) in relation to green turtles nesting in Surinam.
(4) Only turtles that were actually observed laying at least one clutch in the season were included in the ECF calculations.
Clutch frequency distributions, both observed and estimated, and also the distributions of observed internesting intervals, were compared among seasons by means of permutation tests. Internesting intervals and clutch frequency were analysed based on data from the eleven completely and regularly monitored seasons. With regard to remigration periods, a preliminary analysis, using data from all seasons, showed that about 95% of them were equal to five years or less. Accordingly, in the final analysis (see the section ‘Clutch frequency, internesting intervals and remigrations'), only data from turtles first tagged until 2003 were used; this ensured that, within the study period, the turtles included in the analyses of remigration periods had at least five years to eventually return to Atol das Rocas. For the calculation of the observed reproductive lifespan of each turtle (the number of years between her first and last observed reproductive seasons: Almeida et al., Reference Almeida, Moreira, Bruno, Martins, Bolten and Bjorndal2011a), data from all seasons were used, although the analysis was in part performed only with turtles first tagged until 2003. Estimates of the median and mean reproductive lifespan and their confidence intervals were calculated by the non-parametric Kaplan–Meier (product-limit) method (Klein & Moeschberger, Reference Klein and Moeschberger2003) using the package survival of the R software (Therneau & Lumley, Reference Therneau and Lumley2011).
Estimation of the annual number of nests
The methodology for estimating the total number of nests for the five seasons that were only partially monitored is described below in its essential points:
(1) Initial and final dates for each partially monitored season were estimated by means of a two-step process: (1a) two simple linear regressions (Zar, Reference Zar1996) were calculated on the basis of the initial and final dates of the eleven completely and regularly monitored seasons. In each regression, the season was the independent variable; the dependent variable was, for one of the regressions, the initial date of the season (in absolute days: for each season, 1 December = day 1), and it was the final date for the other regression; (1b) for each partially monitored season, the initial and final dates (to be used in item 3 below) were estimated from the values of the regression lines at the season.
(2) For each of the two regressions in item 1a, the residuals (N = 11 in each regression) were shown to follow a normal distribution by means of Shapiro–Wilk normality tests (P = 0.6145 and 0.3997), and the two sets of residuals were shown to have means not significantly different by using a t-test (P = 0.9661: Zar, Reference Zar1996). The pooled set of residuals (N = 22) was shown to follow a normal distribution with mean equal to zero and standard deviation equal to that of the pooled set itself, by using a one-sample Kolmogorov–Smirnov test (P = 0.9112: Zar, Reference Zar1996). That normal distribution will be used in item 5 below, when estimating initial and final dates for each partially monitored season in the confidence interval calculations (items 4–8).
(3) For each partially monitored season, a non-parametric smoothing spline Poisson regression was calculated by means of the R package gss (Gu, Reference Gu2002). In the regression, the dependent variable was the recorded daily number of nests, the independent variable was their laying date and the initial and final dates, on which zero nests were assumed, were those determined in item 1b. The estimated number of nests in the season was the integral of the regression curve between the initial and final dates.
(4) A 95% confidence interval for the estimate of the number of nests in the season was obtained by the procedure described in items 5–8. In item 5, the initial and final dates of the season were treated as random variables, for the reason that they were estimated in item 1b, so they were not really observed dates and were by themselves a source of error in the estimation of the annual number of nests. The procedure described in item 5 is a way of accounting for that source of error in the confidence interval calculations. Item 6, a kind of parametric bootstrap (Efron & Tibshirani, Reference Efron and Tibshirani1993) with relation to the estimation of the number of nests for the days that were not monitored, followed Godgenger et al. (Reference Godgenger, Bréheret, Bal, N'Damité, Girard and Girondot2009).
(5) A new estimate of the initial date of the season was obtained by adding to the initial date determined in item 1b a random normal variate drawn from the normal distribution described in item 2. A similar calculation was performed to obtain a new estimate of the final date of the season. These are the dates to be used in the non-parametric regression described in item 7.
(6) For each day that was not monitored, the number of nests in that day was estimated (simulated) by randomly sampling from a Poisson distribution with mean given by the value, for that day, of the non-parametric regression curve calculated in item 3.
(7) As in item 3 a non-parametric smoothing spline Poisson regression relating dates and daily number of nests was calculated, but this time on the basis of the observed daily counts of nests plus the simulated daily counts obtained in item 6 for days when the beaches were not monitored. This non-parametric regression used the initial and final dates estimated in item 5, and zero nests were assumed at these dates.
(8) The steps described in items 5–7 were repeated 2000 times, and each time the integral of the new regression curve (item 7) was calculated. The percentiles 2.5 and 97.5 of the 2000 integrals formed the 95% confidence interval.
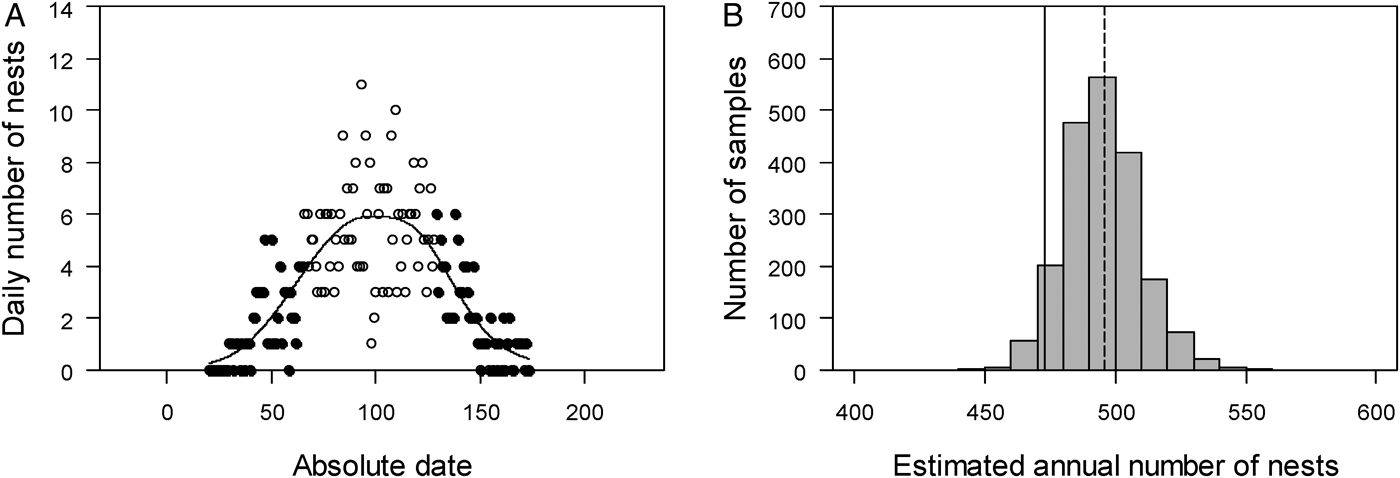
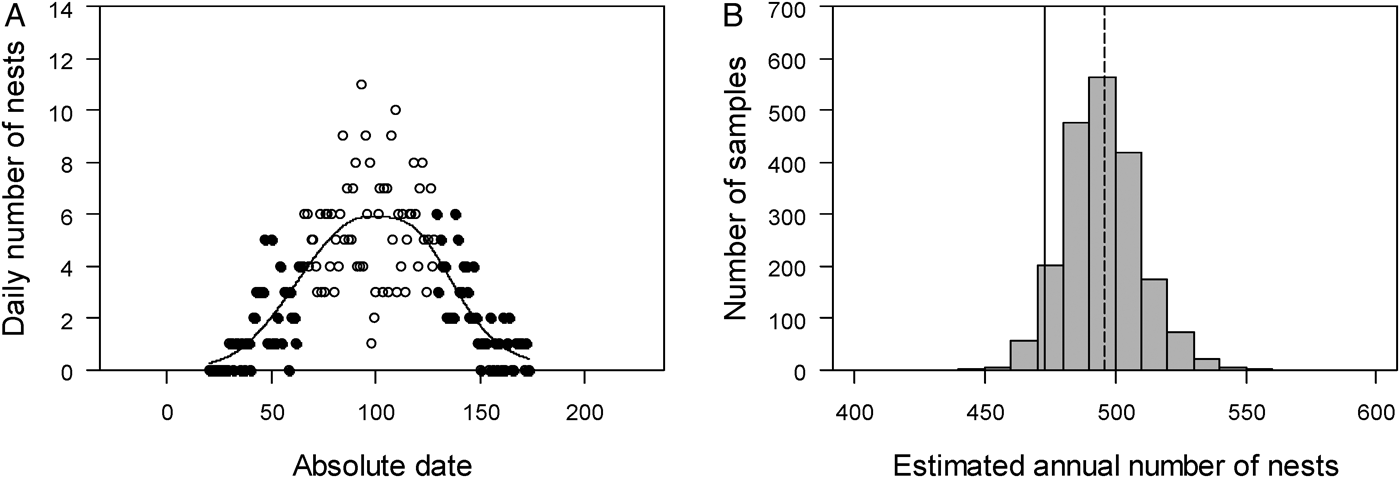
The above-described estimation method was extensively tested by means of computer simulations, by applying the estimator to samples from either completely monitored nesting seasons or artificial computer-constructed ones (either way, the total number of nests in the season was known) and then analysing the estimator's properties. The estimator was shown to have relatively low bias, whenever the fieldwork period included the peak of the nesting season, and is consistent, in the sense that the error of the estimate tends to zero as the fieldwork period approaches the whole nesting season. As an example, Figure 2 shows some results of a computer simulation in which a sample was taken from the 2008 nesting season (which was completely and regularly monitored) and was then used for assessing the estimation method. A detailed description of this methodology and of its evaluation will be published elsewhere.
An example of the evaluation, by computer simulation, of the method for estimating the annual number of nests (see the section ‘Estimation of the annual number of nests', with its numbered items). A sample (white points in panel A) was taken from the 2008 nesting season (which was in fact completely and regularly monitored, with 473 recorded nests), and the estimation method was applied to that sample, so that one could obtain an estimate (calculated according to items 1–3 of the method) of the total number of nests in 2008: 492 nests. The sample included 41% of the days of the 2008 season. Left panel (A): the complete set of points (white plus black ones) represents a reconstruction of the whole nesting season, necessary for the confidence interval calculations. The initial and final dates of the season were estimated by the procedure described in item 5 of the method, and the black points were constructed following the procedure described in item 6. The integral of the non-parametric regression curve shown in the figure (item 7 of the method) furnished one of the 2000 estimates that were used to construct the histogram on the right panel; right panel (B): distribution of the estimates obtained by repeating 2000 times the procedures described in items 5–7 of the method and each time calculating the integral of the non-parametric regression performed in item 7. The 95% confidence interval for the estimate (in this case, equal to (470, 526)) is formed by the percentiles 2.5 and 97.5 of that distribution (item 8 of the method). The solid vertical line indicates the actual total number of nests in 2008, 473 nests, and the dashed vertical line indicates the mean of the 2000 estimates obtained through simulation, 495.7 nests. These two figures allow one to calculate the relative bias of the estimator in this particular simulation: 4.8%.
For 2002, an estimate of the number of nests in the season was obtained by a different procedure: (1) the ratio nests/tracks was calculated for each of the eleven seasons that were completely and regularly monitored (Table 1); (2) the product (ratio nests/tracks) × (tracks in 2002) was calculated for each of these eleven seasons; and (3) the estimated number of nests in 2002 was the mean of the eleven products, and the percentiles 2.5 and 97.5 formed a 95% confidence interval for the estimate.
RESULTS
Temporal distribution of nesting events and abundance
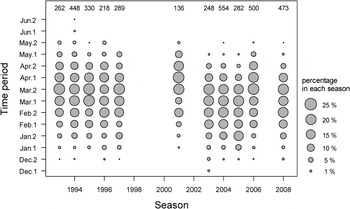
In general the nesting season peaked from February to April (Figure 3). However, the temporal distribution was significantly different among the seasons (permutation test, P < 0.0001), apparently due to marked changes between 2001 and 2008, in relation to the period 1993–1997.
Percentual temporal distribution of nesting events by season: only completely and regularly monitored seasons are presented. The top row of numbers shows the annual number of nests in each season. For each month, time period 1 includes nesting events up to the 15th day of the month (February: up to the 14th day), and time period 2 includes nesting events in the other days. For each season, the area of the circle concerning one specific time period is proportional to the percentage of the total number of nests in the season in the time period. The scale on the right, relating the areas of the circles to percentages, presents only some reference values for the areas and corresponding percentages; areas and percentages are in fact continuous variables.

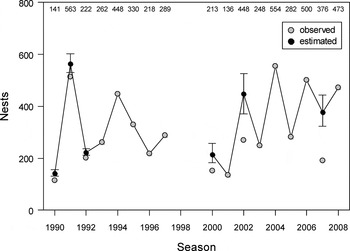
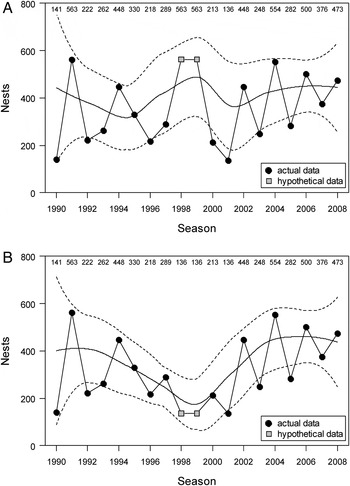
Figure 4 presents the number of nests per season. Excluding 1998 and 1999, the mean annual number of nests, taking into account the estimated number of nests, was 335 (standard deviation (SD) = 139, range = 136–563, N = 17). The gap in the time-series (in 1998–1999) precludes any clear conclusion about the trend in the annual number of nests, as shown by the analysis presented in Figure 5, where two hypothetical scenarios regarding the time trend in the annual number of nests are investigated. Each scenario was obtained by filling the gap in the time-series in a different way. Scenario A is a ‘best case' situation with regard to the annual number of nests in 1998–1999: the missing seasons were each assigned a number of nests equal to the largest annual number of nests (either observed or estimated) among all other seasons. In scenario B, a ‘worst case' situation for 1998–1999 is depicted: the missing seasons were each assigned a number of nests equal to the smallest annual number of nests (either observed or estimated) among all other seasons. In scenario A, a straight line with slope either equal to zero or positive or negative (non-zero slopes should be within some bounds) could be contained completely inside the simultaneous confidence band, so scenario A does not rule out the possibility of either a stationary trend in the annual number of nests or an increasing or a decreasing trend over the study period. Scenario B suggests that the annual number of nests could have decreased between 1990 and 1999, and could have increased afterwards, between 1999 and 2008, to levels roughly comparable to those in 1990–1999. Given that the two scenarios were constructed on the basis of the maximum and minimum number of nests (either observed or estimated) for Atol das Rocas in the study period, the probability seems to be low that the annual number of nests in 1998 and 1999 could be either higher than what is presented in scenario A or lower than what is presented in scenario B. Consequently, the actual trend of the annual number of nests in the whole study period should probably be within the range of possibilities suggested by the two scenarios presented in Figure 5. No matter what happened in 1998 and 1999 a simultaneous examination of both scenarios in Figure 5 indicates that the average nesting levels at the beginning of the study period (the first five seasons) and at its end (the last five seasons) were roughly about the same.
Observed and estimated number of nests by nesting season. The top row shows the number of nests in each season: observed number of nests for the completely and regularly monitored seasons (grey circles), and estimated number of nests for seasons for which estimation was necessary (black circles). The error bars indicate 95% confidence intervals for the estimates (see the section ‘Data analysis' for methods). No estimates are available for 1998 and 1999, due to lack of adequate field data.

An attempt to overcome the problem presented by the gap in the time-series in Figure 4: two hypothetical scenarios regarding the time trend in the annual number of nests are investigated; each scenario was obtained by filling the gap in the time-series in a different way. (A) Top panel (a ‘best case' scenario with regard to the annual number of nests in the missing seasons): the missing seasons were each assigned a number of nests equal to the largest annual number of nests among all other seasons (the grey squares in the figure); (B) lower panel (a ‘worst case' scenario): the missing seasons were each assigned a number of nests equal to the smallest annual number of nests among all other seasons. For the regression analysis presented in each panel, estimated number of nests were used for the seasons for which estimation was necessary (see Figure 4). In each panel, the solid curve is a local polynomial regression, and the dashed curves form a 95% simultaneous confidence band.

Carapace length
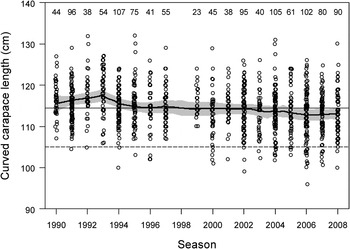
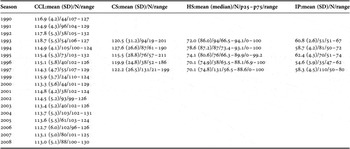
The mean CCL decreased significantly during the study period, as indicated by Figure 6, where no line with slope equal to zero can be contained within the simultaneous confidence band. It can be observed in that figure that turtles with CCL smaller than 105 cm were rarely seen before 1997, but were much more common from 2000 on. In the three initial years of the study period (1990–1992), the mean CCL was 115.9 cm (SD = 4.6, median = 116.0, range = 104.5–132.0, N = 174), and in the three final years (2006–2008), the mean CCL was 112.9 cm (SD = 5.4, median = 113.0, range = 96.0–130.0, N = 263). The average rate of CCL decrease between 1991 and 2007 (the central years of each of the three-year intervals) was 0.19 cm/year. In the whole study period, the minimum recorded CCL was 96 cm, and the maximum was 132 cm. In Table 2 CCL data by season are presented.
Curved carapace length (CCL) distribution by season: sample sizes are shown in the top row. The solid curve is a local polynomial regression, and the grey area represents a 95% simultaneous confidence band. The solid horizontal line shows the overall mean CCL: 114.5 cm. The dashed horizontal line indicates a CCL equal to 105 cm. In the graph, the data points have been slightly randomly displaced (both horizontally and vertically) in order to avoid superposition; however, the regression calculations were performed with the actual values for season and CCL.

Green turtle nesting on Atol das Rocas, Brazil, 1990–2008. Curved carapace length (CCL, cm), clutch size (CS, number of eggs), hatching success (HS, percentage) and incubation period (IP, days) by season. In the HS data, p25 and p75 are the percentiles 25 and 75 respectively. No CCL, CS, HS and IP data are available for the 1998 nesting season.

SD, standard deviation; N, number.
Clutch size, hatching success and incubation period
Clutch size was not different among the five seasons (1993–1997) for which it was analysed (permutation test, P = 0.0911: Table 2). The overall mean clutch size was 121.5 eggs (SD = 28.0, median = 121.0, range = 19–211, N = 426). Hatching success was significantly different among the five seasons (permutation test, P = 0.0018, N = 426: Table 2). The mean annual hatching success ranged between 70.1% (in 1996 and 1997) and 78.6% (in 1994). The incubation period was also significantly different among the five seasons (permutation test, P < 0.0001, N = 347: Table 2). The mean annual incubation period ranged between 54.6 days (in 1996) and 62.4 days (in 1995).
Clutch frequency, internesting intervals and remigrations
In the completely and regularly monitored seasons, tagging efficiency ranged between 63.8% (in 1996) and 98.2% (in 1995) (Table 1).
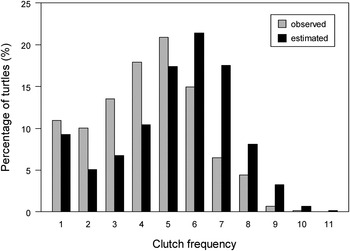
Observed clutch frequencies ranged between 1 and 10 nests, and ECFs ranged between 1 and 11 nests (Figure 7). The maximum OCF, 10 nests, was recorded for just one female in 1994. For this turtle, an analysis of the observed internesting intervals did not indicate that there were nesting events missed by the field team between her first observed nesting and the last observed one in the season. The maximum ECF, 11 nests, was calculated for just one female in 2008 (Figure 7). For this turtle, there were 9 observed nesting events in that season, and there were two observed internesting intervals of 25 and 30 days, which, by the method explained in the section ‘Data analysis', indicated that two further nesting events were not observed. For the eleven completely and regularly monitored seasons combined, the mean OCF was 4.3 nests per turtle (median = 4.0, SD = 1.94, range = 1–10, N = 775). However, the OCF distribution was significantly different among the eleven seasons (permutation test, P < 0.0001). The annual mean OCF in the eleven seasons ranged between 3.5 nests per turtle (in 1996) and 5.2 nests per turtle (in 2003). The ECF distribution was not significantly different among the eleven seasons (permutation test, P = 0.4803). The annual mean ECF in the eleven seasons ranged between 4.8 nests per turtle (in 1995) and 5.7 nests per turtle (in 2003). The mean ECF for the eleven seasons combined was 5.2 nests per turtle (median = 6.0, SD = 2.15, range = 1–11, N = 775).
Observed (grey bars) and estimated (black bars) percentual annual clutch frequency, for the eleven completely and regularly monitored seasons combined (N = 775).

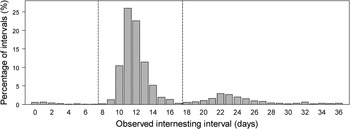
Observed internesting intervals for the eleven completely and regularly monitored seasons were in the range of 0–70 days (N = 2574 intervals). Observed intervals up to 36 days (N = 2522 intervals: Figure 8) amounted to 98.0% of the total number of internesting intervals observed in the eleven seasons. The percentage distribution of observed internesting intervals up to 36 days was not significantly different among the eleven seasons (permutation test, P = 0.1303). For the eleven seasons combined, the distribution of observed intervals up to 36 days displays a multimodal character, with peaks at 1, 11, 22 and 32 days (Figure 8). Visual inspection of Figure 8 suggests that the actual internesting intervals should possibly be in the range of 8–17 days (there were N = 2031 intervals in that range, 78.9% of the total number of observed intervals). The mean observed internesting interval for the ones between 8 and 17 days was 11.8 days (median = 12.0, SD = 1.4, N = 2031). Observed internesting intervals shorter than 8 days (2.1% of the total number of observed intervals) were likely due either to faulty data recording (possibly, an emergence, although recorded as a nesting event, was indeed a non-egg-laying emergence) or to split egg clutches. Observed intervals longer than 17 days (19.0% of the total number of internesting intervals) were likely due to unrecorded nesting events between two recorded ones (see Discussion), although, as stated before, the application of this interpretation to every long interval was questioned by Schulz (Reference Schulz1975).
Percentual distribution of observed internesting intervals, for intervals up to 36 days (N = 2522 intervals), for the completely and regularly monitored seasons. The vertical lines, arbitrarily chosen by visual inspection of the graph, are meant to represent the possible actual range of internesting intervals, 8–17 days. There were N = 2031 observed intervals in that range (80.5% of the number of observed intervals in the graph).

In the whole study period, a total of 924 individual turtles were tagged on Atol das Rocas. In the eleven completely and regularly monitored seasons, the average number of individual turtles tagged per season was 73 (range = 38–128, N = 11). Among the turtles first tagged until 2003 (631 individual turtles), and considering all the data gathered for these turtles until the end of the study period, 489 turtles (77.5%) were seen in just one season, and 142 (22.5%) were seen in more than one season, that is, their remigration was observed. Among these 142 turtles, a total of 265 remigration periods were observed; the mean observed remigration period was 3.5 years (median = 3.0; SD = 1.34; range = 2–10). There were 43 (16.2%) observed remigration periods of 2 years, 138 (52.1%) of 3 years, 41 (15.5%) of 4 years, 26 (9.8%) of 5 years, and 17 (6.4%) between 6 and 10 years; remigration periods of one year were not observed.
The observed reproductive lifespan ranged between 2 and 16 years (N = 192 turtles); the maximum was recorded for just one turtle first tagged in 1992, and all values between the two extremes have been observed. For turtles first tagged from 1992 on, there was a steady decline in the observed reproductive lifespan with the season of first tagging, at the average rate of approximately one year per season, from 16 years for that turtle first tagged in 1992 to 2 years for three turtles first tagged in 2006. Among the 142 turtles first tagged until 2003 that remigrated, 17 of them were last observed in 2008, the last season of the study period, with reproductive lifespans in the range of 6–16 years, which included the maximum reproductive lifespan observed in this study. This suggests that these 17 lifespans might have been right-censored (Klein & Moeschberger, Reference Klein and Moeschberger2003), and that the actual maximum reproductive lifespan for green turtles nesting on Atol das Rocas could possibly be larger than the maximum reproductive lifespan observed in this study. For the turtles first tagged until 2003 that remigrated, the Kaplan–Meier estimate of the median of the observed reproductive lifespans was 5.5 years (N = 142 lifespans, 17 of which possibly right-censored), with 95% confidence interval equal to (4.0, 7.0). The Kaplan–Meier estimate of the mean (restricted to observed lifespans up to 16 years) was equal to 6.8 years, with 95% confidence interval equal to (6.1, 7.5). These calculations suggest that the observed reproductive lifespan was on average equal to approximately twice the mean observed remigration period, which would indicate a reproductive period of three nesting seasons per turtle on average. However, the calculations should be viewed with caution due to the possible right-censoring of the reproductive lifespans.
By multiplying the average number of turtles nesting per season (73 turtles) by the mean remigration period (3.5 years) an estimate of the average total number of reproductively active females in the Atol das Rocas population in each season in the period 1990–2008 is obtained: 255 turtles.
Movements of reproductive female green turtles to or from Atol das Rocas
Movements of reproductive female green turtles between Atol das Rocas and Fernando de Noronha (N = 4 turtles), and also between Atol das Rocas and Trindade Island (N = 1 turtle), were recorded.
One green turtle initially tagged on Atol das Rocas during a non-egg-laying emergence (with nest building) on 21 February 2005 and last recorded there while nesting on 23 February 2005 was observed in a non-egg-laying emergence (a false crawl) on Fernando de Noronha on 16 March 2005, and was later observed nesting on Fernando de Noronha three times in February–March 2007. Conversely, three other green turtles initially tagged on Fernando de Noronha were later observed on Atol das Rocas: (1) the first turtle was observed during a non-egg-laying emergence (a false crawl) on Fernando de Noronha on 6 March 1994, and was later observed nesting four times on Atol das Rocas in the same season (the first time on 29 March 1994), three times in 1996 and twice in 1999; (2) the second turtle was tagged during a non-egg-laying emergence (a false crawl) on Fernando de Noronha on 6 February 1994, nested there on 17 February 1994 and was last observed on Fernando de Noronha during a non-egg-laying emergence (a false crawl) on 27 February 1994; she was later observed nesting once on Atol das Rocas on 7 April 1994; and (3) the third turtle nested on Fernando de Noronha on 11 February 2004, and was later observed nesting five more times in the same season on Atol das Rocas between February and April 2004 (the first nesting on Atol das Rocas was on 24 February 2004).
One green turtle nested four times on Atol das Rocas in March–April 2004, nested three times there in March 2007, and was afterwards observed twice in 2010 during non-egg-laying emergences (both with nest building) on Trindade Island, one on 23 February 2010 and the other on 8 March 2010 (the observations on Trindade occurred outside the study period).
In addition, two green turtles that nested on Atol das Rocas were later observed dead on the Brazilian mainland coast. A turtle tagged while nesting on Atol das Rocas on 31 January 2004 and last seen there on 31 March 2004 was found stranded dead on 21 January 2008 at Almofala, Ceará, Brazil (680 km west from Atol das Rocas). Outside the study period, a turtle tagged while nesting on Atol das Rocas on 24 January 2010 and last seen there on 23 March 2010 was found stranded dead on 5 April 2011 on Cajueiro Beach, Rio Grande do Norte, Brazil (230 km south-west from Atol das Rocas).
DISCUSSION
Although Atol das Rocas was established as a federal biological reserve in 1979, regular sea turtle conservation activities actually started there in 1990. Up until that year, nesting green turtles were commonly chased and killed for meat on the atoll, and eggs were poached (Gilberto Sales, personal communication, 2011). Since 1990, due to the year-round presence on the atoll of Brazilian environmental officers and researchers (not only sea turtle researchers, but also those studying sea birds, fishes, marine geology and other subjects), the killing of nesting turtles has ceased, nesting activity by the turtles can proceed in an undisturbed fashion, and their clutches can incubate in a protected environment. The levels of annual green turtle nesting on Atol das Rocas before 1990 are unknown, so it is not possible to put the post-1990 nesting data (Figure 4) into a historical perspective.
The temporal distribution of nesting in each season on Atol das Rocas, peaking generally around March (Figure 3), is similar to the one observed on Ascension Island, the largest green turtle nesting colony in the South Atlantic, located at latitude 7°56′S and 2200 km away from Atol das Rocas (Godley et al., Reference Godley, Broderick and Hays2001). At another major green turtle nesting site in the South Atlantic, Trindade Island, located at latitude 20°30′S and 1900 km away from Atol das Rocas, the nesting season seems to occur a little earlier, peaking around February (Almeida et al., Reference Almeida, Moreira, Bruno, Martins, Bolten and Bjorndal2011a).
Nesting beach data can be used to estimate the abundance of nesting females directly, by counting or estimating the number of turtles, or indirectly, by counting or estimating the total number of nests or tracks. In the latter case an index of abundance is in fact produced, a relative measure of the population size (Gerrodette & Taylor, Reference Gerrodette, Taylor, Eckert, Bjorndal, Abreu-Grobois and Donnelly1999; Schwarz & Seber, Reference Schwarz and Seber1999). In the present paper, the annual number of nests (Figure 4) is taken as an index of abundance of the nesting population. In the eleven completely and regularly monitored seasons the daily number of nests and tracks were recorded, due to the beach patrols carried out every morning; these eleven seasons were taken as the basis for the estimation procedures used here (see the section ‘Estimation of the annual number of nests'). For the five incompletely monitored seasons (1990, 1991, 1992, 2000 and 2007), the annual number of nests was estimated by means of a regression methodology, while confidence intervals were constructed by a procedure combining regression and bootstrap methods. Regression methods are well established in the estimation of the annual number of nests on a beach, although different statistical techniques have been employed in that area (Bjorndal et al., Reference Bjorndal, Wetherall, Bolten and Mortimer1999; Girondot, Reference Girondot2010). For 2002, the annual number of nests was estimated by applying the ratio nesting events/total tracks from each of the eleven completely and regularly monitored seasons to the number of tracks recorded in 2002. The application of the ratio nesting events/tracks to the estimation of the annual number of nests on a beach is also a well-established methodology in sea turtle research (Godley et al., Reference Godley, Broderick and Hays2001; Almeida et al., Reference Almeida, Moreira, Bruno, Martins, Bolten and Bjorndal2011a).
The analysis presented in Figure 5 indicates that there is great uncertainty in the estimation of the trend of the annual numbers of nests. The uncertainty is in part due to the relatively large inter-seasonal variability in the annual number of nests, which contributes to the production of relatively wide confidence bands in the non-parametric regressions. Large variability in the annual number of nests, which seems to be a characteristic of green turtle populations, has been observed at several nesting sites in the Atlantic, Mediterranean and Pacific (Bjorndal et al., Reference Bjorndal, Wetherall, Bolten and Mortimer1999; Broderick et al., Reference Broderick, Godley and Hays2001; Chaloupka et al., Reference Chaloupka, Bjorndal, Balazs, Bolten, Ehrhart, Limpus, Suganuma, Troëng and Yamaguchi2008). But, to a great extent, the uncertainty is also due to the gap, in 1998–1999, in the time-series presented in Figure 4. The lack of data in these two seasons and the difficulties that this entails for the analysis of the temporal trend of the annual number of nests highlight the importance of maintaining uninterrupted monitoring of nesting beaches over the years. Given the dispersion of nesting females to wide areas of the ocean outside the nesting period, nesting beaches where the females congregate are essential sites for collecting data for sea turtle demography studies and conservation assessments (Gerrodette & Taylor, Reference Gerrodette, Taylor, Eckert, Bjorndal, Abreu-Grobois and Donnelly1999).
The mean CCL of green turtles nesting on Atol das Rocas decreased significantly over the seasons, from 115.9 cm at the start of the study period (1990–1992) to 112.9 cm at its end (2006–2008), so it is not possible to assign a definite mean CCL to the turtles nesting there. Green turtles nesting on Atol das Rocas seem to be about the same size, or maybe slightly smaller, than those nesting on Trindade and Ascension: at Trindade, the mean CCL between 1982 and 2009 was 115.2 cm (Almeida et al., Reference Almeida, Moreira, Bruno, Martins, Bolten and Bjorndal2011a), and at Ascension it was 115.0 cm in 1960 (Carr & Hirth, Reference Carr and Hirth1962) and approximately 116.3 cm in 1973–1974 (Simon & Parkes, Reference Simon and Parkes1976: data obtained from figure 3 in that paper). However, for Trindade and Ascension no information is available with regard to CCL variation over the years. The mean CCL of green turtles nesting on Atol das Rocas, as well as the mean CCLs of those nesting on Trindade and Ascension, are at the high end of the range of mean CCLs for green turtle populations of different oceans presented by Godley et al. (Reference Godley, Broderick, Frauenstein, Glen and Hays2002).
Genetic analyses indicate that the main green turtle female nesting populations in the Atlantic–Mediterranean system are mostly demographically independent (Encalada et al., Reference Encalada, Lahanas, Bjorndal, Bolten, Miyamoto and Bowen1996; Kaska, Reference Kaska2000; Bjorndal et al., Reference Bjorndal, Bolten and Troëng2005; Formia et al., Reference Formia, Godley, Dontaine and Bruford2006). In Brazil, a mitochondrial DNA (mtDNA) analysis indicated that significant genetic structure exists among Trindade and the Atol das Rocas–Fernando de Noronha complex. Haplotype frequencies are significantly different between Trindade and the two other nesting colonies, while no significant difference exists between Atol das Rocas and Fernando de Noronha (Bjorndal et al., Reference Bjorndal, Bolten, Moreira, Bellini and Marcovaldi2006).
Although some adult female green turtles observed (either nesting or during non-nesting emergences) on either Atol das Rocas or Fernando de Noronha were later recorded nesting at the other nesting site, in fact there seems to exist a nearly complete demographic independence between the two colonies with regard to the adult females. Despite the many years of beach monitoring at both sites (regular monitoring of nesting beaches at Fernando de Noronha started in 1987: TAMAR, unpublished data), only four individual nesting females were observed at both sites. At Fernando de Noronha about 60 nests on average were laid per season between 1990 and 2008 (TAMAR, unpublished data), which, by applying the ECF for Atol das Rocas (5.2 nests per turtle per season), amounted to 12 turtles per season approximately. Adding the 12 turtles per season from Fernando de Noronha to the 73 turtles that nested on average per season on Atol das Rocas in the study period, we see that the average number of turtles per season in the Atol das Rocas–Fernando de Noronha system in the study period was 85 turtles approximately. Taking into account that the study period spanned 19 years, the four turtles that were observed on both sites during this period amounted to 0.21 turtles nesting on both sites per season on average, and amounted to 0.0025 movements between the two nesting sites per turtle per season on average. Despite the deficiencies of the available data, mainly due to the fact that not all seasons were completely and regularly monitored, these calculations point to a nearly complete demographic independence of the two nesting female populations, as supported by the genetic data.
With regard to the connection between Atol das Rocas and Trindade Island nesting females, only one reproductive female green turtle was recorded at both sites. This also seems to indicate a nearly complete demographic independence of the two nesting female groups. This is consistent with the genetic study of Bjorndal et al. (Reference Bjorndal, Bolten, Moreira, Bellini and Marcovaldi2006) that revealed, through mtDNA analyses, a separation between Trindade and the Atol das Rocas–Fernando de Noronha system.
Given the virtual demographic independence of the Atol das Rocas green turtle nesting female colony, the decrease in the CCL of these turtles (Figure 6) could be seen as an indication of the recruitment of new females to that nesting population. Notwithstanding the great uncertainty in the trend analysis of the annual number of nests (Figure 5), this would open up the possibility that an upward trend in the annual number of turtles nesting on Atol das Rocas might be occurring, due to an influx of new turtles into the nesting population. In Sergipe and Bahia, Brazil, a 10-fold increase in the annual number of olive ridley (Lepidochelys olivacea) nests between 1991/1992 and 2002/2003 was associated with a decrease in CCL over the years (da Silva et al., Reference da Silva, de Castilhos, Lopez and Barata2007). The CCL at which sea turtles of a given species reach maturity could be explained by a combination of genetic and environmental factors, and there is not a definite size at which the turtles of a given population mature (Carr & Goodman, Reference Carr and Goodman1970). Variation of the CCL distribution of a nesting population of sea turtles over time could be due to different causes, such as differential feeding over time among immature turtles living in different feeding areas, or differential mortality among subgroups of adult turtles living in different feeding areas and subject to different mortality risks in each of these areas (Hatase et al., Reference Hatase, Goto, Sato, Bando, Matsuzawa and Sakamoto2002a, Reference Hatase, Takai, Matsuzawa, Sakamoto, Omuta, Goto, Arai and Fujiwarab). The possibility exists that the variation of the CCL distribution of nesting sea turtles over time could also be due to the operation of density-dependent maturation mechanisms or selective processes induced by changes in mortality patterns, as it has been observed in fishes (Law, Reference Law2000).
The mean clutch size at Atol das Rocas, 121.5 eggs, is very similar to the ones observed at Trindade (mean = 120.1, SD = 30.2, N = 333: Almeida et al., Reference Almeida, Moreira, Bruno, Martins, Bolten and Bjorndal2011a) and Ascension (mean = 120.9, SD = 26.8, N = 548: Mortimer & Carr, Reference Mortimer and Carr1987). The mean annual hatching success at Atol das Rocas, between 70.1 and 78.6%, is higher than the one reported for Ascension by Carr & Hirth (Reference Carr and Hirth1962), of 54.4%. The range of mean annual incubation periods at Atol das Rocas (54.6–62.4 days) includes the mean incubation period for Ascension presented by Carr & Hirth (Reference Carr and Hirth1962), of 59.5 days. However, it should be noted that Carr & Hirth's (1962) mean hatching success and mean incubation period were obtained from just 10 nests. While clutch size is essentially an adaptive life history characteristic, apparently not influenced by immediate environmental factors for one same green turtle population (Bjorndal & Carr, Reference Bjorndal and Carr1989), hatching success depends in large measure on local environmental conditions on the nesting beach (Mortimer, Reference Mortimer1990). This could explain to a large degree the differences in hatching success between Atol das Rocas and Ascension. Among green turtle populations in the Atlantic–Mediterranean system, less relative variation exists in clutch size than in hatching success (Hirth, Reference Hirth1997). The incubation period of sea turtle clutches is strongly dependent on sand temperature (Ackerman, Reference Ackerman, Lutz and Musick1997), which can be affected by the sand albedo and other physical characteristics of the beach, besides the local air temperature (Hays et al., Reference Hays, Ashworth, Barnsley, Broderick, Emery, Godley, Henwood and Jones2001, Reference Hays, Broderick, Glen and Godley2003).
Green turtles nesting on Atol das Rocas were not tagged or checked for tags at every emergence even in the completely and regularly monitored seasons (Table 1). As a consequence of the incomplete tagging in the completely and regularly monitored seasons, and also of the fact that some seasons were incompletely monitored or even not monitored at all (see the section ‘Study area and period'), we have not attempted to classify the nesting turtles as either recruits or remigrants (Carr et al., Reference Carr, Carr and Meylan1978).
Two estimates of the mean clutch frequency on Atol das Rocas are presented here: the mean OCF, 4.3 nests per turtle per season, and the mean ECF, 5.2 nests per turtle per season. The first estimate is an underestimate of the true mean clutch frequency, since some clutches could not be assigned to a nesting female due to incomplete tagging (Table 1). The second estimate should be closer to the true mean clutch frequency, as observed internesting intervals greater than 17 days were taken as signs of nesting events missed by the field team, and the clutch frequency was corrected accordingly. However, the estimation method, based on an analysis of observed internesting intervals, could not deal with missed nesting events that happened either before or after the observed ones. Thus the mean ECF should also be regarded as an underestimate of the true mean clutch frequency, albeit closer to it than the mean OCF. Both the mean OCF and the mean ECF at Atol das Rocas are higher than both the mean OCF at Ascension, 2.2 nests per turtle, and the mean ECF there, 3.0 nests per turtle, which was obtained also through an analysis of internesting intervals (Mortimer & Carr, Reference Mortimer and Carr1987). The mean clutch frequency is a component in a usual method for the estimation of the number of turtles nesting in a season, which can be obtained by dividing the total number of nests in the season by the mean clutch frequency (Mortimer & Carr, Reference Mortimer and Carr1987). In that way, the availability of good estimates of the mean clutch frequency can be important for population assessments.
Observed internesting intervals longer than 17 days could be a natural characteristic of green turtles nesting on Atol das Rocas, as was suggested by Schulz (Reference Schulz1975) for green turtles nesting in Surinam. Water temperature could possibly take part in an explanation of long internesting intervals. Relatively low water temperatures in the internesting habitat of the turtles could increase the internesting interval, possibly by interfering with physiological processes of the turtles including egg development. Internesting intervals longer than 17 days were observed for green turtles in Japan associated with relatively low water temperatures (Sato et al., Reference Sato, Matsuzawa, Tanaka, Bando, Minamikawa, Sakamoto and Naito1998). Atol das Rocas, located quite close to the Equator, has relatively high water temperatures: in 1990–2008, monthly mean sea surface temperatures around the atoll (at 4°S 34°W) in December–July (this period includes the nesting season (December–May) and two months more, to allow for clutch incubation) were in the range of 26.5–29.1°C (data obtained from the Extended Reconstructed Sea Surface Temperature database (ERSST.v3), National Climatic Data Center, USA, http://www.ncdc.noaa.gov/oa/climate/research/sst/ersstv3.php, downloaded on 3 April 2011: Smith et al., Reference Smith, Reynolds, Peterson and Lawrimore2008). These temperatures are at the high end of the range of temperatures presented in figure 1 of Hays et al. (Reference Hays, Broderick, Glen, Godley, Houghton and Metcalfe2002), which indicates an inverse relationship between the internesting interval and water temperature by means of data from three different countries and two sea turtle species (loggerheads (Caretta caretta) and green turtles). This suggests that water temperature is not likely a factor in the explanation of long internesting intervals at Atol das Rocas.
Alternatively, the long observed internesting intervals could be an artefact of the data collection on the beach. As the tagging efficiency was below 100% even in the completely and regularly monitored seasons (Table 1), some turtles were randomly missed by the field team at the moment of nesting, so that some nesting events could not be related to individual turtles and could not contribute to internesting interval calculations. A random skipping of some nesting events would tend to produce observed internesting intervals relatively close to integral multiples (‘double' intervals, ‘triple' intervals, etc.) of the average of the actual internesting intervals. The multimodal pattern observed in Figure 8, with modes at multiples of 11 days approximately (for observed internesting intervals equal to or greater than 8 days), is compatible with the hypothesis that a random skipping of some nesting events might have occurred, and lends support to the assumption that the actual internesting intervals are approximately in the range of 8–17 days.
The estimated mean internesting interval at Atol das Rocas, 11.8 days, was relatively close to the one estimated at Trindade, 12.3 days (Almeida et al., Reference Almeida, Moreira, Bruno, Martins, Bolten and Bjorndal2011a), but somewhat lower than the one for Ascension Island, 13.9 days (Mortimer & Carr, Reference Mortimer and Carr1987). But it should be noted that these means were calculated on the basis of a different range of days in each case: 8–17 days for Atol das Rocas; 8–18 days for Trindade (Almeida et al., Reference Almeida, Moreira, Bruno, Martins, Bolten and Bjorndal2011a); and 11–18 days for Ascension (Mortimer & Carr, Reference Mortimer and Carr1987). In each of the three nesting areas there were observed internesting intervals outside the respective range used for the calculation of the mean. Differences in internesting intervals among nesting areas could be due, at least in part, to differences in local water temperature (Hays et al., Reference Hays, Broderick, Glen, Godley, Houghton and Metcalfe2002).
With regard to the observed remigration period, the results obtained for Atol das Rocas are similar to those obtained for Trindade (Almeida et al., Reference Almeida, Moreira, Bruno, Martins, Bolten and Bjorndal2011a): at both nesting sites, the most common observed remigration period (around 50% of them) was 3 years; 2 and 4 years were also relatively common, and remigration periods of one year were not observed. On Ascension Island, remigration periods of one year were also not observed, and while 3 years was the predominant observed remigration period (around 40% of them), periods of 4 years were observed in nearly equal proportion (Mortimer & Carr, Reference Mortimer and Carr1987). However, our results on the remigration period should be viewed cautiously, because: (1) some seasons were only incompletely monitored; (2) there was little tagging activity in 1998 and 1999; and (3) for the seasons when fieldwork was carried out, the turtles were not tagged, or checked for tags, at every emergence. Observed remigration periods longer than 5 years could possibly be due to one or more unobserved remigrations between two seasons for which the turtle was observed on Atol das Rocas. Even so, some females could in fact take longer than 5 years to remigrate. Tag loss and turtle mortality should also be considered when analysing remigration intervals (Mortimer & Carr, Reference Mortimer and Carr1987; Almeida et al., Reference Almeida, Moreira, Bruno, Martins, Bolten and Bjorndal2011a).
The average remigration period can be used to obtain an estimate of the average total number of reproductively active females in a population from the average annual number of nesting turtles (Richardson et al., Reference Richardson, Bell and Richardson1999), as we have done in the present paper. Alternatively, an estimate of the average total number of reproductively active females could be obtained by multiplying the average annual number of nesting turtles by a numerical value obtained from the remigration period distribution by the formula presented by Carr et al. (Reference Carr, Carr and Meylan1978). Remigration periods of green turtles could be dependent on sea surface temperature (Solow et al., Reference Solow, Bjorndal and Bolten2002) and on food availability at feeding areas, which could be linked to environmental conditions there, with possible inter-annual variability (Hays, Reference Hays2000; Broderick et al., Reference Broderick, Godley and Hays2001). Remigration periods might also be affected by the length of the migrations performed by the turtles of a given population (Carr et al., Reference Carr, Carr and Meylan1978), as longer migrations would deplete further the energy stores of the turtles, which would need to spend longer periods of time on average at their feeding areas in order to replenish them.
The maximum observed reproductive lifespan on Atol das Rocas, 16 years, is equal to the one observed on Trindade Island (Almeida et al., Reference Almeida, Moreira, Bruno, Martins, Bolten and Bjorndal2011a). A noteworthy result obtained at Atol das Rocas is the high proportion of turtles (77.5% of those first tagged until 2003) that were seen in just one season. This could be a sign of a low level of survivorship among adult females, although, once again, the incomplete tagging during the nesting seasons and tag loss could explain this result at least in part. In the Atlantic, low levels of annual survivorship were found for green turtles nesting at Tortuguero, Costa Rica, in 1959–1972, which was attributed to human exploitation (Bjorndal, Reference Bjorndal1980); a higher estimate of the survivorship of the Tortuguero green turtle nesting population was obtained by Solow et al. (Reference Solow, Bjorndal and Bolten2002) on the basis of data gathered between 1971 and 2000.
The feeding areas of the green turtles nesting on Atol das Rocas are currently unknown. Except in very rare instances, adult green turtles are not seen around the atoll outside the nesting season. However, the recovery in north-eastern Brazil of two dead stranded turtles that had nested on Atol das Rocas suggests that this region could be a feeding area for the Atol das Rocas nesting population. The north-eastern Brazilian coast is a feeding area for green turtles that nest on Ascension Island, Surinam, French Guiana and possibly in the Caribbean region (Pritchard, Reference Pritchard1976; Mortimer & Carr, Reference Mortimer and Carr1987; Lima et al., Reference Lima, Melo, Severo and Barata2008), most notably the State of Ceará coast, where green turtles feed on algae (Ferreira, Reference Ferreira1968). Green turtles nesting on Atol das Rocas could have several distinct feeding areas, as occurs with the population that nests at Tortuguero, Costa Rica (Carr et al., Reference Carr, Carr and Meylan1978).
It has been hypothesized (Carr & Goodman, Reference Carr and Goodman1970) that the body size of green turtles of a given population might be positively related to the length of their breeding migrations. When comparing Atol das Rocas with Ascension Island, green turtles nesting on each of theses sites have approximately the same average CCL (Mortimer & Carr, Reference Mortimer and Carr1987; this study), and the average remigration periods seem to be relatively close: 3.4 years for Atol das Rocas (this study), and approximately 3.8 years for Ascension (calculated on the basis of data taken from figure 6 in Mortimer & Carr, Reference Mortimer and Carr1987). If the feeding area of the Atol das Rocas population were indeed the north-eastern Brazilian coast, which is actually the feeding area of the green turtles nesting on Ascension (Mortimer & Carr, Reference Mortimer and Carr1987), a situation would arise where two South Atlantic green turtle populations would have approximately the same average body size (when measured by the CCL) and also approximately the same average remigration period, despite the fact that they nest on sites at quite different distances from their respective feeding areas, since Atol das Rocas is located at about 230 km from the Brazilian coast while Ascension is located at about 2250 km from there, a tenfold difference in distance. However, as stated above, the feeding areas of the Atol das Rocas colony are in fact currently unknown. Furthermore, the possibility exists that the reproductive females of the two populations might differ in body mass or some other morphological or physiological characteristic not measured yet.
Almeida et al. (Reference Almeida, Moreira, Bruno, Martins, Bolten and Bjorndal2011a) presented data on annual nesting numbers (relative to different periods of time) for nine major green turtle colonies in the Atlantic, from the largest one, Tortuguero, Costa Rica, with about 104,000 nests per year on average in 1999–2003, to the smallest one, Aves Island, Venezuela, with 1350–2700 nests per year in 2006. When compared to these major nesting sites in the Atlantic, Atol das Rocas hosts a relatively small green turtle colony. The mean annual number of nests at Atol das Rocas, 335 nests, is about 10 times smaller than the mean annual number at Trindade Island, the largest green turtle rookery in Brazil, which holds the seventh place on the ordered list of nine major nesting sites in the Atlantic presented by Almeida et al. (Reference Almeida, Moreira, Bruno, Martins, Bolten and Bjorndal2011a). However, as stated before, mtDNA genetic analyses of nesting green turtles indicate that there is a significant difference in haplotype frequencies between the Atol das Rocas–Fernando de Noronha system and Trindade Island (Bjorndal et al., Reference Bjorndal, Bolten, Moreira, Bellini and Marcovaldi2006). This places Atol das Rocas, together with Fernando de Noronha, in a distinct position with regard to the genetic structure of green turtles in the Atlantic, and it makes the conservation of the Atol das Rocas and Fernando de Noronha nesting populations of importance for the preservation of genetic diversity of green turtles.
ACKNOWLEDGEMENTS
This article is dedicated to Taisi Maria Sanches in memoriam. We thank the staff of the Atol das Rocas Biological Reserve for their support to this research, and also all the TAMAR personnel who performed the fieldwork. We also thank Karen Bjorndal, Alexsandro dos Santos, Soraya Bruno and Antonio Almeida for helping us to understand some features of our data, Antonio Almeida, Eugenia Naro-Maciel and Karen Bjorndal for kindly reviewing the manuscript and for suggestions that helped us to improve the text, and the two anonymous referees, whose thoughtful comments further helped us to improve the manuscript. This paper made use of the Sea Turtle Online Bibliography maintained by the Archie Carr Center for Sea Turtle Research, University of Florida, USA. Projeto TAMAR, a conservation program of the Brazilian Ministry of the Environment, is affiliated with the Chico Mendes Institute for Biodiversity Conservation (ICMBio), is co-managed by Fundação Pró-TAMAR, and officially sponsored by Petrobras.