Introduction
Enhancement of production efficiency through improved female reproductive performance is of major importance to the pork industry. Direct selection on prolificacy has led to relatively low responses, since this trait presents a low heritability: 0.1 (Bichard and David, Reference Bichard and David1985). Thus, different types of studies have been undertaken to elucidate and improve the different components of this complex trait. The two main approaches are QTL studies and candidate gene studies (Buske et al., Reference Buske, Sternstein and Brockmann2006). However, until now, no gene explaining a major effect on reproductive performance has been found in pigs, suggesting that this is a complex phenomenon. Possibly for this reason, authors have chosen to study the different components of reproductive performance like ovulation rate (Knox, Reference Knox2005), perinatal mortality (van der Lende et al., Reference van der Lende, Knol and Leenhouwers2001) or maternal qualities (Algers and Uvnas-Moberg, Reference Algers and Uvnas-Moberg2007) in isolation.
Ovulation rate is determined by a highly dynamic process involving recruitment, development, maturation and atresia of antral follicles. Follicular development depends on hormonal feedback mechanisms between the hypothalamus, the anterior lobe of the pituitary gland and the ovaries, which have also been shown to produce molecules with paracrine and autocrine functions (Foxcroft and Hunter, Reference Foxcroft and Hunter1985; Foxcroft et al., Reference Foxcroft, Hunter and Grant1989). Gonadotropins and local factors including steroids, growth factors and other regulatory peptides are known to be involved in the maturation of follicles. Follicular development is thus a complex process and requires the coordinated expression of a large number of genes.
In this study, granulosa cells were chosen as they constitute an important compartment in the mammalian ovarian follicle and are easy to isolate. They actively participate in endocrine function of the ovaries by secreting oestradiol or progesterone in response to FSH or LH stimulation (Duda, Reference Duda1997).
Microarray analysis is an increasingly developing technique that enables the simultaneous expression screening of thousands of genes. These analyses have already been used for the discovery of genes involved in pig female reproductive performances: Caetano et al. (Reference Caetano, Johnson, Ford and Pomp2004) studied whole follicle transcriptome from two pig lines differing in their ovulation rate, Agca et al. (Reference Agca, Ries, Kolath, Kim, Forrester, Antoniou, Whitworth, Mathialagan, Springer, Prather and Lucy2006) focused on early luteinisation process and Whitworth et al. (Reference Whitworth, Agca, Kim, Patel, Springer, Bivens, Forrester, Mathialagan, Green and Prather2005) studied early embryonic development.
The current research, however, focuses on the expression profile of granulosa cells that may assist in the identification of the transcriptome involved in late ovarian follicular development and lead to an understanding of the molecular mechanisms involved in the ovulatory process and therefore prolificacy.
In an attempt to validate the biological data in microarray analysis, an important aspect is to identify the sources of variation within the data sets. Some statistical approaches include fixed or mixed effect models that give a full account for sources of variation in the context of statistical design of experiment (Kerr and Churchill, Reference Kerr and Churchill2001). By accounting for these variations, different effects due to membranes, probes, genes and tissue samples can be estimated and systematically removed by means of the ANOVA approach. The data normalisation and inference for differentially expressed genes have been integrated into a single step in a linear fixed effect model. Although the ANOVA approach seems promising in theory, it is computationally expensive and becomes almost infeasible when the number of genes in the model gets relatively large. Alternatively, a two-step procedure was proposed by Wu et al. (Reference Wu, Kerr, Cui and Churchill2003). However, some of the factors in the model can be better modelled as random effects, such as the variation introduced through the use of multiple membranes for hybridisation. In general, the linear mixed model (LMM) methodology provides both a formal framework and a flexible tool for identifying systematic sources of variation and differential gene expression.
An extension of the ANOVA approach in terms of the mixed effect model is outlined by Wolfinger (Wu et al., Reference Wu, Kerr, Cui and Churchill2003), which has been performed on real data sets (Churchill and Oliver, Reference Churchill and Oliver2001; Jin et al., Reference Jin, Riley, Wolfinger, White, Passador-Gurgel and Gibson2001). This method, using two interconnected sequential LMMs, is applied and extended to take into account the heterogeneity of variance on our data.
The objective of this paper is to state the feasibility of a transcriptomic protocol for the study of folliculogenesis in the pig. A pilot study including few animals but several technical replicates is analysed. The high sensitivity of nylon membranes hybridised with radioactively labelled probes (Bertucci et al., Reference Bertucci, Bernard, Loriod, Chang, Granjeaud, Birnbaum, Nguyen, Peck and Jordan1999) is an ideal choice as follicular cells are difficult to collect. The first goal was to check the low level of technical variability with LMM analysis and the second was to highlight relevant genes that might be involved in the folliculogenesis process. For this, we selected genes via an LMM analysis and assessed their relevancy with multivariate statistical tools (principal component analysis (PCA) and unsupervised hierarchical clustering (UHC)). The predictive power of the selected genes was then assessed with a random forest (RF) analysis (Breiman, Reference Breiman2001) (http://www.stat.berkeley.edu/users/breiman/RandomForests/). The biological significance of these results is discussed.
Material and methods
Data
Biological model
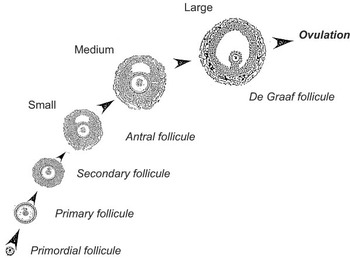
Large White × Landrace sows were reared at the Unité Mixte de Recherche SENAH in Saint-Gilles (France) and treated with a progestagene used in cycling animals (Regumate™; Roussel-Uclaf, Romainville, France, during 18 d, 20 mg/d). Sows were ovariectomised 24 or 96 h after the end of the treatment. These stages correspond to the early and mid-follicular phase. Ovaries were dissected, follicles were extracted and granulosa cells were recovered as individual samples, in 200 μl of MEM121/F12 (v/v) medium (Gasser et al., Reference Gasser, Mulsant and Gillois1985). For each sample, 5 μl of the granulosa-cell suspension was smeared onto histological slides, fixed for 10 min in methanol–formaldehyde–acetic acid (80 : 15 : 5), and subsequently stained with Feulgen, as previously described (Besnard et al., Reference Besnard, Pisselet, Monniaux, Locatelli, Benne, Gasser, Hatey and Monget1996). The quality of each follicle was assessed by microscopic examination of smears, using classical histological criteria as described by Monniaux (Reference Monniaux1987). Healthy follicles were classified as small (S), medium-sized (M) and large (L) according to their diameter (1–2, 3–3.5 and 5–6.5 mm, respectively) (Figure 1, adapted from Erickson et al. (Reference Erickson, Magoffin, Dyer and Hofeditz1985) with kind permission).
Scheme of folliculogenesis. Follicules grow from a primordial type to De Graaf type prior to ovulation. The follicules of the current analysis (small, medium-sized and large) correspond to Antral and De Graaf types.

Healthy follicles from the same class were pooled before RNA extraction. Two pools of small follicles (about 20 follicles), one pool of medium-sized follicles (about 10 follicles) and four pools of large follicles (five follicles each) were utilised for the microarray analysis. RNAs were extracted from these seven pools and their qualitative and quantitative qualities were checked, as described by Bonnet et al. (Reference Bonnet, Frappart, Dehais, Tosser-Klopp and Hatey2006).
Microarray description
Spotting process, hybridisation conditions and image quantification have been detailed by Ferré et al. (Reference Ferré, Liaubet, Concordet, Sancristobal, Uro-Coste, Tosser-Klopp, Bonnet, Toutain, Hatey and Lefebvre2007). Briely, PCR products of cDNA inserts were spotted onto nylon membranes. Inserts came from 1152 clones from the AGENAE normalised multi-tissue cDNA library (Bonnet et al., Reference Bonnet, Iannuccelli, Hugot, Benne, Bonaldo, Soares, Hatey and Tosser-Klopp2008a). Spikes (external genes) and negative controls were also spotted. Single or triplicate membranes were obtained by spotting each amplified insert once or three times, respectively. The GEO platform files for these chips are posted at: http://www.ncbi.nlm.nih.gov/projects/geo/query/acc.cgi?acc=GPL3970 and http://www.ncbi.nlm.nih.gov/projects/geo/query/acc.cgi?acc=GPL3971.
The amount of spotted DNA was estimated by hybridising the membranes with a vector probe. Complex probes were obtained by the reverse transcription and 33P labelling of the extracted RNAs and were hybridised onto microarrays. Image analysis of complex and vector hybridisations were performed with BZscan software (Lopez et al., Reference Lopez, Rougemont, Loriod, Bourgeois, Loi, Bertucci, Hingamp, Houlgatte and Granjeaud2004). The Q Im Cst values that correspond to constant diameter and conventional pixel integration were used.
Experimental design
Four large, one medium and two small follicle pools were considered. For each follicle pool, two radioactive labellings were performed. Each membrane was exposed 16 h (to avoid saturation of the signal of highly expressed genes) and 28 h (to get some signal from lowly expressed genes). Each probe was hybridised on a single and on a triplicate membrane (except for one named L2172, which was labelled only once and hybridised onto two single membranes), so that four spots were available for each gene (and two spots for L2172), for a given RNA and a given radioactive labelling. Finally, data consisted in (six RNA × two labellings) + (L2172 RNA × 1 labelling) = 13 probes, 26 hybridisations and 52 images. The data were posted at http://www.ncbi.nlm.nih.gov/projects/geo/query/acc.cgi?acc=GSE5299.
Gene annotation
Clone sequences were annotated with the automatic procedure used in SIGENAE database (http://www.sigenae.org/). Then, Iccare software (Muller et al., Reference Muller, Denis, Gentzbittel and Faraut2004) (http://bioinfo.genopole-toulouse.prd.fr/Iccare/), UniGene (http://www.ncbi.nlm.nih.gov/sites/entrez?db=unigene) and TIGR (http://compbio.dfci.harvard.edu/tgi/cgi-bin/tgi/gireport.pl?gudb=pig) were used. In case of conflicting results, the annotation is stated as putative.
Methods to validate the biological experiment
Linear mixed model analysis
The data were analysed on the logarithmic scale using an LMM analysis. The pre-processing step that is usually performed before the statistical analysis to remove experimental bias is directly integrated into the LMM analysis.
An LMM is composed of two parts: fixed and random effects. The fixed effects considered are the type of follicle (two levels: L or M/S, as the number of samples in M and S is too small and M and S share biological similarities), the radioactive labelling (two levels), the spot type (five levels: replicates one to three of cDNA library and two groups of reference spots including blank DMSO), the hybridisation rank of the array (three levels), the exposure time (16 or 28 h) and two covariates, namely the logarithm of the background intensity and the logarithm of the vector probe intensity.
The random effects included microarray (14 microarrays), print-tip (32 print-tips by microarray), mRNA within type of follicle (three levels) and residual effects, and all are assumed to be normally distributed random variables with zero means and homogenous variance components σ 2M, σ 2P, σ 2R and σ2ε, respectively. The gene effect is also assumed to be normally distributed with zero mean but with heterogeneous variances (σ G,h2), indexed by the type of follicle (h = L or M/S). All these random effects are assumed to be independent both across their indices (h) and between each other.
Inference was based on the maximum likelihood (ML) and on the restricted estimator maximum likelihood procedures (REML (Patterson and Thompson, Reference Patterson and Thompson1971)) for the location and the dispersion parameters, respectively. Computations were made using the MIXED procedure of the Statistical Analysis Systems Institute (SAS) software (SAS, 1999).
The ‘gene’ factor was considered a random effect in the first analysis devoted to quantifying the gene variability, as opposed to technical variability. It was treated as a fixed effect in our second analysis where the aim was to infer differential genes. In this latter case, corrections for multiple testing were performed with the estimation of false discovery rate (FDR (Benjamini and Hochberg, Reference Benjamini and Hochberg1995)). The genes with the lowest P-value, i.e. that are declared regulated, were kept for further analysis.
Multivariate analyses
We applied PCA and UHC to the above-mentioned selection of the most significant genes, in order to graphically summarise the results given by the LMM analysis. The aim of PCA is to reduce dimensionality, operating a projection of the data from a high-dimensional space (equal to the number of genes) to a lower dimensional one (usually two or three), making the data more accessible to visualisation and analysis (see Raychaudhuri et al. (Reference Raychaudhuri, Stuart and Altman2000) and Yeung and Ruzzo (Reference Yeung and Ruzzo2001) for more details).
UHC, gathering genes into a reduced number of groups, has been a widely used graphical tool in microarray analysis since Eisen et al. (Reference Eisen, Spellman, Brown and Botstein1998). We chose the Euclidian distance in both genes and membranes with the Ward criterion (Seber, Reference Seber1984).
To quantify the predictive value of the most significant genes from the LMM analysis, a RF analysis (Breiman, Reference Breiman2001) was performed. RF is a classification method that aggregates classification or regression trees to select discriminative (also called predictive) genes. Application of RF on microarray data can be found in Diaz-Uriarte and Alvarez de Andres (Reference Diaz-Uriarte and Alvarez de Andres2006) and Le Cao et al. (Reference Le Cao, Goncalves, Besse and Gadat2007).
PCA, UHC and RF were performed using the R software (http://www.r-project.org/) (Liaw and Wiener, Reference Liaw and Wiener2002).
Results
Test of fixed effects
All fixed effects included in the LMM were significant. The intensities obtained at the first hybridisation were globally larger than those obtained at the second. As expected, the intensities obtained at 16 h of exposure were generally lower than those at 24 h. The intensities of the spots increased both with the local background noise and with the intensity of the vector probes, and hence with the quantity of cDNA spotted onto the membrane. The ‘type of follicle’ effect is not significant, meaning that whatever the type of follicles, the genes are expressed at the same level on average. The ‘hybridisation rank of the membrane’ effect was significant, due to the significant difference in ranks 0 and 1 for the first hybridisation. The other differences in the rank of hybridisation of the membrane were not significant at the 5% level. The spot type also had a global significant effect due to the difference between the cDNA spots and the reference spots (mainly blank DMSO that have a lower average signal level). No significant difference between the three replicates of the cDNA library was observed.
Variance components
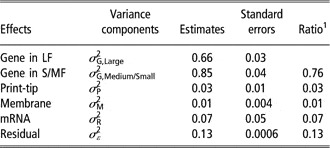
For each random variable, the values of the estimated variance components, the standard error and the ratio (ratio between the variance of the random variable considered and the total variance) are given in Table 1. We showed that 76% of the total variability was due to gene effect, 7% to mRNA extraction effect, 3% to print-tip effect, 1% to the membrane effect and only 13% of the variability remains unexplained by the model. The gene variances in L and S/M follicle σ 2G,L and σ 2G,S/M were significantly different from 0 and σ G,S/M2 (equal to 0.85) and was significantly higher than σ G,L2(z-test, P = 0.001). The variances of print-tips, membranes and especially mRNA effects were very small with moderate standard errors. The low variability of the mRNA effect might be surprising but the number of extractions for each type of follicle (three for S/M follicles and four for L follicles) was low, which explains why the estimation of this variance component was not precise enough.
Estimates and standard errors of the variance components

LF = large follicles; S/MF = small/medium follicles.
1Ratio of variance estimates to the estimated total variance, i.e. proportion of variance dispatched in each source of variation.
Differential expression
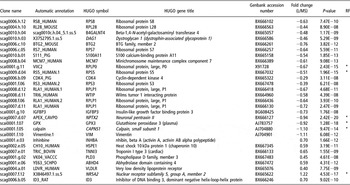
The 29 most differentially expressed clones are listed in Table 2, with a proposed annotation. These were assessed based on Fisher F tests specifying gene as a fixed effect in the LMM, and a significance threshold of P-value <10−8 corresponding to a FDR < 4 × 10⁻⁶. This threshold was chosen because biologists are interested in a very small subset of genes that can be easily visualised with graphical and statistical tools. Among the 29 differentially expressed genes, 21 are down-regulated in L follicles, whereas eight are over-expressed. Terminal follicular growth (L follicle stage as opposed to S/M stages) is associated with decreased expression of genes implicated in protein translation (nine clones are subunits of ribosomal proteins: RPS8, RPL28, RPS7, RPLPO, RPS5, RPS3 and RPLP1), ion binding (S100A11) and cell shape (VIM, CAPNS1 and DAG1) and the over-expression of genes implicated in lipid metabolism and steroidogenesis (NR5A2, VLDL and INHBA).
List of the 29 genes selected in a Fisher test, with a <10−8P-value

HUGO = human genome organisation; RF = random forest.
The clone name, automatic annotation and Genbank accession numbers are listed in columns 1, 2 and 5, respectively. The HUGO (http://www.gene.ucl.ac.uk/nomenclature/) gene symbol and HUGO gene title are given in columns 3 and 4, in italics when the annotation is putative. The fold change between large and medium + small follicles is given in column 6, with its P-value. In the last column, an asterisk is present if the clone was selected in the random forest analysis.
Multivariate analyses
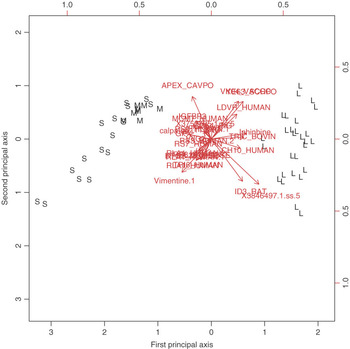
A PCA was performed on these 29 most significant genes. The scree graph of eigenvalues (not shown) showed a large drop between the first- and the second-ordered eigenvalues. Indeed, the first principal axis contains most of the total variance (68%) and the second only 8%. Figure 2 shows that the first axis actually separates L from S/M follicles. Genes such as CH10_HUMAN (HSPE1) or Inhibine (INHBA), represented as vectors pointing towards the L follicles, are all up-regulated in the L follicles. The calpaïne (CAPNS1), on the other hand, is up-regulated in the M and S follicles. The second axis in Figure 2 tends to separate a group of S follicles that are technical replicates of the follicle number S.2165, from another group with replicates M.2163 and S.2174. This suggests that these latter follicles have closer expressions for the 29 most significant genes than the two S follicles S.2165 and S.2174 themselves.
Biplot of the principal component analysis performed on the top-29 differentially expressed genes. The first two principal axes explain 68% and 8% of the total variability.

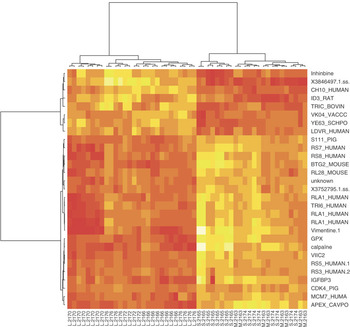
The heat map resulting from the hierarchical clustering of the top-29 genes is plotted in Figure 3. Two clusters appeared on the membranes, clearly separating L from S/M follicles. Replicates from the same follicle were clustered together, except for S.2163 and L.2176. This shows that the technical replicates are similar compared to animal replicates or intrinsic gene variation. Note that the same conclusions were drawn with PCA. Two clusters on the gene clustering separated up-regulated from down-regulated genes on the L follicles.
Heat map display of unsupervised hierarchical clustering results (Ward method and Euclidian distance) of the top-29 most significant genes. Genes are displayed in lines and membranes in columns. The light (respectively, dark) colour represents up- (respectively, down-) regulated genes.

Predictive value of the most differentially expressed genes
RF analysis does not require a fine-tuning of the parameters to achieve the best performance. We chose 5000 trees and a number of input variables tried at each split set to the default value in R (equal to  , where p is the total number of genes). The estimate of the classification error rate was 7.69%. The 28 L follicles and the 16 S follicles were all classified without error in their respective classes. Only four out of eight M follicles were correctly classified.
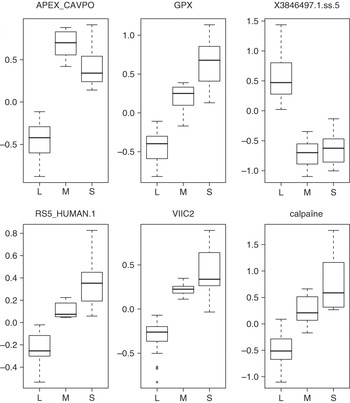
The discrimination power of each gene in the forest is given by two importance measures proposed in the R package. Both measures were similar (not shown). The top genes hold useful information concerning their discrimination properties, as shown in Figure 4. APEX_CAVPO (NPTX2), VIIC2 (RPLPO), RS5_HUMAN.1 (RPS5), GPX (GPX3) and calpaïn (CAPNS1) are all down-regulated in L while the clone X3846497.1.ss.5 (NR5A2) is up-regulated in L. These boxplots also show that there is no clear discrimination that can be made between S and M. The regulation of these six genes has been investigated by real-time quantitative PCR and all the regulations were confirmed (Bonnet et al., Reference Bonnet, Le Cao, San Cristobal, Benne, Robert-Granié, Law-So, Fabre, Besse, De Billy, Quesnel, Hatey and Tosser-Klopp2008b) and personal communication.
Boxplots of some of the most discriminant (or predictive) genes from the random forest analysis, also in the top-29 list.

Discussion and conclusion
The experiment described in this paper was designed to quantify the repeatability of one microarray technique, namely nylon membranes of cDNA from a normalised multi-tissue library. Results showed that the variability due to the technical replicates is very low compared to the global variability. The LMM allowed to apprehend and to quantify the part of variability due to various sources of variations. The part of variability due to genetic diversity represents 7%, technique measures 4% and genes 76%.
Even if the variability between animals had a low estimate, it seems difficult to generalise this result because of the limited number of animals. A further study is being planned that involves more genes (a higher density microarray), more animals and fewer technical replicates. This would allow a better confidence in the expressed genes, even if the results obtained in this pilot study are already satisfactory from a biological point of view.
It is difficult to separate S from M follicles, whereas L follicles differ greatly from S and M in their expression. The graphical displays (PCA and UHC) highlighted the particularity of this data set. This difference between S/M and L follicles can be correlated to the time of apparition of LH receptors (May and Schomberg, Reference May and Schomberg1984), which is a major event in folliculogenesis.
The different types of statistical analyses corroborate several studies on the regulation of known genes during follicular growth. For example, inhibin alpha has already been described as up-regulated (Guthrie et al., Reference Guthrie, Barber, Leighton and Hammond1994; Garrett et al., Reference Garrett, Mack, Rohan and Guthrie2000) and the over-expression of genes implicated in lipid metabolism is consistent with the increased steroidogenic activity of granulosa cells during terminal follicular development. Moreover, a decrease in protein synthesis may be associated with a decreased cellular growth rate. This is in agreement with previous studies describing a decrease in the percentage of proliferating granulosa cells during the final stages of follicular development in pigs and other species (Hirshfield, Reference Hirshfield1986; Fricke et al., Reference Fricke, Ford, Reynolds and Redmer1996; Pisselet et al., Reference Pisselet, Clement and Monniaux2000). Hierarchical clustering of the genes screened in this study allows a global view of the regulation occurring during follicular growth and is the first step in a study using a tool such as a gene ontology analysis.
The RF analysis performed well, although the number of samples was very small. The internal importance measures were relevant for the biological aim. The selected genes were indeed discriminative for the three classes. RF underlined six discriminative genes, which are of significant interest. Among them, three had already been selected by other experiments on cellular models: VIIC2 had been found in a differential hybridisation screening between control and FSH-treated pig granulosa cells (Tosser-Klopp et al., Reference Tosser-Klopp, Benne, Bonnet, Mulsant, Gasser and Hatey1997), GPX and calpaïn had been found in suppression subtractive experiments between control and FSH-treated pig granulosa cells (Bonnet et al., Reference Bonnet, Frappart, Dehais, Tosser-Klopp and Hatey2006) and may play a role during folliculogenesis. NR5A2 transcript has been shown to be up-regulated in bovine dominant follicles, compared to small follicles (Fayad et al., Reference Fayad, Levesque, Sirois, Silversides and Lussier2004), which is consistent with our findings but has not been described yet in pig ovary. NPTX2 transcript regulation has never been described in granulosa cells. However, NPTX3, from the same family, has been shown in a knockout approach (Varani et al., Reference Varani, Elvin, Yan, DeMayo, DeMayo, Horton, Byrne and Matzuk2002) to play key roles in the ovulation process and NPTX2 has been shown to be down-regulated in the endometrium from women with endometriosis (Kao et al., Reference Kao, Germeyer, Tulac, Lobo, Yang, Taylor, Osteen, Lessey and Giudice2003). It may thus play a role in folliculogenesis. RPS5 has already been described as a down-regulated gene during the differentiation process of murine erythroleukemia cells (Vizirianakis et al., Reference Vizirianakis, Pappas, Gougoumas and Tsiftsoglou1999) and it may also be a marker of development of ovarian follicles. All these hypotheses need further biological investigations, as in situ hybridisation to detail the expression pattern of these six discriminant genes.
To conclude, we have validated the nylon microarray technique on our biological model. This will lead to more ambitious studies, including more genes and more samples.
Acknowledgements
We thank the Génopole de Toulouse-Midi Pyrénées for technical support, and especially Cécile Donnadieu-Tonon. We thank the SIGENAE team (www.sigenae.org) for the help in annotation and submitting data to the GEO database. We thank Hélène Quesnel and Hervé Demay for providing ovaries. We are grateful to Hervé Lefebvre, Claire Rogel-Gaillard and Hélène Bergès for their help in generating microarrays. We also thank an anonymous referee for his helpful suggestions. This work was in part funded by the ACI IMP BIO.