INTRODUCTION
Despite the fact that various general patterns in ecology have successfully been identified at the macro-ecological scale (Gaston & Blackburn Reference GASTON and BLACKBURN2000) or at species-specific scales (e.g. habitat requirements, Beadle Reference BEADLE1966) general rules of community assembly remain elusive. Even the very existence of any assembly rule has been debated (McIntosh Reference MCINTOSH1995). Relationships between incidences of particular species and systematic (patch quality), temporal (seasonal/annual variation) and patch-specific (patch history) variables may often be idiosyncratic, rather than the majority of species responding to a few dominant factors in a similar way (Jeffries Reference JEFFRIES2003).
Relationships between community structure and environmental conditions have been described as an adaptive process under constraints that can alter how the functional traits of species match up with the environmental conditions that they encounter. Strong correlations between community composition and environmental factors would indicate that this process is indeed influential (Leibold et al. Reference LEIBOLD, HOLT, HOLYOAK, Holyoak, Leibold and Holt2005). In the absence of such a process, community composition would not correspond with environmental conditions. The distribution and abundance of species, and thus the composition of entire communities are influenced by environmental parameters (Gleason Reference GLEASON1917, Reference GLEASON1926; Neave et al. Reference NEAVE, CUNNINGHAM, NORTON and NIX1996, Parris Reference PARRIS2004, Whittaker Reference WHITTAKER1956) or biotic processes, such as competition, predation or dispersal (Clements Reference CLEMENTS1916, Connell Reference CONNELL1983, McCarthy Reference MCCARTHY1997, McCarthy & Lindenmayer Reference MCCARTHY and LINDENMAYER2000).
In the first case, particular communities simply reflect the fortuitous correspondence of independent life histories in one place and time. However, even if species-habitat relationships are strong, it would be wrong to assume that environmental variables automatically determine the composition of a given assemblage, because strong stochastic elements to recruitment in the component species and environmental fluctuations can result in variations in community composition (Ernst & Rödel Reference ERNST and RÖDEL2005, Reference ERNST and RÖDEL2006).
In the second case communities would be spatially structured i.e. sites in close proximity would have similar species assemblages (Legendre & Fortin Reference LEGENDRE and FORTIN1989). Spatial habitat heterogeneity may itself be correlated with the spatial distribution of species. This means that systematic, spatially structured, environmental variation can result in a spatial structure of species incidence. Three factors may hence contribute to the variation of community composition. These factors are environmental variation, spatial variation and spatially structured environmental variation (Bocard et al. Reference BOCARD, LEGENDRE and DRAPEAU1992).
Few studies have investigated the effects of environmental variables and spatial or biotic processes on amphibian community composition (Azavedo-Ramos et al. Reference AZAVEDO-RAMOS, MAGNUSSON and BAYLISS1999, Hecnar & M'Closkey Reference HECNAR and M'CLOSKEY1997, Hero et al. Reference HERO, GASCON and MAGNUSSON1998, Parris Reference PARRIS2004, Skelly Reference SKELLY1995) and even fewer studies have investigated the effects of anthropogenic disturbance in the same context (Ernst & Rödel Reference ERNST and RÖDEL2005, Reference ERNST and RÖDEL2006; Gardner & Fitzherbert Reference GARDNER and FITZHERBERT2007, Gardner et al. Reference GARDNER, RIBEIRO-JÚNIOR, BARLOW, SAUER ÁVILA-PIRES, HOOGMOED and PERES2007).
Among all vertebrate groups, amphibians are the one with the highest proportion of species threatened with extinction (Beebee & Griffiths Reference BEEBEE and GRIFFITHS2005, Stuart et al. Reference STUART, CHANSON, COX, YOUNG, RODRIGUES, FISCHMAN and WALLER2004) and habitat loss and fragmentation have been identified as the most direct contributors to these threats (Bowne & Bowers Reference BOWNE and BOWERS2004, Carr & Fahrig Reference CARR and FAHRIG2001, Houlahan & Findlay Reference HOULAHAN and FINDLAY2003). There is hence a clear need for studies that focus on the relationship between anthropogenic disturbance and amphibian community structure and composition.
Most of the studies on amphibian community assembly and composition have either focused on entire communities (i.e. no differentiation between different functional groups) or they have concentrated on easily assessable segments of the entire community (e.g. leaf-litter anurans only). To our knowledge, this is the first study to specifically address questions concerning community structure and the impact of anthropogenic disturbance in arboreal anuran communities, a large segment of many amphibian communities (Duellman Reference DUELLMAN1988, Reference DUELLMAN1999).
Approaches that focus on particular groups such as leaf-litter anurans or arboreal anurans might be indispensable if compositional patterns are to be analysed systematically. This is especially true with respect to patterns between community composition and environments as differences in life-history strategies, and thus potential habitat associations, may strongly affect the analysis of correlation patterns. In other words, it may be important which segment of the entire community is being analysed, as patterns may differ between different ecological groups (Ernst et al. Reference ERNST, LINSENMAIR and RÖDEL2006, Reference ERNST, LINSENMAIR, THOMAS, RÖDEL, Tscharntke, Leuschner, Guhardja and Bidin2007). Because species–environment relationships may differ greatly among different groups across scales (Cushman & McGarigal Reference CUSHMAN and MCGARIGAL2004) it is even more important to perform analyses on a group-specific basis.
In this study we therefore looked at community processes and patterns of composition in two arboreal amphibian communities in primary and disturbed forest habitats in two geographically distinct eco-regions.
In this context we specifically tested whether: (1) sites with similar environmental characteristics are also similar with respect to species composition (environmental variation) and (2) sites in close proximity are similar with respect to species composition (spatial variation). We also tested for spatial autocorrelation between sampling units (spatially structured environmental variation) and for possible variance of species occurrence due to seasonal changes (temporal signal) and disturbance of the system (disturbance signal). Because there may be large differences among amphibian species in terms of their habitat requirements and sensitivity to environmental changes, which in turn may be closely related to the geographic history of the respective site and the phylogenetic history of the respective species, we decided to take a large-scale comparative approach. We therefore compared arboreal communities of two geographically distinct eco-regions, namely the Neotropical and the Afrotropical realms.
We finally relate our results to the patterns previously found in the terrestrial anuran assemblage of the African forest site (Ernst & Rödel Reference ERNST and RÖDEL2005) and anuran assemblages of forest streams in eastern Australia (Parris Reference PARRIS2004).
METHODS
Study areas and disturbance history
The Taï National Park (TNP) in south-western Côte d'Ivoire is the largest remaining protected area of rain forest in West Africa. Our study sites (5°50′N, 7°20′W) comprised about 30 km2 of primary and exploited rain forest. In TNP anthropogenic disturbance (selective logging, coffee and cocoa plantations) ceased approximately 25 y ago. Past human influence was still visible in this area and differences between primary and exploited forest sites were marked (Ernst & Rödel Reference ERNST and RÖDEL2005). For a detailed description of TNP see Riezebos et al. (Reference RIEZEBOS, VOOREN and GUILLAUMET1994) The Mabura Hill Forest Reserve (MHFR) is situated in Central Guyana (5°13′N, 58°48′W). It comprises an area of approximately 20 km2 of primary rain forest and is part of the Wappu compartment located within a 500-km2 Timber Sales Agreement concession. Disturbed sites were located outside the reserve's core area, within the main logging concession. These sites have been logged with equal intensities (i.e. 19.5 trees or approximately 57 m3 ha−1). For a detailed description of MHFR and disturbance history of particular study sites see Ernst et al. (Reference ERNST, RÖDEL and ARJOON2005) and ter Steege et al. (Reference TER STEEGE, BOOT, BROUWER, CAESAR, EK, HAMMOND, HARIPERSAUD, VAN DER HOUT, JETTEN, VAN KEKEM, KELLMAN, KHAN, POLAK, PONS, PULLES, RAAIMAKERS, ROSE, VAN DER SANDEN and ZAGT1996).
Data acquisition
The field data were acquired between February 1999 and September 2002 (TNP) and November 2002 and September 2004 (MHFR). We collected wet-season data for a period of 11 mo in TNP; dry-season data cover 4 mo. In MHFR, wet-season data cover 8 mo and dry-season data cover 4 mo. We established 10 transects, six in primary forest, four in exploited forest (TNP) and 11 transects, six in primary forest and five in exploited forest (MHFR), respectively (Ernst et al. Reference ERNST, RÖDEL and ARJOON2005, Rödel & Ernst Reference RÖDEL and ERNST2004). In both cases, sites included in the analyses are to be considered as classical chronosequences i.e. assuming equal initial states of sites with different disturbance histories (sensu Plumptre Reference PLUMPTRE1996).
Each rectangular transect had a total length of 600 m. Transects were subdivided in 25-m subunits (SUs; 24 SUs per transect). Each SU was characterized using a set of parameters that included vegetation density at four different strata, substrate type, substrate moisture level (substrate parameters reflect water-holding capacity of habitat), percentage of leaf cover, number of woody plants in four different stem diameter at breast height (dbh) categories as a proxy for disturbance status (high number of plants in lower dbh categories = indication of disturbance; high number of plants in higher dbh categories = indication of old-growth forest with important habitat trees), and the availability of potential lentic or lotic aquatic breeding habitats (total of 14 parameters). Only parameters recorded in both eco-regions were considered in the analysis. For species-related calculations we used relative abundance values (individuals per transect hour in each SU). In a comparative analysis of amphibian monitoring programmes using transects in East Africa, West Africa (including the data presented herein), Madagascar and Borneo, we recently have shown that ≥20 independent transect walks seem to be necessary to achieve species saturation (Veith et al. Reference VEITH, LÖTTERS, ANDREONE and RÖDEL2004). During this study, each transect was walked independently at least 41 times. It is thus justified to assume that the local communities have been almost completely assessed.
Detailed descriptions and discussion of the transect design, data acquisition routine, tests for independence of sample units (test for spatial autocorrelation of environmental characteristics), and an evaluation of various methods have been published earlier (Ernst & Rödel Reference ERNST and RÖDEL2005, Rödel & Ernst Reference RÖDEL and ERNST2004). Descriptions given herein are hence restricted to relevant modifications and aspects specific to this study.
Statistical analysis
We compiled field data into three types of matrix. These were based on (1) species distribution vectors (SDM, species by SU matrix with relative species abundance as cell entry), (2) environmental characteristic vectors (ECM, habitat parameters by SU matrix with respective habitat parameter value as cell entry), and (3) geographic distance vectors (GDM, SU by SU matrix with true geographic distances between SU as cell entry). Based on these original matrices we constructed distance matrices. For SDM we used the Sørensen quantitative (Bray-Curtis) index (Faith et al. Reference FAITH, MINCHIN and BELBIN1987, Magurran Reference MAGURRAN2004). For ECM we chose the relativized Euclidian distance (RED, Legendre & Legendre Reference LEGENDRE and LEGENDRE1998). GDM was not transformed as it represents a distance matrix by definition. The analyses were performed using different sets of matrices corresponding to either primary or exploited forest and to either the entire season or the dry versus the wet season (Ernst & Rödel Reference ERNST and RÖDEL2005).
In order to optimize our model we conducted a preliminary analysis in which we tested for species' response to underlying environmental gradients using a detrended correspondence analysis (DCA) routine following Lepš & Šmilauer (Reference LEPŠ and ŠMILAUER2004). The procedure tests for unimodal versus linear species' response based on the longest gradient (maximum extent of species turnover along individual independent gradients). Values larger than 4.0 indicate unimodal response, values below 3.0 indicate linear response. If the analysis yields values between 3.0 and 4.0 both types of model describe the response reasonably well. In our case the analysis yielded a value of 3.6, indicating that neither linearity nor unimodality can fully be assumed for all species responses. Hence, linear as well as unimodal models can be applied.
In our particular case we choose Mantel tests because they allow the incorporation of spatial proximity into models of ecological communities and they are sensitive in cases where the species distribution pattern is controlled by a strong directional gradient in addition to a local spatial process (Urban et al. Reference URBAN, GOSLEE, PIERCE and LOOKINGBILL2002). This is in contrast to widely used constrained ordination techniques such as Canonical Correspondence Analysis (CCA) or Redundancy Analysis (RDA). Incorporating geographic coordinates in these kinds of model would test for a spatial trend in species composition, and would show no relationship if the population was composed of spatially restricted groups of similar individuals over the locality.
We therefore addressed the question of whether there was a correlation between the off-diagonal elements of the constructed distance matrices by performing partial Mantel tests. The test evaluates the null hypothesis of no relationship between two dissimilarity (distance) or similarity matrices via partial correlation conditioned on a third matrix. It can thus be considered a first-order partial correlation analysis conducted on three distance matrices (Smouse et al. Reference SMOUSE, LONG and SOKAL1986). In our analysis we controlled for either ECM or GDM, while permuting SDM. This allows distinguishing between spatial and environmental effects on species composition. For a thorough discussion on partial Mantel tests see Legendre (Reference LEGENDRE2000). Interpretation of Mantel test results follows the causal model predictions of Legendre (Reference LEGENDRE1993). In this paper Legendre suggests four major models explaining causal relationships between ECMs, GDMs and SDMs. Mantel tests are based on simple cross-products term and are normalized so that it is equivalent to the familiar non-parametric Pearson product-moment correlation (Legendre & Fortin Reference LEGENDRE and FORTIN1989). The magnitude of Mantel correlations is often small even when highly significant statistically (Mantel-Pearson paradox, Dutilleul et al. Reference DUTILLEUL, SOCKWELL, FRIGON and LEGENDRE2000). Simple Mantel-tests were used to test for spatial autocorrelation of sampling units using ECM and GDM (Anselin Reference ANSELIN1995). No significant correlation indicates independence of sampling units. All statistical tests were performed using the free software R (R: A language and environment for statistical computing, R Foundation for Statistical Computing, Vienna, Austria).
RESULTS
Community composition
We recorded a total of 3431 individuals of 14 species belonging to two families during 382.5 h of visual and acoustic transect sampling in TNP, and 4227 individuals of 14 species belonging to three families during 393.5 h of visual and acoustic transect sampling in MHFR, respectively.
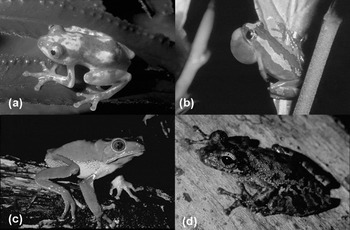
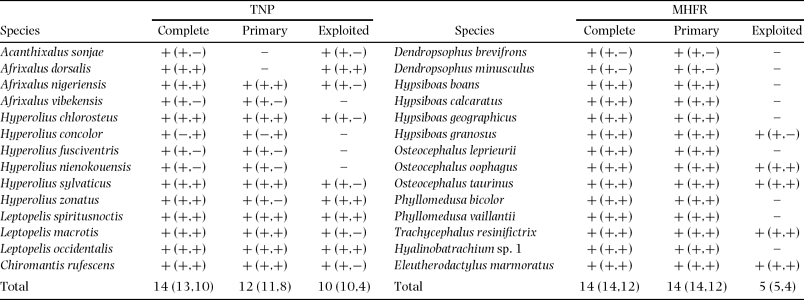
Community composition was tremendously affected by disturbance in communities of both realms. Species richness and thus composition differed significantly between communities of primary and exploited forest sites in both realms. Figure 1 depicts typical representatives of the arboreal frog communities of TNP and MHFR associated with primary and exploited forest, respectively. Yet, changes differed qualitatively between the African and the South American sites. Whereas exploited forest communities of MHFR comprised an impoverished subset of primary forest communities with no species turnover (all species recorded in exploited forest sites occurred in primary forest), species reduction in exploited forest communities of TNP was less pronounced, however species turnover occurred (two species not recorded in primary forest, Table 1). The number of species recorded was subject to seasonal changes. Of the 14 species recorded in the entire MHFR community, only 12 species could be recorded during the dry season. All 14 were recorded during the wet season and in primary forest. Only five species have been proven to occur in exploited sites, only four of them could be recorded during the dry season. Primary forest records in the dry season included all 12 species recorded during that period (Table 1).
Typical representatives of the aboreal frog assemblages of Taï National Park (a and b) and Mabura Hill Forest Reserve (c and d). (a) and (c) are restricted to primary forest; (b) occurs only in exploited forest and (d) occurs in both primary and exploited forest. Compare Table 1. Afrixalus vibekensis (a); Afrixalus dorsalis (b); Phyllomedusa bicolor (c); Osteocephalus oophagus (d).

Species composition of arboreal frog communities in Taï National Park (TNP) and Mabura Hill Forest Reserve (MHFR). Complete = recorded in primary or exploited forest transects; primary = recorded in primary forest transects; exploited = recorded in exploited forest transects. + = recorded, − = not recorded. Entries in parentheses refer to respective seasons; first entry before semicolon = wet season, second entry after semicolon = dry season. Nomenclature follows Amphibian species of the world: an online reference. Version 5.0 (1 February 2007). http://research.amnh.org/herpetology/amphibia/index.php
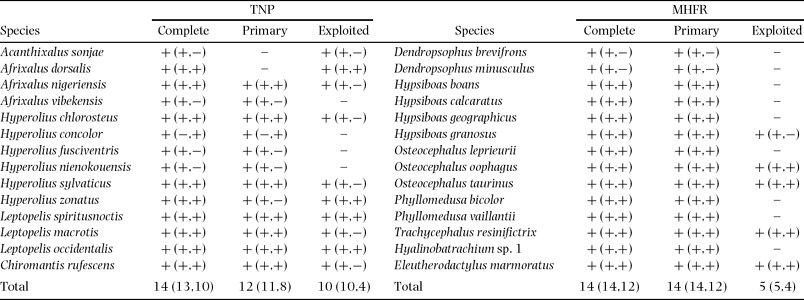
The situation in TNP was similar with respect to seasonal differences in the number of species recorded in each of the habitat types. The actual pattern, however, deviated from the pattern found in MHFR. In TNP only 10 out of the 14 species recorded in the entire TNP community were recorded during the dry season, and only 13 during the wet season. A total of 12 species was detected in primary forest and only 10 occurred in exploited forest. Eleven out of 12 primary forest species were detected during the wet season, eight species were detected during the dry season, one of which (Hyperolius concolor) was recorded during the dry season exclusively. In exploited forest, differences between rainy and dry season records were even more pronounced. During the wet season, all ten exploited forest species were recorded. Species number was reduced to only four species in the dry season. None of these species was recorded during the dry season exclusively (Table 1).
Community predictability
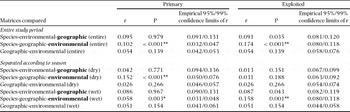
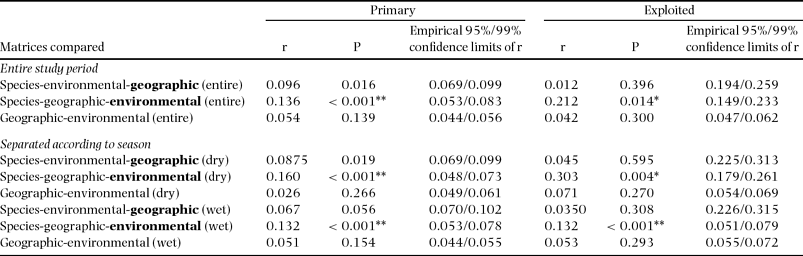
Observed predictability patterns were consistent within and between respective geographic realms (Africa versus South America) and disturbance regimes (primary versus exploited). Overall similarity between communities was low, but showed significant positive spatial correlation. In all cases tested, species distribution vector matrices (SDM) and geographic distance vector matrices (GDM) were significantly correlated when controlling for environmental effects in partial Mantel analyses, indicating that SUs in close proximity have similar species assemblages (spatial signal, Tables 2 and 3).
Partial Mantel test on comparison of three different distance matrices Mabura Hill Forest Reserve (MHFR). Entire study period, primary versus exploited forest habitats; dry and wet season, primary versus secondary forest habitats; randomization (Monte Carlo) test (10,000 permutations); r = standardized Mantel statistic. Statistically significant results are marked with * P ≤ 0.01 and ** P ≤ 0.001. In bold, matrices that were partialled out in respective analysis. Simple Mantel test comparisons on geographic and environmental matrices included in the table represent tests for spatial autocorrelation.
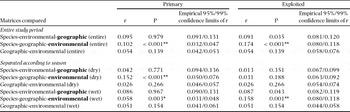
Partial Mantel test on comparison of three different distance matrices Taï National Park (TNP). Entire study period, primary vs. exploited forest habitats; dry and wet season, primary vs. secondary forest habitats; randomization (Monte Carlo) test (10 000 permutations); r = standardized Mantel statistic. Statistically significant results are marked with * P ≤ 0.01 and ** P ≤ 0.001. In bold, matrices that were partialled out in respective analysis. Simple Mantel test comparisons on geographic and environmental matrices included in the table represent tests for spatial autocorrelation.
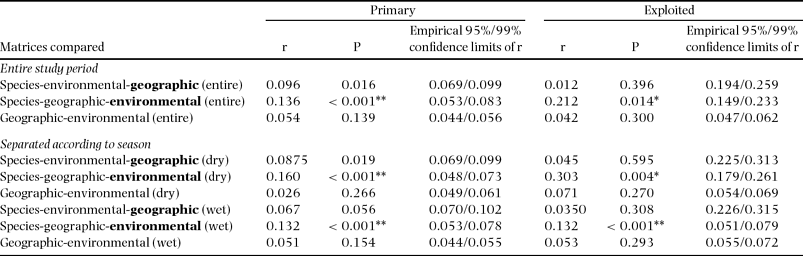
No significant correlations were found between SDM and ECM (environmental distribution vector matrix) when controlling for spatial effects, respectively (no environmental response signal, Tables 2 and 3). Hence, general correlative patterns were entirely determined by spatial dynamics.
These results were consistent throughout both seasons (no temporal signal) and disturbance regimes (no disturbance signal). In both geographic realms, results therefore indicated a general increase in community predictability with increasing proximity of SUs in both forest types. There was a single exception to this general pattern. In the analysis of dry-season data in exploited forest communities of MHFR, SDM were not correlated with either GDM or ECM.
We also found no correlations between GDM and ECM in any of the 12 (MHFR and TNP, primary and exploited, wet season and dry season) pairwise matrix comparisons (simple Mantel tests). Thus sites in close proximity of each other did not have similar environmental characteristics. SUs can therefore be considered independent.
DISCUSSION
The predictability patterns of species composition in tree frog assemblages of two geographically distinct eco-regions were consistent both within respective realms and disturbance regimes, as well as between regions. All assemblages appeared to be spatially structured, i.e. sites in close proximity had similar species assemblages. However, spatially structured environmental variation did not account for the spatial structure of species incidence, as no correlations existed between environmental characteristic vector matrices (ECM) and geographic distance vector matrices (GDM). Thus sites in close proximity to each other did not share similar habitats and environmental similarity of sites can therefore not explain similar species composition. This corresponds to the space-only model of Legendre (Reference LEGENDRE1993, Figure 6). The pattern found in our study deviates in one important point from this model. In our analysis no environmental response signal was detected, i.e. sites with similar environmental characteristics did not support similar species assemblages. These results are in contrast to previously published results from studies on leaf litter anurans in West Africa (Ernst & Rödel Reference ERNST and RÖDEL2005) and anuran assemblages of forest streams in eastern Australia (Parris Reference PARRIS2004) and thus need further explanation.
Species composition and turnover
Species composition varied considerably between habitat complexes in both realms. We noted a decrease in the total number of species, moving from primary forest to exploited forest. This was particularly marked in tree frog assemblages of MHFR where nine species were lost in disturbed forests. The species reduction in MHFR particularly concerned closed forest species, especially those associated with lotic habitats or those exhibiting reproductive strategies in which clutches are attached to vegetation above aquatic habitats and a large proportion of larval development takes place outside standing bodies of water (e.g. in MHFR: Hyalinobatrachium sp., Phyllomedusa spp., Dendropsophus spp.). Similar patterns have previously been reported for Amazonian frog communities (Tocher et al. Reference TOCHER, GASCON, MEYER, Bierregaard, Gascon, Lovejoy and Mesquita2001). The species reduction in TNP was less severe (four species lost in exploited forest) and concerned mainly small-bodied hyperoliid frogs that attach clutches to vegetation above lentic aquatic habitats (Afrixalus vibekensis, Hyperolius nienokouensis, Hyperolius fusciventris). In the case of TNP, no one habitat complex was found to have the full complement of species present in the TNP landscape. In MHFR on the other hand primary forest communities contained all species found in the MHFR landscape. Exploited forest communities were hence an impoverished subset of the entire MHFR community. However, even in MHFR we recorded three species (Dendropsophus minutus, Hypsiboas crepitans and Scinax ruber, each with a single individual) associated with disturbed sites that were not recorded in primary forest communities. These species were not recorded during transect walks and hence not included in the analysis, as they cannot (yet?) be considered part of the exploited-forest community. They rather appeared to be invading the area from an outside source; most likely accessing the reserve area via the main access road (Ernst et al. Reference ERNST, RÖDEL and ARJOON2005). Species turnover in exploited-forest communities of TNP also involves mainly species that are known to be comparatively efficient dispersers and invaders. In West Africa these species are commonly referred to as farmbush elements (sensu Schiøtz Reference SCHIØTZ1967), Afrixalus dorsalis being one prominent example. In the case of TNP, previous invasions of this species have apparently been successful, as it appears to maintain stable populations in exploited forest and was hence frequently and regularly recorded during transect walks. Two species exclusively recorded in primary forest are generally considered farmbush (Hyperolius concolor) or disturbance (Hyperolius fusciventris) elements (Rödel Reference RÖDEL2000, Rödel & Ernst Reference RÖDEL and ERNST2003, Rödel et al. Reference RÖDEL, GIL, AGYEI, LEACHÉ, DIAZ, FUJITA and ERNST2005) and their absence in exploited forest needs further explanation. Whereas Hyperolius fusciventris is a true forest species that can cope considerably well with altered environmental conditions following human-induced disturbance, Hyperolius concolor has been reported to occur in the transitory zone between rain forest and savanna and even penetrates far into true savanna habitats (Rödel Reference RÖDEL2000). The record of this species in a single primary forest site may be comparable with the situation of the three invading hylid species in MHFR and represent a random invasion event (an old logging road connects to this particular primary forest site). We observed amplectant pairs of Hyperolius concolor but successful reproduction was not confirmed.
Community predictability
The composition of the arboreal frog communities in both geographic realms proved to be determined by spatial factors, exclusively. The only deviation (no correlations between SDM and either GDM or ECM in dry-season data in exploited-forest communities of MHFR) is most likely a sampling artifact, due to a comparatively small sample size in exploited sites during the dry season. Results thus support biotic control model aspects, regardless of the disturbance status of a given forest and the geographic realm. In all cases, sites that were geographically proximal tended to have similar communities. This is an indication that biotic processes, such as dispersal from particular species pools, may influence the composition of communities at the cross regional level. This in turn is based on the assumption that priority effects (Wilbur & Alford Reference WILBUR and ALFORD1985) and lottery recruitment mechanisms (Chesson & Warner Reference CHESSON and WARNER1981, Munday et al. Reference MUNDAY, JONES and CALEY2000) are more important in the assembly of communities than species-specific responses to an environmental gradient.
Nonetheless, a large proportion of species that makes up the arboreal frog communities of MHFR (>70%) and TNP (>75%) has very specific breeding habitat requirements, i.e. species depend on specific lotic or large lentic aquatic habitats for reproduction (Ernst et al. Reference ERNST, LINSENMAIR and RÖDEL2006). Provided that individuals can move freely across the entire habitat matrix and that preferred breeding habitats are regularly available, this may not represent a limiting factor in the assembly of a given community. Dispersal and colonization abilities of a particular species, rather than species-specific habitat association thus become more important in determining community composition. This scenario reflects the situation in primary forest very well. However, the availability of specific breeding habitats in exploited forest sites is usually either reduced or their occurrence becomes highly unpredictable as formerly aquatic sites change from more permanent to increasingly ephemeral character. As a result the community in these exploited sites is reduced to members that exhibit a rather broad-scale habitat tolerance or show high levels of response diversity (sensu Elmqvist et al. Reference ELMQVIST, FOLKE, NYSTRÖM, PETERSON, BENGTSSON, WALKER and NORBER2003). Others possess special adaptations that enable them to cope with the harsher conditions in these disturbed forest patches, e.g. direct developers or species that breed in phytotelmata with a well-developed water-holding capacity. Species that depend on large, and/or permanent, aquatic sites for reproduction simply go extinct as is reflected in species composition and turnover patterns.
The same mechanisms operating in primary forest communities would then apply to the remaining community in exploited forests. The combination of species-specific dispersal abilities and the occurrence of dispersal barriers, such as large canopy gaps or forest clearings may ultimately determine species composition rather than environmental factors associated with respective sites. This finally explains why species habitat correlations within a respective habitat type may rather be overlain by spatial dynamics as has been observed in this study (strong spatial signal in all assemblages tested). In a recent study on birds, Bahn & McGill (Reference BAHN and MCGILL2007) found that abundance-environment correlations may simply result because both variables are similarly structured in space. Hence, the direct effect of environment on local abundance may be very small (not necessarily absent) and neighbourhood abundance may determine local abundance. This does not exclude environment from contributing to neighbourhood abundance. However, population processes, such as dispersal, immigration and emigration modify abundance locally as has previously been suggested by Currie (Reference CURRIE2007) in a paper on the roles of environment and space in ecology. This pattern is very similar to the pattern revealed in our study and may possibly prove to be a common pattern in vertebrate communities.
Additional evidence for this pattern comes from a study on patterns of nestedness and species associations in pond-dwelling amphibians. In this study Hecnar & M'Closkey (Reference HECNAR and M'CLOSKEY1997) showed that species grouped as good dispersers were less nested than poor dispersers and species incidence was positively correlated with potential dispersal ability. It is obvious that this is likely to determine the species composition of a given assemblage considerably, especially if priority effects (Wilbur & Alford Reference WILBUR and ALFORD1985) are an important factor shaping newly assembled communities.
In our case the assemblages in each of the habitat types may be dominated by species that can successfully colonize a given patch, which leads to a dominance of the spatial signal, perhaps even to a point at which an environmental response of a particular species is entirely covered or overlain by the spatial response signal. However, this remains speculative as actual species-specific dispersal and colonization rates need to be investigated systematically. It would have far-reaching consequences for the dynamics and conservation of arboreal frog assemblages if interactions between species-specific dispersal abilities and the occurrence of dispersal barriers, created by human activities such as commercial logging, actually determine the composition of a given assemblage rather than species-specific responses to the environment. Regardless of the actual mechanism, the spatial pattern that was revealed here deserves further attention. Even more so since patterns appear to differ between different anuran groups (arboreal frogs versus, for example, leaf-litter frogs).
When comparing the results of Ernst & Rödel (Reference ERNST and RÖDEL2005) and Parris (Reference PARRIS2004) with those of the study presented here, it seems likely that the patterns derived from the analysis of entire amphibian assemblages actually reflect the idiosyncratic influence of different functional response groups on general compositional patterns of the entire community. Treating distinct anuran groups as one coherent entity in the analysis of patterns of species composition may actually obscure or confound patterns that are otherwise group specific. This is in concordance with results from our study on the effects of anthropogenic disturbance on functional diversity of anuran communities (Ernst et al. Reference ERNST, LINSENMAIR and RÖDEL2006) that showed that different functional response groups react differently to habitat alteration. We therefore advocate studies that incorporate these group-specific differences, especially because important conservation strategies for this highly threatened vertebrate group may otherwise be based on the wrong assumptions.
ACKNOWLEDGEMENTS
RE was supported by a doctoral scholarship from the German Academic Exchange Service (DAAD). Iwokrama International Centre for Rain Forest Conservation and Development helped with transportation and various administrative services. Working in MHFR was kindly permitted by head of the Guyana Forestry Commission-PRDD, R. Thomas. Permission to conduct biodiversity research in Guyana was given by the Environmental Protection Agency Guyana. The field study in Africa was part of the BIOLOG-program of the German Ministry of Education and Science (BMB+F; Project W08 BIOTA-West, FZ 01 LC 00410). Research and access permissions were given by the Ministère de l'Enseignement Supérieur et de la Recherche Scientifique, and the Ministère de la Construction et de l'Environnement of the Republic of Ivory Coast. Three anonymous reviewers improved the manuscript by constructive comments. These supports are gratefully acknowledged.