In studying people’s behavior in the workplace, scholars have shifted their attention to positive organizational behavior (Balducci et al., Reference Balducci, Fraccaroli and Schaufeli2010) and the positive psychological states experienced by workers (Schaufeli, Reference Schaufeli, Truss, Alfes, Delbridge, Shantz and Soane2013). In this context, an aspect that has received considerable attention is work engagement. This is evidenced by the results obtained by Motyka (Reference Motyka2018) in his systematic review of the literature, in which he analyzed 71 studies on engagement published in 25 countries between 2002 and 2017, observing that 70% of these studies had been published between 2014 and 2018. However, the increase in research on work engagement is not evenly distributed across all countries and continents, since most have been carried out in the United States of America and Europe (Motyka, Reference Motyka2018).
The relevance of work engagement is evidenced in several theoretical models that include this construct as a mediator of the relationship between other variables and job performance (see for example Bakker, Reference Bakker2011; Christian et al., Reference Christian, Garza and Slaughter2011). There is considerable empirical evidence on the positive and statistically significant relationship between work engagement and job performance (Afacan-Findikli, Reference Afacan-Findikli2015; Breevaart et al., Reference Breevaart, Bakker, Demerouti and den Heuvel2015; Christian et al, Reference Christian, Garza and Slaughter2011; Dalal et al., Reference Dalal, Baysinger, Brummel and LeBreton2012; Gutermann et al., Reference Gutermann, Lehmann-Willenbrock, Boer, Born and Voelpel2017; Kim et al., Reference Kim, Kolb and Kim2013; Lorente et al., Reference Lorente, Salanova, Martínez and Vera2014; Lupano Perugini et al., Reference Lupano Perugini and Waisman2018; Motyka, Reference Motyka2018; Pongton & Suntrayuth, Reference Pongton and Suntrayuth2019; Qodariah et al., Reference Qodariah and Mauluddin2019; Rich et al., Reference Rich, Lepine and Crawford2010). Thus, work engagement is considered a key antecedent of employee behavior (Bakker et al., Reference Bakker, Albrecht and Leiter2011; Bothma & Roodt, Reference Bothma and Roodt2012), which contributes to the competitive advantage of organizations, increasing their financial performance and reputation (Karanges et al., Reference Karanges, Beatson, Johnston and Lings2014; Shuck & Reio, Reference Shuck and Reio2011; Tampubolon, Reference Tampubolon2016).
Despite the above, work engagement is a complex construct and even today there is some controversy on its conceptualization (Chaudhary et al., Reference Chaudhary, Rangnekar and Barua2012; Wefald et al., Reference Wefald, Mills, Smith and Downey2012), especially in relation to its uni- or multidimensionality. For this reason, the present study aimed to determine the most appropriate factorial structure and the predictive validity of the instrument considered the standard measure of this construct, the Utrecht Work Engagement Scale (Kataria et al., Reference Kataria, Garg and Rastogi2013; Kulikowski, Reference Kulikowski2017; Lovakov et al., Reference Lovakov, Agadullina and Schaufeli2017; Rodríguez Montalbán et al., Reference Rodríguez Montalbán, Sánchez-Cardona and Martínez Lugo2014; Vazquez et al., Reference Vazquez, Magnan, Pacico and Hutz2017; Willmer et al., Reference Willmer, Westerberg Jacobson and Lindberg2019). This aspect is relevant not only from a theoretical but also a practical perspective. On the one hand, ensuring the structural invariance of the instrument is a requirement to be able to use it in diverse geographical and cultural settings without the need to carry out specific studies in each population (Klassen et al., Reference Klassen, Aldhafri, Mansfield, Purwanto, Siu, Wong and Woods-McConney2012). Moreover, depending on what is found in each particular case, appropriate decisions can be made as to whether to use and interpret the scores of each of the subscales separately, or whether it is more appropriate to use and interpret a single total score.
Continuing research on psychometric properties of this scale is especially relevant in Latin American countries where there is little scientific evidence available on this aspect (Rodríguez Montalbán et al., Reference Rodríguez Montalbán, Sánchez-Cardona and Martínez Lugo2014). In fact, in the literature review carried out for the present study, only four investigations carried out in Latin America were located, and only in three were the psychometric properties of the Spanish version of the instrument evaluated using Hispanic American samples (Chile, Uruguay and Puerto Rico). This study helps to cover this deficit and contributes to the evaluation of the generalizability of the factorial structure of the scale, working with a sample of employees from Ecuador; a country that in order to develop competitive production models requires substantial changes in its human resource management practices, and in which, according to the results of the bibliographic analysis carried out by Herrera-Franco et al. (Reference Herrera-Franco, Montalván-Burbano, Mora-Frank and Bravo-Montero2021), research in this area is so scarce that it does not appear among the 27 areas of knowledge in which Ecuador makes contributions in the period of greatest scientific production in the country (1991–2020) and the expression “human resources” or equivalent does not appear among the 1,213 keywords used by the authors that were repeated at least 10 times.
Conceptualization in Relation to Dimensionality of Work Engagement
The complexity of work engagement (WE) is evident from his own conceptualization. Scholars have debated whether WE is a construct in itself or whether it overlaps with other constructs already used in the organizational field. In this sense, empirical evidence consistently shows that the WE is, in fact, its own construct distinct from others such as organizational commitment, job involvement, job satisfaction, organizational citizenship behavior and extra-role behavior (Bakker et al., Reference Bakker, Albrecht and Leiter2011; Kataria et al., Reference Kataria, Garg and Rastogi2013; Saks, Reference Saks2006). Similarly, the debate on whether or not WE is the polar opposite of burnout now also seems to have been resolved. Schaufeli (Reference Schaufeli, Truss, Alfes, Delbridge, Shantz and Soane2013) and Schaufeli and Salanova (Reference Schaufeli and Salanova2011) explain that these two constructs are independent, have different structures and explain different aspects of the relationship that employees establish with their jobs (Schaufeli et al., Reference Schaufeli, Salanova, González-Romá and Bakker2002).
The remaining theoretical discussion surrounds the uni- or multidimensionality of the construct. In this regard, Britt (1999, as cited in Wefald et al., Reference Wefald, Mills, Smith and Downey2012) and the Gallup Organization agree on understanding WE as a unidimensional construct. However, they disagree on how to define it. For Britt, the WE is a motivational state that refers to the extent to which the employee cares about their job performance, feeling responsible and committed to that performance (Wefald et al., Reference Wefald, Mills, Smith and Downey2012); while for the Gallup Organization the WE refers to the participation, satisfaction and enthusiasm of the individual for their work (Schaufeli, Reference Schaufeli, Truss, Alfes, Delbridge, Shantz and Soane2013; Shuck, Reference Shuck2011).
In contrast, Kahn (Reference Kahn1990), recognized as the first to apply the notion of engagement to the work context, presents it as a multidimensional construct consisting of three dimensions: (a) Cognitive engagement; (b) emotional engagement; and (c) behavioral engagement. Moreover, Kahn defines WE as a psychological state in which employees “incorporate” their personal self into their work performances, investing personal energy and experiencing an emotional connection to their work. This enables them to be connected to their job roles physically, cognitively, emotionally (Bakker, Reference Bakker2011; Shuck, Reference Shuck2011, Reference Shuck2013; Shuck & Reio, Reference Shuck and Reio2011), devote their personal resources to performing the tasks associated with the role they play within the organization (Christian et al., Reference Christian, Garza and Slaughter2011), and focus their energy on organizational goals (Bakker, Reference Bakker2011).
The view of WE as a multidimensional construct is shared by Schaufeli and colleagues, who define it as a positive, satisfying and active psychological state associated with the performance of daily work activities, characterized by vigor, dedication and absorption in their work (Bakker, Reference Bakker2011; Salanova-Soria & Schaufeli, Reference Salanova-Soria and Schaufeli2004; Schaufeli, Reference Schaufeli, Truss, Alfes, Delbridge, Shantz and Soane2013, Reference Schaufeli2017; Schaufeli et al., Reference Schaufeli, Salanova, González-Romá and Bakker2002), with vigor and dedication being the core dimensions (Schaufeli & Salanova, Reference Schaufeli and Salanova2011). According to Schaufeli (Reference Schaufeli, Truss, Alfes, Delbridge, Shantz and Soane2013, Reference Schaufeli2017), this notion is congruent with that of Kahn (Reference Kahn1990), in the sense that there is an equivalence between physical-energetic and vigor, emotional engagement and dedication, and cognitive engagement and absorption.
Vigor refers to the extent to which the worker experiences high levels of energy and physical and mental endurance while working (Bakker, Reference Bakker2011; Bakker et al., Reference Bakker, Albrecht and Leiter2011, Reference Bakker, Demerouti and ten Brummelhuis2012; Schaufeli, Reference Schaufeli, Truss, Alfes, Delbridge, Shantz and Soane2013). That is, their desire to invest effort in the work they perform and to persist even in times of difficulty (Salanova-Soria & Schaufeli, Reference Salanova-Soria and Schaufeli2004; Schaufeli, Reference Schaufeli, Truss, Alfes, Delbridge, Shantz and Soane2013, Reference Schaufeli2017; Schaufeli et al., Reference Schaufeli, Salanova, González-Romá and Bakker2002). Dedication refers to the degree to which the person feels involved and identified with the work they do and experiences a sense of importance, enthusiasm, inspiration, pride, and challenge (Bakker, Reference Bakker2011; Bakker et al., Reference Bakker, Albrecht and Leiter2011, Reference Bakker, Demerouti and ten Brummelhuis2012; Salanova-Soria & Schaufeli, Reference Salanova-Soria and Schaufeli2004; Schaufeli, Reference Schaufeli, Truss, Alfes, Delbridge, Shantz and Soane2013, Reference Schaufeli2017; Schaufeli et al., Reference Schaufeli, Salanova, González-Romá and Bakker2002). Finally, absorption alludes to the extent to which the person is so focused and absorbed in their work (Bakker, Reference Bakker2011; Bakker et al., Reference Bakker, Albrecht and Leiter2011, Reference Bakker, Demerouti and ten Brummelhuis2012; Schaufeli, Reference Schaufeli, Truss, Alfes, Delbridge, Shantz and Soane2013), which facilitates the quick passing of time (Bakker, Reference Bakker2011; Schaufeli, Reference Schaufeli, Truss, Alfes, Delbridge, Shantz and Soane2013). High absorption entails a difficulty in distancing oneself from their work (Salanova-Soria & Schaufeli, Reference Salanova-Soria and Schaufeli2004; Schaufeli, Reference Schaufeli, Truss, Alfes, Delbridge, Shantz and Soane2013, Reference Schaufeli2017; Schaufeli et al., Reference Schaufeli, Salanova, González-Romá and Bakker2002; Simpson, Reference Simpson2009).
For Schaufeli and colleagues, the WE is relatively stable over time and is not focused on a particular event, object, person, or behavior (Salanova-Soria & Schaufeli, Reference Salanova-Soria and Schaufeli2004; Schaufeli & Salanova, Reference Schaufeli and Salanova2011; Schaufeli et al., Reference Schaufeli, Salanova, González-Romá and Bakker2002; Simpson, Reference Simpson2009). This does not mean that it cannot change depending on the characteristics of the job (Schaufeli & Salanova, Reference Schaufeli and Salanova2011) and what happens throughout the day (Bakker, Reference Bakker2011). In fact, some researchers cited in Breevaart et al. (Reference Breevaart, Bakker, Demerouti and Hetland2012) have measured the construct on a daily basis, confirming that the WE reported by a particular person can fluctuate over time.
The conceptualization of WE proposed by Schaufeli and colleagues is the one mostly adopted by researchers, according to the results of the literature review conducted by Motyka (Reference Motyka2018), and the one taken as a starting point in this study.
Measurement of Work Engagement
Although several instruments have been developed to measure WE, the most widely used measure (Rich et al., Reference Rich, Lepine and Crawford2010; Schaufeli, Reference Schaufeli, Truss, Alfes, Delbridge, Shantz and Soane2013; Shuck, Reference Shuck2011; Wefald et al., Reference Wefald, Mills, Smith and Downey2012) is the Utrecht Work Engagement Scale (UWES) created by Schaufeli and colleagues; an instrument which is even considered the standard measure of this construct (Kataria et al., Reference Kataria, Garg and Rastogi2013; Kulikowski, Reference Kulikowski2017; Lovakov et al., Reference Lovakov, Agadullina and Schaufeli2017; Rodríguez Montalbán et al., Reference Rodríguez Montalbán, Sánchez-Cardona and Martínez Lugo2014; Vazquez et al., Reference Vazquez, Magnan, Pacico and Hutz2017; Willmer et al., Reference Willmer, Westerberg Jacobson and Lindberg2019). In fact, Motyka’s (Reference Motyka2018) systematic literature review found that in 82% of the publications analyzed, the WE had been measured using some version of the UWES.
Originally the UWES included 24 items (Schaufeli et al., Reference Schaufeli, Salanova, González-Romá and Bakker2002, 2006); but, after several psychometric evaluations and in order to achieve a more parsimonious measurement, the authors reduced its length to 17 items (Kataria et al., Reference Kataria, Garg and Rastogi2013; Rodríguez Montalbán et al., Reference Rodríguez Montalbán, Sánchez-Cardona and Martínez Lugo2014; Schaufeli et al., Reference Schaufeli, Bakker and Salanova2006). Nevertheless, we can find works with a 15-items version due to the results that showed that two of the items of the UWES–17 version were inconsistent (Salanova et al., Reference Salanova, Schaufeli, Llorens, Peiró and Grau2000). Subsequently, Schaufeli et al. (Reference Schaufeli, Bakker and Salanova2006) developed a nine-item version (UWES–9), three for each dimension, which was validated in 10 countries with a sample of more than 14,000 people. This has become the most popular version, since according to Motyka (Reference Motyka2018) this version was used in 68% of the papers analyzed in their literature review.
The UWES–9 has psychometric properties equivalent to its longer versions (Chaudhary et al., Reference Chaudhary, Rangnekar and Barua2012; Kataria et al., Reference Kataria, Garg and Rastogi2013; Kulikowski, Reference Kulikowski2017; Schaufeli et al., Reference Schaufeli, Bakker and Salanova2006), noting that it even has superior practical utility and construct validity than the UWES–17 (Schaufeli et al., Reference Schaufeli, Bakker and Salanova2006; Seppälä et al., Reference Seppälä, Mauno, Feldt, Hakanen, Kinnunen, Tolvanen and Schaufeli2009). In addition, scores on the UWES–9 are more stable over time and explain about 80% of the variance in scores on the UWES–17 (Kulikowski, Reference Kulikowski2017).
The UWES–9 presents high internal consistency indices, reporting Cronbach’s Alpha coefficients for the full scale above .80 (Balducci et al., Reference Balducci, Fraccaroli and Schaufeli2010; Chaudhary et al., Reference Chaudhary, Rangnekar and Barua2012; Kataria et al., Reference Kataria, Garg and Rastogi2013; Klassen et al., Reference Klassen, Aldhafri, Mansfield, Purwanto, Siu, Wong and Woods-McConney2012; Schaufeli et al., Reference Schaufeli, Bakker and Salanova2006; Villotti et al., Reference Villotti, Balducci, Zaniboni, Corbière and Fraccaroli2014; Wefald et al., Reference Wefald, Mills, Smith and Downey2012; Willmer et al., Reference Willmer, Westerberg Jacobson and Lindberg2019; Yusoff et al., Reference Yusoff, Ali, Khan and Bakar2013); and Cronbach’s Alpha values between .73 and .90 for the different dimensions (Balducci et al., Reference Balducci, Fraccaroli and Schaufeli2010; Chaudhary et al., Reference Chaudhary, Rangnekar and Barua2012; Hallberg & Schaufeli, Reference Hallberg and Schaufeli2006; Kataria et al., Reference Kataria, Garg and Rastogi2013; Klassen et al., Reference Klassen, Aldhafri, Mansfield, Purwanto, Siu, Wong and Woods-McConney2012; Lovakov et al., Reference Lovakov, Agadullina and Schaufeli2017; Rodríguez Montalbán et al., Reference Rodríguez Montalbán, Sánchez-Cardona and Martínez Lugo2014; Schaufeli et al., Reference Schaufeli, Bakker and Salanova2006; Villotti et al., Reference Villotti, Balducci, Zaniboni, Corbière and Fraccaroli2014; Wefald et al., Reference Wefald, Mills, Smith and Downey2012).
On the other hand, regarding the multidimensional structure of the UWES, there are wide discrepancies in the results obtained, which casts doubt on the generalizability of the notion of work engagement as a construct made up of the three dimensions proposed by Schaufeli and colleagues. In this sense, Schaufeli et al. (Reference Schaufeli, Bakker and Salanova2006), Villotti et al. (Reference Villotti, Balducci, Zaniboni, Corbière and Fraccaroli2014) and Willmer et al. (Reference Willmer, Westerberg Jacobson and Lindberg2019) obtained correlations between the three dimensions greater than .70. Breevaart et al. (Reference Breevaart, Bakker, Demerouti and Hetland2012), De Bruin and Henn (Reference De Bruin and Henn2013), Hallberg and Schaufeli (Reference Hallberg and Schaufeli2006), and Vazquez et al. (Reference Vazquez, Magnan, Pacico and Hutz2017) found correlations greater than .80; and Balducci et al. (Reference Balducci, Fraccaroli and Schaufeli2010), Chaudhary et al. (Reference Chaudhary, Rangnekar and Barua2012), Gómez Garbero et al. (Reference Gómez Garbero, Labarthe, Ferreira-Umpiérrez and Chiminelli-Tomás2019), Lovakov et al. (Reference Lovakov, Agadullina and Schaufeli2017), and Schaufeli et al. (Reference Schaufeli, Bakker and Salanova2006) reported correlations greater than .90. Rodríguez Montalbán et al. (Reference Rodríguez Montalbán, Sánchez-Cardona and Martínez Lugo2014) found that, on average, the three UWES subscales share 57% of the variance, again indicating that the theoretical dimensions of the UWES are highly correlated and suggesting one-dimensionality.
Additionally, using exploratory factor analysis (EFA), Müller Gilchrist et al. (Reference Müller Gilchrist, Pérez Villalobos and Ramírez Fernández2013) obtained two factors. In contrast, also using EFA, Chaudhary et al. (Reference Chaudhary, Rangnekar and Barua2012), Vazquez et al. (Reference Vazquez, Magnan, Pacico and Hutz2017) and Willmer et al. (Reference Willmer, Westerberg Jacobson and Lindberg2019) found an unifactorial solution; but, using confirmatory factor analysis (CFA), Chaudhary et al. (Reference Chaudhary, Rangnekar and Barua2012) found that the three-factor model had slightly higher fit indices than the one-factor solution.
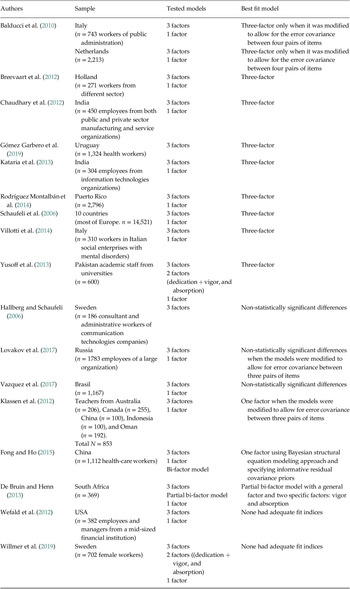
As can be seen in Table 1, in different countries the three-factor model shown acceptable fit rates or higher indices to one-dimensional or two-factor (dedication+vigor and absorption) models (Balducci et al., Reference Balducci, Fraccaroli and Schaufeli2010; Breevaart et al., Reference Breevaart, Bakker, Demerouti and Hetland2012; Gómez Garbero et al., Reference Gómez Garbero, Labarthe, Ferreira-Umpiérrez and Chiminelli-Tomás2019; Kataria et al., Reference Kataria, Garg and Rastogi2013; Rodríguez Montalbán et al., Reference Rodríguez Montalbán, Sánchez-Cardona and Martínez Lugo2014; Schaufeli et al., Reference Schaufeli, Bakker and Salanova2006; Villotti et al., Reference Villotti, Balducci, Zaniboni, Corbière and Fraccaroli2014; Yusoff et al., Reference Yusoff, Ali, Khan and Bakar2013). However, in studies such as Balducci et al. (Reference Balducci, Fraccaroli and Schaufeli2010) results indicative of a good fit of the three-factor model were obtained only when it was modified to allow the error covariance between four pairs of items in the Italian sample and between two pairs of items in the Dutch sample. This correlation between errors suggests a possible content overlap between items (or redundancy problem).
Models with Better Fit in Different Investigations

In contrast, the results of Hallberg and Schaufeli (Reference Hallberg and Schaufeli2006) and Vazquez et al. (Reference Vazquez, Magnan, Pacico and Hutz2017) shown non-statistically significant differences between the one-dimensional and three-factor models in terms of their fit indices. Additionally, Lovakov et al. (Reference Lovakov, Agadullina and Schaufeli2017) found that the three-factor model presented a slightly better fit than the one-factor model, although the latter also had acceptable fit indices when the models were modified to allow for error covariance between three pairs of items, controlling the possible content redundancy.
Questions about the multidimensional structure of the UWES increase when considering that there are studies in which what has been observed is a superiority of the one-dimensional model. For example, Klassen et al. (Reference Klassen, Aldhafri, Mansfield, Purwanto, Siu, Wong and Woods-McConney2012) found that when the one- and three-factor models were modified to allow for the error covariance between items, the fit indices of the one-factor model were slightly better than those of the three-factor model. Likewise, Fong and Ho (Reference Fong and Ho2015), using Bayesian structural equation modeling (BSEM) and specifying informative residual covariance priors, found that the one-dimensional BSEM had a significantly lower BIC, indicating a better fit than the three-factor and partial bi-factor BSEM models. However, De Bruin and Henn (Reference De Bruin and Henn2013) found that the model with the best fit indices was a partial bi-factor model which specifies a general factor which the authors named "work engagement" and which explained 89% of the variance, and two specific factors: Vigor and absorption.
Finally, there are also results showing inadequate fit of the all models tested: One-factor, two-factor and three-factor (Wefald et al., Reference Wefald, Mills, Smith and Downey2012; Willmer et al., Reference Willmer, Westerberg Jacobson and Lindberg2019). In the case of Klassen et al. (Reference Klassen, Aldhafri, Mansfield, Purwanto, Siu, Wong and Woods-McConney2012), this was true when models were evaluated without allowing for correlation between errors. In the case of Fong and Ho (Reference Fong and Ho2015), none of the models tested presented adequate fit indices when the fit was assessed using the traditional ML approach of CFA. Finally, Hallberg and Schaufeli (Reference Hallberg and Schaufeli2006) and Villotti et al. (Reference Villotti, Balducci, Zaniboni, Corbière and Fraccaroli2014) found that for both the three-factor and one-dimensional models, the RMSEA and χ2 fit indices indicated an unacceptable fit.
The discrepancy of results regarding the structure of the UWES has also been highlighted by Kataria et al. (Reference Kataria, Garg and Rastogi2013) who found that the one-dimensional model had a better fit in 33.33% of the 10 studies reviewed; but, in another 33.33% a better fit of the three-factor solution was found, and in 20% neither solution was found to have adequate fit indices. More recently, Kulikowski (Reference Kulikowski2017) reviewed 21 studies in which the factor structure of the original and the short version of the UWES was evaluated using CFA, and confirmed the instability in the factorial structure of the scale: In 23.81% of the studies the original three-factor structure was found, but in another 23.81% a one-factor structure was found, and in 38.09% the results showed that both models (one-factor and three-factor) were equivalent.
This variability of results demonstrates that the UWES–9 may have a problem with the invariance of its factorial structure, demanding further examination (Kulikowski, Reference Kulikowski2017). Gaining a better understanding of the dimensionality of the UWES–9 is relevant not only from a theoretical but also from a practical point of view. Specifically, confirming that the structure of the scale for which the best fit indices are obtained differs when working with different samples would imply that before using this scale it would be necessary to check its behavior in the specific population with which we intend to work; so that, depending on what is found in each particular case, appropriate decisions can be made as to whether to use and interpret the scores of each of the subscales separately, or whether it is more appropriate to use and interpret a single total score. On the other hand, the presence of an invariance problem makes it inappropriate to compare results obtained in studies that have worked with different samples for which different configurations have been found.
Continuing research on the psychometric properties of the UWES–9 is especially relevant in Latin American countries where there is little scientific evidence available on this aspect (Rodríguez Montalbán et al., Reference Rodríguez Montalbán, Sánchez-Cardona and Martínez Lugo2014). As Klassen et al. (Reference Klassen, Aldhafri, Mansfield, Purwanto, Siu, Wong and Woods-McConney2012) point out, "measures developed in particular settings must be carefully examined across cultural settings before they can be reliably used beyond those settings" (p. 318).
Based on the above, the present study aimed, on the one hand, to determine the most appropriate factorial structure of the Spanish version of the UWES–9; and, on the other hand, to determine its predictive validity with respect to the measurement of self-assessed work performance, a variable that, as previously indicated, is the one that is most frequently predicted from work engagement.
Specifically, using Confirmatory Factor Analysis, the following measurement models were tested:
1. Three correlated factors, based on studies showing high correlations between the three dimensions proposed by Schaufeli and colleagues (Balducci et al., Reference Balducci, Fraccaroli and Schaufeli2010; Breevaart et al., Reference Breevaart, Bakker, Demerouti and Hetland2012; Chaudhary et al., Reference Chaudhary, Rangnekar and Barua2012; De Bruin & Henn, Reference De Bruin and Henn2013; Gómez Garbero et al., Reference Gómez Garbero, Labarthe, Ferreira-Umpiérrez and Chiminelli-Tomás2019; Hallberg & Schaufeli, Reference Hallberg and Schaufeli2006; Lovakov et al., Reference Lovakov, Agadullina and Schaufeli2017; Rodríguez Montalbán et al., Reference Rodríguez Montalbán, Sánchez-Cardona and Martínez Lugo2014; Schaufeli et al., Reference Schaufeli, Bakker and Salanova2006; Vazquez et al., Reference Vazquez, Magnan, Pacico and Hutz2017; Villotti et al., Reference Villotti, Balducci, Zaniboni, Corbière and Fraccaroli2014; Willmer et al., Reference Willmer, Westerberg Jacobson and Lindberg2019).
2. Two correlated factors (dedication + vigor, and absorption), previously considered by Willmer et al. (Reference Willmer, Westerberg Jacobson and Lindberg2019) and Yusoff et al. (Reference Yusoff, Ali, Khan and Bakar2013).
3. A unidimensional model based on the results of Fong and Ho (Reference Fong and Ho2015), Klassen et al. (Reference Klassen, Aldhafri, Mansfield, Purwanto, Siu, Wong and Woods-McConney2012) and Lovakov et al. (Reference Lovakov, Agadullina and Schaufeli2017); or an essentially one-dimensional structure that can take the form of: (a) A classical bifactor model (a general work engagement factor and three specific factors: Absorption, dedication and vigor), which allows assessing the validity of specific factor scores, controlling for the variance due to the general factor (Ondé et al. Reference Ondé, Alvarado, Sastre and Azañedo2021); and, (b) a S–1 bifactor model or partial bifactor (De Bruin & Henn, Reference De Bruin and Henn2013; Fong & Ho, Reference Fong and Ho2015), in which one of the specific factors (i.e., reference factor) is used as the general factor (in our case, the "dedication" factor) and the rest of the specific factors are analyzed controlled by the common variance of the reference factor (Ondé et al., Reference Ondé, Alvarado, Sastre and Azañedo2021).
Method
Sample
The study included 229 workers from private educational institutions (elementary, middle and high schools) in Guayaquil-Ecuador (73.4% women) with an average age of 36.04 years (SD = 9.38). In terms of professional category, 67.6% of the sample were highly qualified professionals and 13.1% were administrative or auxiliary personnel; 68.1% had a university degree and 16.2% had a postgraduate degree. The majority of the participants (72.1%) had more than five years of work experience, 96.8% had a permanent, indefinite contract, and 95.4% worked full time. Finally, 43.7% of the subjects had been working in their current organization for between 1 and 5 years and 28.4% had been working in the organization for more than five years.
The educational centers were selected by convenience and agreed to participate in the study. As inclusion criteria for this research, participants had to be over 18 years of age and working in the institution at the time of the study. Following the ethical principles of psychologists and code of conduct of the American Psychological Association (APA), 2017, the participation was voluntary and subjects received information about (a) the purpose of the research, expected duration, and procedures; (b) their right to decline to participate and to withdraw from the research once participation has begun without consequences; and (c) whom to contact for questions about the research. Subjects provided informed verbal consent which is adapted to the ethical considerations of the APA because, given the characteristics of the study, participating in it did not imply any type of risk, neither physical nor psychological, for the participants. Nor did it imply subjecting the participants to conditions that could cause them discomfort or that could have adverse effects on them. All data were treated confidentially and they were not shared with anyone other than the study authors. No specific incentive was offered to participate in the study.
Instruments
Work Engagement
To measure work engagement, we used the official Spanish version of Utrech Work Engagement Scale (UWES–9) validated by Salanova et al. (Reference Salanova, Schaufeli, Llorens, Peiró and Grau2000) and Schaufeli et al. (Reference Schaufeli, Bakker and Salanova2006) with samples of workers from Spain and with samples from Puerto Rico (Rodríguez Montalbán et al., Reference Rodríguez Montalbán, Sánchez-Cardona and Martínez Lugo2014) and Uruguay (Gómez Garbero et al., Reference Gómez Garbero, Labarthe, Ferreira-Umpiérrez and Chiminelli-Tomás2019)Footnote 1.
Using a Likert scale of six intervals (1 = never/almost never to 6 = almost always/always), people were asked to indicate how often they have felt the way expressed in each of the items. In the Spanish version of UWES–9, neutral Spanish is used so it does not include particular idioms of a country. All the words are commonly used and easily understood by the Ecuadorian population, especially considering the educational level of those who participated in the study, so the subjects were not expected to have difficulty understanding the items. This was confirmed during the application of the instrument, as the participants did not report having problems understanding the meaning of the items.
As reported by Balducci et al. (Reference Balducci, Fraccaroli and Schaufeli2010), Chaudhary et al. (Reference Chaudhary, Rangnekar and Barua2012), Hallberg and Schaufeli (Reference Hallberg and Schaufeli2006), Kataria et al. (Reference Kataria, Garg and Rastogi2013), Klassen et al. (Reference Klassen, Aldhafri, Mansfield, Purwanto, Siu, Wong and Woods-McConney2012), Schaufeli et al. (Reference Schaufeli, Bakker and Salanova2006), Villotti et al. (Reference Villotti, Balducci, Zaniboni, Corbière and Fraccaroli2014), Wefald et al. (Reference Wefald, Mills, Smith and Downey2012), Willmer et al. (Reference Willmer, Westerberg Jacobson and Lindberg2019) and Yusoff et al. (Reference Yusoff, Ali, Khan and Bakar2013), with the data obtained in the present study, the scale showed high internal consistency (α = .907).
Job Performance
In the present study, job performance was defined as the behaviors, rather than the results, of the members of an organization that are relevant to the organization’s goals (Campbell, Reference Campbell, Dunnette and Hough1990). To assess this construct, the Spanish translation of the English version of the Individual Work Performance Questionnaire (IWPQ-Version 1.0) by Koopmans et al. (Reference Koopmans, Bernaards, Hildebrandt, Lerner, de Vet and van der Beek2016) was used. The questionnaire has 18 propositions related to people’s behavior at work, and participants are asked to indicate how often they exhibited each of the behaviors in the last three months, on a six-interval Likert scale (1 = never/almost never – 6 = almost always/always). This questionnaire is composed of three scales measuring three aspects of the job performance construct, used in the present study as criterion variables, in order to assess the predictive validity of the UWES–9:
1. Task performance, defined as the behaviors that contribute, directly or indirectly, to the core technical aspects of the organization (Borman & Motowidlo, Reference Borman and Motowidlo1997); that is, the competence with which the individual performs the core tasks associated with their job (Koopmans et al., Reference Koopmans, Bernaards, Hildebrandt, Schaufeli, de Vet Henrica and van der Beek2011). A higher score on this subscale is indicative of better task performance.
2. Contextual performance, defined as individual behaviors that contribute to the maintenance of the social and psychological environment in which the task performance takes place, and that go beyond what is formally prescribed as job goals (Borman & Motowidlo, Reference Borman and Motowidlo1997; Koopmans et al., Reference Koopmans, Bernaards, Hildebrandt, Schaufeli, de Vet Henrica and van der Beek2011; Rotundo & Sackett, Reference Rotundo and Sackett2002; Viswesvaran & Ones, Reference Viswesvaran and Ones2000). A higher score on this subscale is indicative of better contextual performance.
3. Counterproductive behaviors, which are behaviors that are detrimental to organizational well-being (Koopmans et al., Reference Koopmans, Bernaards, Hildebrandt, Schaufeli, de Vet Henrica and van der Beek2011; Rotundo & Sackett, Reference Rotundo and Sackett2002; Viswesvaran & Ones, Reference Viswesvaran and Ones2000). A higher score on this subscale is indicative of a higher occurrence of behaviors that are counterproductive to the organization.
The IWPQ for the measurement of the job performance was chosen because a very rigorous process was followed in its development, both in terms of the literature review that underpinned the choice of items, and in the various tests conducted in order to assess their psychometric proprieties by its original authors (Koopmans et al., Reference Koopmans, Bernaards, Hildebrandt, Lerner, de Vet and van der Beek2016, Reference Koopmans, Bernaards, Hildebrandt, Schaufeli, de Vet Henrica and van der Beek2011, Reference Koopmans, Bernaards, Hildebrandt, van Buuren, van der Beek and de Vet2013, Reference Koopmans, Bernaards, Hildebrandt, de Vet and van der Beek2014a, Reference Koopmans, Bernaards, Hildebrandt, de Vet and van der Beek2014b) and other researchers (see Gabini & Salessi, Reference Gabini and Salessi2016; Widyastuti & Hidayat, Reference Widyastuti and Hidayat2018). In this regard, different studies have found internal consistency indices for each of the IWPQ scales ranging from .76–.87 for task performance, .72–.87 for contextual performance, and .76–.89 for counterproductive behaviors (Koopmans et al., Reference Koopmans, Bernaards, Hildebrandt, Lerner, de Vet and van der Beek2016; Ramos-Villagrasa et al., Reference Ramos-Villagrasa, Barrada, Fernández-del-Río and Koopmans2019; Gabini & Salessi, Reference Gabini and Salessi2016; Widyastuti & Hidayat, Reference Widyastuti and Hidayat2018). The different scales of the Spanish IWPQ-Version 1.0 used in the present research also showed adequate internal consistency (Task performance: α = .73; Contextual performance: α = .79; Counterproductive behaviors: α = .77).
Data Analysis
We conducted a Confirmatory Factor Analysis (CFA) to fit different measurement models: (a) Three correlated factors (3F), (b) two correlated factors (2F), and (c) one factor, either unidimensional (1F) or essentially unidimensional.
For the CFA we used the Lavaan package (Rosseel, Reference Rosseel2014) in the R Project for Statistical Computing (version 4.1.0), and the diagonally weighted least squares estimator (DWLS) using a polychoric correlation matrix. This estimator is recommended for analyzing samples with a small-moderate number of observations with ordinal data, such as that yielded by Likert-type items (Asún et al., Reference Asún, Rdz-Navarro and Alvarado2016; Jöreskog & Sörbom, Reference Jöreskog and Sörbom1989). For the CFA model fit evaluation, we used the χ2 tests, the Root Mean Square Error of Approximation (RMSEA), Standardized Root Mean Square Residual (SRMR), Comparative Fit Index (CFI), and Tucker-Lewis Index (TLI). We used the following criteria for evaluating model fit: RMSEA < .08, SRMR ≤ .08, CFI and TLI ≥ .95 (Brown, Reference Brown2015).
SPSS 25.0 was used for the descriptive analysis of the UWES–9 items and the regression analyses aimed at assessing the predictive validity of the UWES–9.
Results
Preliminary Analysis
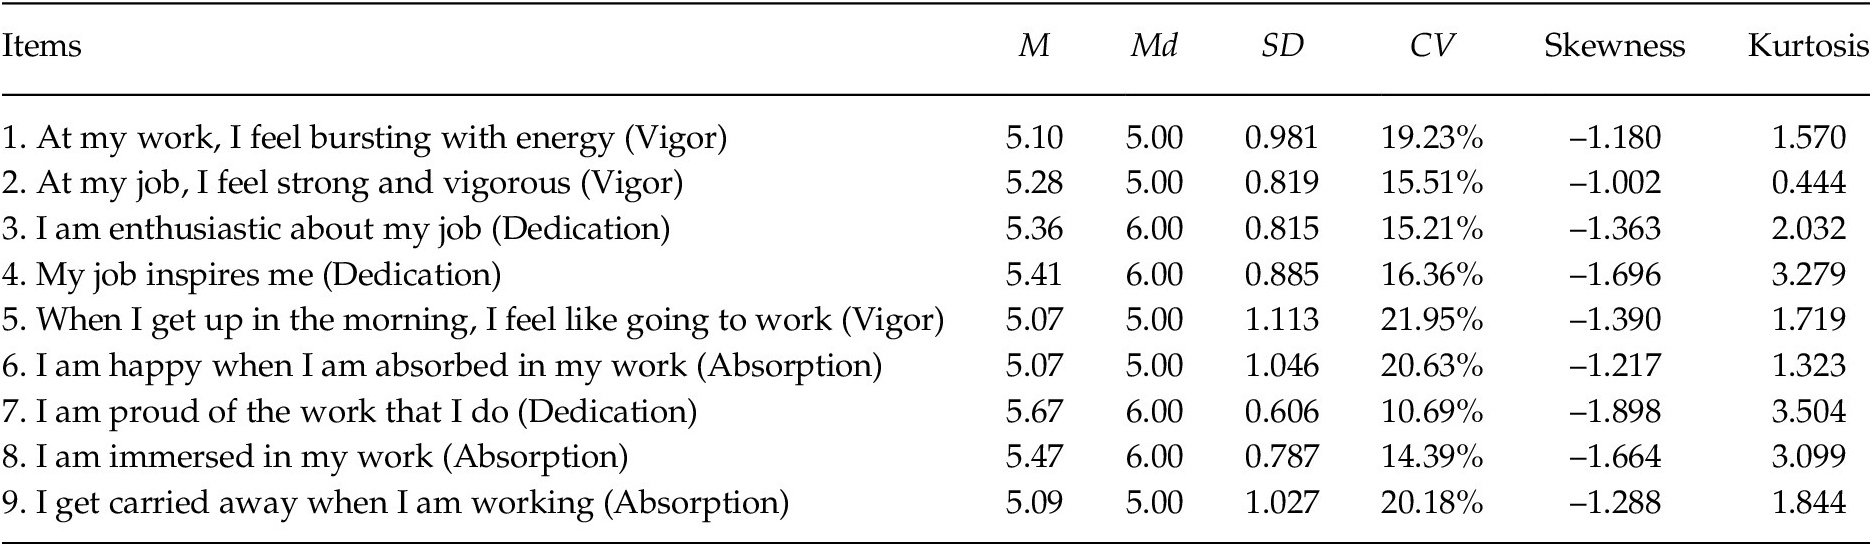
In the case of WE, item means ranged from 5.07 to 5.41, with standard deviations between 0.815 and 1.113 (Table 2), indicating that, in general terms, participants reported high levels of work engagement. In this sense, the distributions presented a negative skewness indicating that, in all items, the scores tended to cluster towards the high values of the scale, showing a moderate homogeneity. In addition, the distribution of the data was leptokurtic for all items except item 2 (Table 2).
Descriptive Statistics of the UWES-9 Items

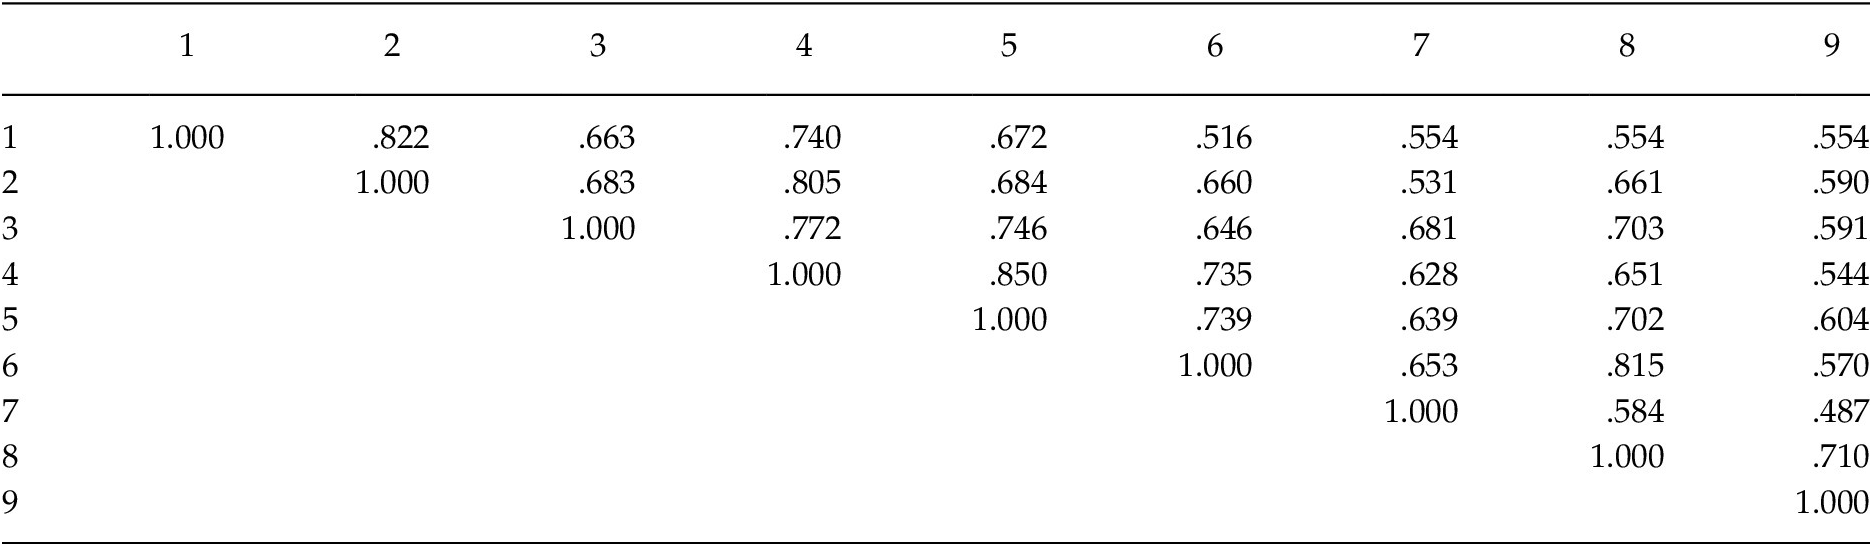
All the polychoric correlations were positive and ranged from .49 to .85 (Table 3).
Polychoric Correlations of the UWES-9 Items

CFA Model Fit
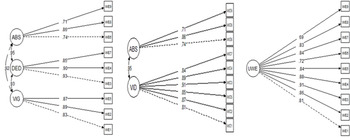
The bifactor models (classical bifactor and S–1 bifactor) did not converge; the rest of the models showed adequate goodness of fit in the CFI, TLI and SRMR indices; but, not in RMSEA and especially χ2 (Table 4 and Figure 1), which are very sensitive to small problems of correct model specification.
Goodness-of-Fit Indices for the 3F, 2F and 1F Models

Path Diagram of 3F, 2F and 1F Models

The ANOVA results showed that, comparing the three models, the three-factor model fits significantly better than the two-factor model, and the two-factor model fits significantly better than the one-dimensional model (Table 5).
Results Obtained in ANOVA Performed to Determine Differences in the Goodness of Fit of 3F, 2F and 1F Models

In Table 5 we observe that the three-factor model shows a significantly better goodness of fit, although the similar indices shown in Table 4 and the strong correlation observed between the factors, vigor (VIG)-dedication (DED) = .93; vigor-absorption (ABS) = .92; dedication-absorption = .95, allows us to propose the unidimensional model as the most parsimonious option. This type of structure, whether unidimensional or essentially unidimensional (i.e., bifactor), has the associated advantage that it allows to use the overall score of the test, instead of having to apply it as a multidimensional instrument (Trizano-Hermosilla et al., Reference Trizano-Hermosilla, Gálvez-Nieto, Alvarado, Saiz and Salvo-Garrido2021).
However, the fact that χ2 is significant without the circumstance of a large sample size is indicative of a certain degree of misspecification. In fact, due to content overlap, errors correlations have been observed between item of the: (a) Vigor dimension (Balducci et al., Reference Balducci, Fraccaroli and Schaufeli2010; Klassen et al., Reference Klassen, Aldhafri, Mansfield, Purwanto, Siu, Wong and Woods-McConney2012; Lovakov et al., Reference Lovakov, Agadullina and Schaufeli2017); (b) absorption dimension (Klassen et al., Reference Klassen, Aldhafri, Mansfield, Purwanto, Siu, Wong and Woods-McConney2012; Lovakov et al., Reference Lovakov, Agadullina and Schaufeli2017); (c) vigor and dedication dimension (Balducci et al., Reference Balducci, Fraccaroli and Schaufeli2010); and (d) vigor and absorption dimension (Lovakov et al., Reference Lovakov, Agadullina and Schaufeli2017). In these cases, the analyses of the modification indexes indicated the loss of fit due to the non-inclusion of these correlations.
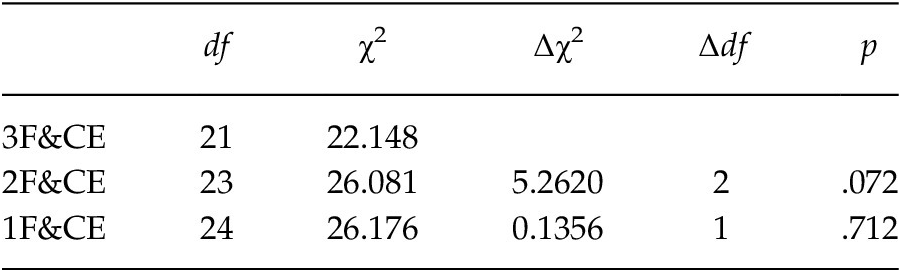
In the same way, in the present study, correlations between errors were found for: (a) Two items of vigor: “At my workplace, I feel full of energy” and “At my job, I feel strong and vigorous”; and (b) two items of absorption: “I am immersed in my work” and “I get completely lost in my work”. Thus, some general content overlap between pairs of items is indicated. Additionally, our results showed the existence of a significant error correlation between one item of dedication (I am proud of the work that I do) and one item of absorption (I am immersed in my work). Through including these correlations in the models (3F&CE, 2F&CE, 1F&CE), it was observed that the goodness of fit was now excellent in all the indices, including the χ2 test (Table 6).
Goodness-of-Fit Indices for the 3F&CE, 2F&CE, 1F&CE Models

In order to determine in terms of goodness of fit χ2 which model was the best, an ANOVA was applied (Table 7) in which no significant differences were observed between the three models considered. Thus, with the imperative to consider the parsimony criterion, this would lead us to choose the unidimensional model as the most appropriate.
ANOVA on the Differences in the Goodness-of-Fit of the 3F&CE, 2F&CE and 1F&CE Models

Predictive Validity of the UWES–9
As the factor structure of the UWES–9 conforms to a unidimensional model, using the overall score of the instrument to assess its predictive validity is warranted. In turn, as the instrument distinguishes three content domains (vigor, dedication and absorption), the predictive ability of the subscales was also assessed.
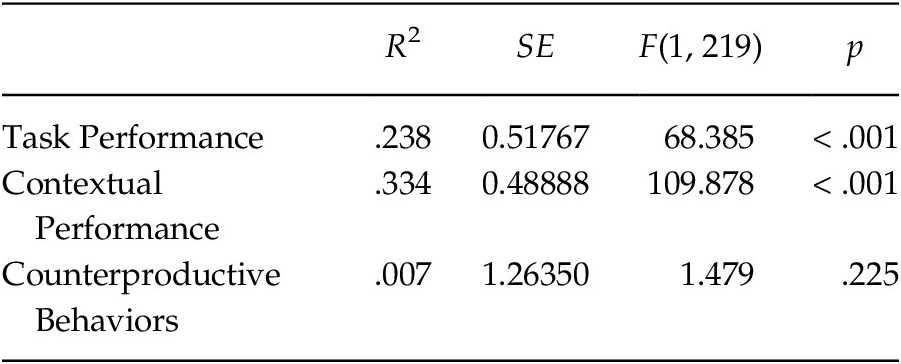
Self-assessed job performance was used as a criterion, measured with the Spanish adaptation of the IWPQ-Version 1.0, which reports three key factors: Task performance, contextual performance and counterproductive behavior. Simple regression analyses were performed, using the overall UWES–9 score as a predictor.
According to the results, the overall score of the UWES–9 significantly predicts the task and the contextual performance. Therefore, to the extent that workers show higher levels of WE, they consider their performance to be better, both in the core tasks associated with their work and in those that contribute to good organizational performance even when they are not formally associated with the work objectives. Furthermore, it was found that the WE explained a higher percentage (33.4%) of the variance of contextual performance than of the variance of task performance (23.8%). However, the WE did not significantly predict the counterproductive behavior (Table 8).
Results of Simple Regressions Performed to Evaluate the Predictive Power of WE as a unidimensional Measure

To determine the predictive power of each of the theoretical dimensions of the UWES–9, a multiple regression analysis was performed for each of the aspects of job performance used as criterion variables. The results showed the relevance of considering the scores in each of the UWES–9 subscales, since they provide different predictive information that may be useful depending on the purpose for which the WE is evaluated.
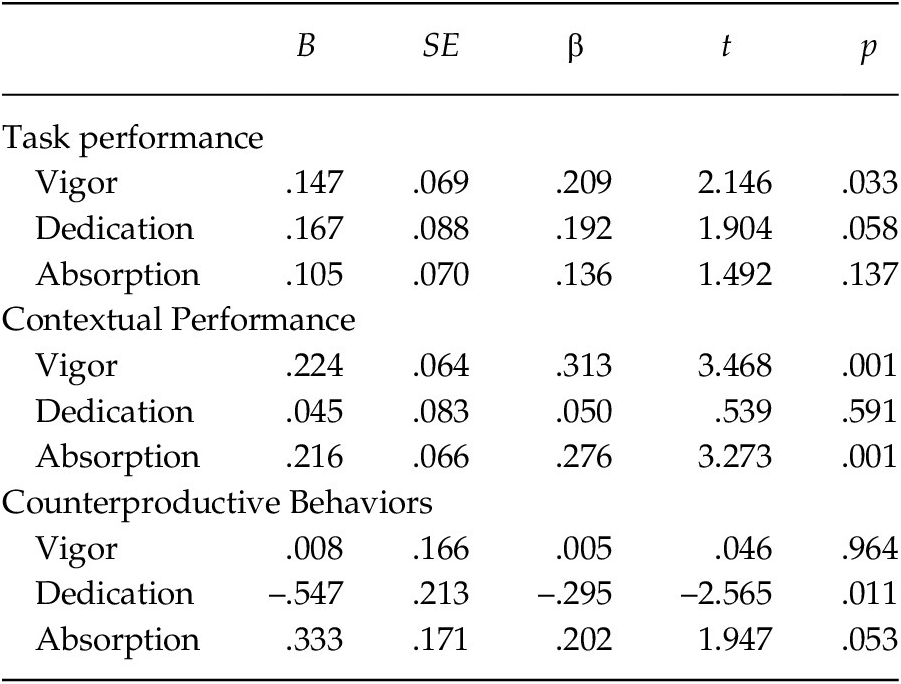
In the case of task performance, although the model significantly predicted this variable, R 2 = .239; F(1, 217) = 22.702, p < .001, the only dimension of the UWES–9 that significantly predicted task performance was "vigor" (Table 9); thus, participants considered their performance on tasks directly associated with their work to be higher as they experienced higher levels of energy and physical and mental resistance while working.
Results of the Multiple Regressions Performed to Evaluate the Predictive Power of the WE Dimensions

As for contextual performance, this variable was also significantly predicted by the model, R2 = .341; F(1, 217) = 33.446, p < .001, and both "vigor" and "absorption" significantly predicted the contextual performance, with vigor being the best predictor (Table 9). Thus, people indicated that they performed more frequently behaviors which, although not explicitly associated with their work objectives, contribute to the adequate performance of the organization, as they experienced greater vigor and felt more focused and absorbed in their work.
Finally, with regard to counterproductive behaviors, this variable was significantly predicted by the model, R 2 = .040; F(1, 215) = 2.965, p = .033; but the only relevant dimension of the UWES–9 was "dedication" (Table 9); so that, to the extent that people reported feeling more enthusiastic, inspired and proud of the work they do, they were less likely to exhibit behaviors that were detrimental to the well-being of the organization. The findings on counterproductive behaviors help to explain why, when the overall scale score is used as a predictor, it does not significantly predict the counterproductive behavior: The sum score cancels out because the counterproductive behavior is negatively related to the dedication factor, which is to be expected from the theory; but, it tends to be positively related to the absorption factor, which is contrary to what is expected from the theory, since, in principle, what would be expected is that the frequency of occurrence of counterproductive behaviors for the organization is lower in workers who report feeling more focused and absorbed in their work.
Discussion
The purpose of this study was to determine which factor structure of the UWES–9 is the most appropriate for the measurement of the construct in Ecuador, by comparing different models derived from WE theory and empirical evidence, as well as to evaluate its predictive validity with respect to the measurement of self-assessed job performance.
Regarding the factor structure of the UWES–9, first of all, our findings do not support the proposals of authors such as De Bruin and Henn (Reference De Bruin and Henn2013), Fong and Ho (Reference Fong and Ho2015) and Willmer et al. (Reference Willmer, Westerberg Jacobson and Lindberg2019) regarding the possible suitability of a partial bifactor model, since the S–1 bifactor model with the dedication factor as the reference factor and the classical bifactor model did not converge, probably as a consequence of the strong correlation between factors. Surely in samples in which the correlation between factors is lower, these models that propose essential one-dimensionality can be a good alternative to the unidimensional model.
Secondly, the results of the CFA conducted for the three-factor correlated, two-factor correlated (dedication + vigor and absorption) and one-factor models, evidenced that all three models showed CFI, TLI and SRMR indices indicating good fit; but, this was not the case for RMSEA and the χ2 test. This is consistent with that reported by Hallberg and Schaufeli (Reference Hallberg and Schaufeli2006), Lovakov et al. (Reference Lovakov, Agadullina and Schaufeli2017), and Vasquez et al. (2017). However, in the present study the models did differ significantly in terms of goodness of fit, with the 3F model being significantly superior to the other two. This superiority of the three-factor model coincides with the findings of authors such as Balducci et al. (Reference Balducci, Fraccaroli and Schaufeli2010), Breevaart et al. (Reference Breevaart, Bakker, Demerouti and Hetland2012), Chaudhary et al. (Reference Chaudhary, Rangnekar and Barua2012), Gómez Garbero et al. (Reference Gómez Garbero, Labarthe, Ferreira-Umpiérrez and Chiminelli-Tomás2019), Kataria et al. (Reference Kataria, Garg and Rastogi2013), Rodríguez Montalbán et al. (Reference Koopmans, Bernaards, Hildebrandt, de Vet and van der Beek2014), Schaufeli et al. (Reference Schaufeli, Bakker and Salanova2006), Villotti et al. (Reference Villotti, Balducci, Zaniboni, Corbière and Fraccaroli2014) and Yusoff et al. (Reference Yusoff, Ali, Khan and Bakar2013).
However, this level of analysis overlooks the fact that both in this and in other investigations a possible problem of misspecification has been detected, as the scale includes some items whose contents overlap. Specifically, in the Ecuadorian sample we have confirmed the content overlaps observed by Balducci et al. (Reference Balducci, Fraccaroli and Schaufeli2010), Klassen et al. (Reference Klassen, Aldhafri, Mansfield, Purwanto, Siu, Wong and Woods-McConney2012) and Lovakov et al. (Reference Lovakov, Agadullina and Schaufeli2017) between Items V1 (At my workplace, I feel full of energy) and V2 (At my job, I feel strong and vigorous), and by Klassen et al. (Reference Klassen, Aldhafri, Mansfield, Purwanto, Siu, Wong and Woods-McConney2012) and Lovakov et al. (Reference Lovakov, Agadullina and Schaufeli2017) between Items A8 (I am immersed in my work) and A9 (I get completely lost in my work). Additionally, in the present study we detected a new, previously unreported overlap between Items D7 Dedication (I am proud of the work that I do) and A8 (I am immersed in my work) that should be investigated in future studies to determine whether if it is a specific problem of the sample with which we have worked in the present study, or whether there is truly a relationship between these two indicators that is generalizable to other samples and cultures.
When CFA is performed in order to correct for this possible redundancy problem, the three models show excellent fit indices, with no statistically significant differences between them. On this point our results differ from what is reported by other authors in the sense that, in our case, by allowing for correlations between errors, the models were equivalent in terms of goodness of fit even considering the χ2 test; whereas, in all the studies consulted the authors conclude on the superiority or not of one model over another without considering the value of χ2 and in all previous research the χ2 was statistically significant. In fact, Fong and Ho (Reference Fong and Ho2015) point out that one of the methodological problems frequently encountered in studies on the UWES–9 is that researchers ignore significant χ2 values claiming that this test is very sensitive to detect model misfit when working with large samples. However, in actuality, the value of this fit index is usually ignored even in studies with small-moderate sample sizes.
The findings regarding the goodness of fit of the models by allowing correlations between errors would lead us to think that, since more complex structures do not represent an advantage over simple ones, parsimony would justify the use of the UWES–9 as a one-dimensional instrument of the WE. This one-dimensionality has some advantages from a metric point of view, such as being able to use the overall test score, which, according to Klassen et al. (Reference Klassen, Aldhafri, Mansfield, Purwanto, Siu, Wong and Woods-McConney2012) and Schaufeli et al. (Reference Schaufeli, Bakker and Salanova2006), may be preferable for the use of the UWES–9 across settings.
Nonetheless, this option clearly clashes with the theoretical conceptualization of WE as a multidimensional construct. The creators of the UWES–9 did not intend to construct a unidimensional instrument when developing the scale, but rather to reduce the number of items in order to maintain the distinction between the three dimensions. There is thus a conflict between the principle of parsimony and the theoretical proposal, the clarification of which requires a brief reflection on the theoretical model and the goodness of fit of the models.
A common mistake is to confuse one-dimensionality with homogeneity of construct measurement. The fact that the one-dimensional model shows a goodness of fit equivalent to that of a three-factor model does not imply that the dimensions do not exist. Rather, it simply implies that from the point of view of empirical fit it is not possible to differentiate the response to the items of each dimension. Thus, our results are evidence that, in the sample analyzed, the scale does not allow differentiation between the factors. This only indicates that, in different samples, one and other theoretical components operate and relate to each other in different ways; in some cases, they are so close that it is not possible to differentiate them, in other samples two of them can be observed or the three factors are clearly differentiated.
The investigator must bear in mind that the dimensions exist from the moment that the researcher has enunciated items for the evaluation of these dimensions. Thus, for example, Item 1 "At my workplace, I feel full of energy" (Vigor), is an indicator that tracks a content domain clearly different from Item 7 "I am proud of the work I do" (Dedication), and these in turn differ from Item 8 "I am immersed in my work" (Absorption). One should also note that vigor, dedication and absorption go hand in hand, so that a person who feels more involved and identified with their work, in turn, puts more effort into it and feels more absorbed when doing it.
In the educational setting, where employees tend to be highly engaged, it is not surprising that the three dimensions are strongly correlated, and that the most parsimonious model is the unidimensional one, which should not be confused with a simple measure or underrepresentation of the content domain. However, if the goodness of fit to the one-dimensional model is acceptable, it is possible to use the total score of the WE and conclude that WE significantly predict the self-evaluated task and contextual performance, which corroborates the reports of other researchers (Afacan-Findikli, Reference Afacan-Findikli2015; Breevaart et al., Reference Breevaart, Bakker, Demerouti and den Heuvel2015; Christian et al., Reference Christian, Garza and Slaughter2011; Dalal et al., Reference Dalal, Baysinger, Brummel and LeBreton2012; Gutermann et al., Reference Gutermann, Lehmann-Willenbrock, Boer, Born and Voelpel2017; Kim et al., Reference Kim, Kolb and Kim2013; Lorente et al., Reference Lorente, Salanova, Martínez and Vera2014; Lupano Perugini et al., Reference Lupano Perugini and Waisman2018; Motyka, Reference Motyka2018; Pongton & Suntrayuth, Reference Pongton and Suntrayuth2019; Qodariah et al., Reference Qodariah and Mauluddin2019; Rich et al., Reference Rich, Lepine and Crawford2010). Furthermore, it was found that the WE explained a higher percentage of the variance of contextual performance in relation to variance of task performance. According to Borman and Motowidlo (Reference Borman and Motowidlo1997), this may be due to one of the differences between task and contextual performance is that the contextual performance is more likely to be determined by relatively stable characteristics of individuals, such as the WE; whereas, the antecedents of the task performance rather involve cognitive abilities. However, contrary to what would be expected, the WE did not allow predicting the counterproductive behaviors.
Although the CFA results allow the total WE score to be used, the three-factorial structure is the most appropriate conceptualization. The dimensions are relevant not only from a theoretical point of view, but also because they allow predicting different aspects of job performance. Specifically, our results showed that task performance was significantly predicted only by vigor, the counterproductive behaviors were predicted only by dedication, and the contextual performance was predicted by both vigor and absorption, with vigor being the best predictor.
Based on the above, we conclude that, with regard to the structure of the UWES–9, our results are consistent with previous evidence that it is inappropriate to automatically generalize to any context the notion of WE as a construct consisting of the three dimensions proposed by Schaufeli and colleagues. Thus, there is a problem in terms of the magnitude of the correlations between the factors observed in different samples, which is aggravated by minor problems of content overlap between some items, as revealed by observed inter-error correlations.
Consequently, given the implications of accepting one or the other models (e.g., whether to use the total scale score or to work as if it were a multidimensional instrument with the scores of each subscale), we agree with authors such as Klassen et al. (Reference Klassen, Aldhafri, Mansfield, Purwanto, Siu, Wong and Woods-McConney2012) in asserting that conducting the CFA in each case is key for the applied researcher in order to understand well how the measurement of the construct operates in a given sample and to carry out the relevant analyses.
Any decision to accept one structure or the other should not be guided solely by goodness of fit or the principle of parsimony. Rather, the key is to reconcile theory with empirical evidence. In the search for this reconciliation, although it is possible to use the total score since there is an acceptable one-dimensional structure, the three-factor proposal is superior from a substantive and predictive point of view.
One of the main limitations of the present study is the use of a simple sample from a single economic sector, with predominately female participants. It is probable that if multiple samples with different characteristics had been collected, it would have been possible to reproduce all the variability of models proposed in the literature. Such an exercise would be desirable to validate our proposal that any empirical application will lead to small distortions due to the characteristics of the participants themselves, and that these should be taken into account for the correct use of the instrument scores.