Introduction
Concerns regarding the over-use of antibiotics in animal husbandry and the emergence of antimicrobial resistance have led to global efforts to limit their use in animal feed, with several countries implementing restrictions or bans (Li et al., Reference Li, Cheng, Chen, Qu, Zhao, Wen and Zhou2019; Melaku et al., Reference Melaku, Zhong, Han, Wan, Yi and Zhang2021; Rodrigues et al., Reference Rodrigues, Santos and Franco2022). These regulations aim to stimulate the development and adoption of antibiotic substitutes in livestock production.
In recent years, there have been numerous studies on various alternatives to in-feed antibiotics, such as microecological preparations, enzyme preparations, acid preparations, antimicrobial peptides, and plant extracts (Huang et al., Reference Huang, Liu, Zhao, Hu and Wang2018; Gao et al., Reference Gao, Yang, Zhao, Tang, Jiang and Yin2022). These alternatives have shown potential, but, often, they only partially fulfil the functions of antibiotics due to factors like production technology, dosage, and cost. Plant extracts, as natural antibacterial ingredients, have gained significant attention (Moré et al., Reference Moré, Cárdenas, Costa, Simoes and Aragón2017). These have emerged as promising alternatives to antibiotics in animal feed (Demirtas et al., Reference Demirtas, Ozturk and Piskin2018; Silva et al., Reference Silva, Da Costa, Ribon, Purgato, Diaz-Munoz and Diaz2019). Phytogenic compounds exhibit potent antimicrobial capacity and enhance various aspects of animal health, including nutrient absorption, immune function, and antioxidant capacity (Cheng et al., Reference Cheng, Hao, Xie, Wang, Dai, Huang and Yuan2014; Alvarez-Martinez et al., Reference Alvarez-Martinez, Barrajon-Catalan, Herranz-Lopez and Micol2021; Nguyen et al., Reference Nguyen, Thi, Diep, Nguyen and Bui2022). The abundance of diverse botanical resources in China provides a solid foundation for the development of phytogenic substitutes for antibiotics. In general, the search for antibiotic substitutes in animal husbandry is driven by the need to address growing concerns regarding antimicrobial resistance while promoting sustainable, eco-friendly agricultural practices. The development and adoption of alternative strategies, such as the use of plant extracts, will play a crucial role in achieving these goals. However, it is important to note that plant extracts also have limitations, such as limited acid and alkali resistance, heat stability, and service life. To overcome these limitations and ensure their bioefficacy, encapsulation or the utilization of protective host carriers is required.
Clay minerals, particularly palygorskite (Plg), have emerged as promising carrier materials for antibacterial applications, serving not only as carriers for antibacterial agents but also potentially contributing to antibacterial activity through their intrinsic properties (Haciosmanoglu et al., Reference Haciosmanoglu, Mejias, Martin, Santos, Aparicio and Alonso2022). Palygorskite has a 2:1 chain structure consisting of two layers of Si-O-Si tetrahedrons and one layer of magnesia octahedrons (Gu et al., Reference Gu, Kang, Wang, Lichtfouse and Wang2019). Its three-dimensional structure, nanomaterial properties, and surface negative charge contribute to its large specific surface area and strong ion exchange capacity (Chen et al., Reference Chen, Zhao and Wang2007; Sheikhhosseini et al., Reference Sheikhhosseini, Shirvani and Shariatmadari2013). Consequently, Plg has been used extensively as an adsorbent in aqueous remediation (Ghrab et al., Reference Ghrab, Eloussaief, Lambert, Bouaziz and Benzina2018). China possesses vast palygorskite resources, with significant deposits concentrated in Mingguang (Anhui Province), Xuyi (Jsangsu Province), and Linze (Gansu Province). These resources provide a solid foundation for the development of palygorskite as a mineral material (Zhang et al., Reference Zhang, He and Xu2012). Accumulating evidence indicates that palygorskite exhibits inherent antimicrobial activity. One proposed mechanism suggests that the negative surface charge – induced by isomorphic substitution – and the variable charges generated by the cleavage of edge valence bonds, facilitate the electrostatic adhesion of Plg onto bacterial cell membranes. This adhesion may disrupt the permeability of the cells and impede the normal exchange of materials between the bacteria and the environment, thereby resulting in a bactericidal effect (Drucker et al., Reference Drucker, Goldhar, Ogra and Neter1977; Ruiz-Hitzky et al., Reference Ruiz-Hitzky, Darder, Fernandes, Wicklein, Alcântara and Aranda2013; Shu et al., Reference Shu, Zhang, Xie, Ouyang and Yang2018). Another hypothesis suggests that the bacteriostatic effect of palygorskite could be attributed to the needle-like or rod-shaped crystals, which can damage the cytoplasmic membrane of cells (Cai et al., Reference Cai, Zhang, Ouyang, Ma, Tan and Peng2013). Due to its low cytotoxicity and excellent biocompatibility, Plg has been used increasingly as an animal feed additive to improve gastrointestinal health and nutrient absorption (Tzora et al., Reference Tzora, Giannenas, Karamoutsios, Papaioannou, Papanastasiou, Bonos and Skoufos2017; Kanoulas et al., Reference Kanoulas, Papadopoulos, Tassis, Koutouzidou, Arsenos and Fortomaris2022). Studies have shown the potential of palygorskite as a carrier for plant extracts in feed (He et al., Reference He, Liu, Dai, Yao, Li, Xie and Deng2023). For example, palygorskite/ginger essential oil nano-hybrid materials have exhibited synergistic antibacterial effects against E. coli (Lei et al., Reference Lei, Wei, Wang, Su, Xue, Liu and Hu2017). Furthermore, the combination of a specific dosage of palygorskite and oregano essential oil has proven beneficial for growth performance, intestinal microbiota, and intestinal morphology in broilers (Skoufos et al., Reference Skoufos, Giannenas, Tontis, Bartzanas, Kittas, Panagakis and Tzora2016).
The utilization of plant extracts as feed additives is restricted primarily by their high volatility, environmental sensitivity, and premature release in the digestive tract, which may reduce their biological efficacy. Although Plg shows promise as a protective host for organic molecules due to its large specific surface area, nanorod morphology, and excellent adsorption capacity, extant literature on plant–Plg composites has mainly focused on essential oils or crude feed applications. In contrast, the preparation of polyphenol-rich plant extract/Plg composites, particularly via a simple grinding strategy, remains poorly investigated. Moreover, the release behavior of such composites under different gastrointestinal pH conditions and its relationship with antibacterial performance have not been elucidated systematically.
Based on the hypothesis that Plg can stabilize plant polyphenols through hydrogen bonding, surface adsorption, and physical encapsulation, this study developed a series of GPE/GSE-Plg composites. Compared with previous work on palygorskite-based antibacterial materials, this study not only employed two polyphenol-rich grape-derived extracts as active agents, but also combined material characterization, simulated gastrointestinal release analysis, and antibacterial evaluation against Staphylococcus aureus to establish a more integrated understanding of structure–function relationships. Conclusively, this work provides a sustainable and facile strategy for the design of high-performance, mineral-based antimicrobial materials.
Materials and methods
Materials
Grape pip extract (GPE) was purchased from Xi’an Prius Bioengineering Co., Ltd. Grape skin extract (GSE) was purchased from Xi’an Guohao Technology Co., Ltd. Raw palygorskite was obtained from Jiangsu Xuyi Palygorskite Company, China. All other reagents used in this study were of analytical purity grade, and the resistivity of ultrapure water was >18 MΩ·cm. Luria–Bertani (LB) broth and nutrient agar (NA) media were obtained from Qingdao Hope Bi-Technology Co. Ltd.
Methods
Preparation of GPE/GSE-Plg composite
Palygorskite was washed with ultrapure water to remove surface impurities. Palygorskite was then freeze-dried using a vacuum freeze dryer; then it was ground and sieved to obtain the desired particle size fraction, i.e. <75 μm. Thermal treatment was performed using a muffle furnace (Kejing, KSL-1000X, China). Plg was thermally treated at 300°C for 2 h to activate the mineral and enhance its loading capacity. This treatment removes adsorbed and zeolitic water to clear crystal channels while maintaining structural integrity, as palygorskite remains stable below 400°C. To prepare the GSE/GPE-Plg composite, different mass ratios of GPE/GSE to palygorskite (mE/mPlg=1:1, 5:1, and 10:1) were placed in an agate mortar. An appropriate amount of anhydrous ethanol (0.1 mL per g of solid mixture) was added, and the mixture was subsequently subjected to wet grinding for 30 min to facilitate thorough mixing and interaction among the components. The resulting samples were kept in the sample cabinet in sealed, light-resistant containers at 25°C.
Composite characterization
FTIR spectra were measured in transmission absorption mode over the 4000–400 cm–1 region using a FTIR spectrometer (Thermo Scientific, Nicolet Is50, USA), with the samples prepared in KBr pellets. Measurement of mass changes and thermal effects of different materials was done using a thermogravimetric analyzer (Netzsch, STA449F3, Germany). The experiments were carried out under N2 atmosphere from room temperature to 800°C with a heating rate of 10°C min–1. The specific surface area and pore-size distribution of the materials were evaluated using the Brunauer–Emmett–Teller (BET) and Barrett-Joyner-Halenda (BJH) methods (Wang et al., Reference Wang, Wei, Zhou, Yao, Xu, Zhang and Shi2022). Nitrogen adsorption/desorption experiments were conducted to estimate the material’s adsorption capacity using the BET multi-channel automatic specific surface area and porosity analyzer-3020 instrument (Micromeritics Instruments Co., Ltd, Tristar II 3020 Plus, China).
Release behavior of grape pip/skin extract from composites
Absorption spectra (wavelength range of 200–800 nm) were obtained from the GPE/GSE solution. Compared with the prepared blank, the maximum wavelengths were 290 and 280 nm, respectively. The substances corresponding to these two wavelengths are most likely flavonoids and proanthocyanidins (Wang et al., Reference Wang, Li, Hass, Peng and Wang2021; Utami et al., Reference Utami, Syahputra, Dona, Fadhli, Furi and Ikhtiarudin2023). The release behavior of GPE/GSE extracts from synthesized composite materials was investigated using UV-Vis spectroscopy (Ao Yi Instrument Co., Ltd, UV-1800PC, China). A total of 0.1 g of GPE/GSE and 0.2 g of GPE/GSE-Plg (mE/mPlg=1:1) were added separately into a 50 mL centrifuge tube. Subsequently, 25 mL of ultrapure water/pH = 4 acid solution was added to each tube. These tubes were then placed on a constant temperature shaking table, set at 35°C and 175 r min–1. At predetermined reaction times (0, 5, 10, 20, 30, 45, 60, 120, 180, 240, and 480 min), aliquots of the suspension were withdrawn and filtered through 0.45 μm syringe filters into colorimetric tubes to separate the solid clay from the liquid phase. The concentration of GPE/GSE remaining in the filtrate was determined by UV–Vis spectrophotometry and used to calculate the amount of GPE/GSE loaded onto the clay. All experiments were performed in triplicate to ensure the reliability of the results.
Bacteriostatic experiment in vitro
The bacterial suspension stored in the –80°C refrigerator was retrieved and allowed to thaw. Subsequently, using a disposable inoculation loop, the bacterial suspension was transferred onto an LB agar plate. The plate was then placed in an incubator set at 37°C and incubated in an inverted position for 12–18 h. Individual bacterial colonies from the first-generation plate were then picked and marked on a new LB agar plate (the second generation) using a new disposable inoculation loop. Following that, individual colonies from the second-generation plate were picked using a new disposable inoculation loop and cultured for an additional 8–12 h on plates of the third generation. Single colonies were selected and cultured in glass bottles containing LB broth at 37°C and 180 r min–1 for 12 h (Aichayawanich and Ngaouwthong, Reference Aichayawanich and Ngaouwthong2012; Ramachandran et al., Reference Ramachandran, Alharbi, Chackaravarthy, Chelliah, Rajivgandhi, Maruthupandy and Li2023). The bacterial suspension was then diluted to 108 CFU mL–1. Disposable medical cotton swabs were dipped in the bacterial suspension and used to coat LB media. The bottom of each Petri dish containing LB agar was divided into four zones and marked at the corresponding corners. A hole was made at the center of each zone using the upper end of a 1 mL pipette tip, and the agar within each hole was removed using sterile tweezers. The tweezers were sterilized by heating with an alcohol lamp, and the bottom edge of each hole was gently heated with the sterilized tweezers to prevent the sample suspension from leaking into the surrounding agar. Then, 200 μL of sample suspensions with different mass ratios were added to the holes in the following order: pure grape seed/skin extract and low-, medium-, and high-ratio mE/mPlg grape seed/skin extract–attapulgite composite materials. The samples were allowed to dry at room temperature for 2–3 h, after which the Petri dishes were incubated in an inverted position at 37°C for 24 h (Neog and Kola, Reference Neog and Kola2020). The inhibition zones were observed, and their diameters were measured using a vernier caliper. All measurements were performed in triplicate to ensure accuracy. All procedures were conducted under aseptic conditions.
Results and discussion
Formation and characterization of GPE/GSE-Plg
Fourier transform infrared spectroscopy
Analysis of the FTIR spectra (Fig. 1) shows the characteristic absorption bands for various materials. The main antibacterial active components of GPE/GSE are flavonoids, proanthocyanidins, and resveratrol (Azuma et al., Reference Azuma, Yakushiji, Koshita and Kobayashi2012; Fernández et al., Reference Fernández, Vega and Aspé2015). In the case of GPE, the FTIR spectrum shows stretching vibrations of OH– and antisymmetric stretching vibrations of CH2 at 3503 cm–1 and 2914 cm–1, respectively. The absorption bands between 1400 and 1600 cm–1, 1282 cm–1, and between 800 and 900 cm–1 are attributed to the C=C stretching vibration of aromatic O-H stretching vibrations peak, and aromatic C-H bending, respectively. For palygorskite, the characteristic band at 3614 cm–1 is attributed to the O-H stretching vibration of the Al-O-H group. The bands at 1016 cm–1 and 465 cm–1 are related to the asymmetric stretching vibration of Si-OH and O-Si-O of palygorskite (Hui et al., Reference Hui, Yan, Wang, Wang, Zhou and Wang2020). In the case of GPE-Plg, there is a shift in the band of Si-OH groups at 1023 cm–1 compared with Plg (1016 cm–1). This shift, combined with the blue shift in the bands at 2925 cm–1, suggests potential H-bonding interactions between the oxygen-containing groups in GPE molecules and Si-OH groups on the surface and channels of palygorskite (Zhong et al., Reference Zhong, Mu, Yan, Jing, Hui and Wang2021). There is also a blue shift in the bands at 2925 cm–1, suggesting a potential weak H-bond between GPE and Plg. The presence of aromatic hydrocarbon characteristic absorption bands of ~1400–1600 cm–1 indicates successful loading of GPE on palygorskite (Zhang et al., Reference Zhang, Wang, Zhang, Liu and Wang2015; Nogales-Bueno et al., Reference Nogales-Bueno, Baca-Bocanegra, Rooney, Hernandez-Hierro, Heredia and Byrne2017;). Similarly, for GSE and GSE-Plg, the FTIR spectra show characteristic absorption bands for GSE and palygorskite, indicating successful loading of GSE on palygorskite.
(a) FTIR spectra of grape pip extract (GPE), palygorskite (Plg), and grape pip extract-palygorskite composite (GPE-Plg) and (b) FTIR spectra of grape skin extract (GSE), palygorskite (Plg), and grape skin extract-palygorskite composite (GSE-Plg).

Figure 1. Long description
Panel a displays three stacked F T I R spectra. The top blue line G P E shows a broad trough at 3503 and a sharp peak at 1623. The middle black line Plg shows a sharp peak at 3614 and a deep trough at 1016. The bottom red line G P E dash Plg composite combines features of both, with a broad trough at 3431 and a peak at 1023.
Panel b displays three stacked F T I R spectra. The top blue line G S E has a broad trough at 3339 and multiple small peaks between 1671 and 1350. The middle dark purple line Plg shows peaks at 3622 and 1621 with a deep trough at 1020. The bottom red line GS E dash Plg composite shows a broad trough at 3436 and a shifted trough at 991.
In both panels, the x-axis ranges from 4000 to 400 centimeters super minus 1, and the y-axis represents Transmittance percent. Common inflection points for Plg are noted at 776 and 511 to 516 across both sets of data.
Thermogravimetric analysis
The results of TGA and DTG characterization of palygorskite, GPE/GSE-Plg, and GPE/GSE are shown in Fig. 2. The TGA (Fig. 2a,c) results show that compared with palygorskite, the mass of GPE-Plg is reduced by 17.72%, and the mass loss of GSE-Plg is 26.42%, and the mass loss mainly occurs at 200–450°C, indicating that it is due mainly to the removal of GPE/GSE. Therefore, it can be shown that GPE/GSE has been loaded into palygorskite effectively; i.e. GPE/GSE-Plg composites have been prepared successfully. The DTG results (Fig. 2b,d) show that the mass loss of GPE/GSE-Plg composites can be divided into four stages. The first stage occurs below 200°C, where the mass loss is mainly attributed to the removal of physically adsorbed surface water and water molecules residing within the structural channels of palygorskite (Giustetto et al., Reference Giustetto, Xamena, Ricchiardi, Bordiga, Damin, Gobetto and Chierotti2005). The second stage occurs between 200 and 450°C, and the mass loss in this stage is due to the removal of GPE/GSE. Additionally, the peak value of GPE/GSE-Plg at this stage is delayed compared with that of GPE/GSE, and the changing trend is relatively slow. The third stage occurs between 450 and 650°C, and the mass loss in this stage is due to the loss of structural water in palygorskite. The fourth stage occurs between 650 and 800°C, and the mass loss at this point is caused by the collapse of the palygorskite’s crystal frame (Antosik et al., Reference Antosik, Makuch and Gziut2022). TGA results confirmed that the active organic components remain thermally stable up to 200°C, which far exceeds the standard steam-pelleting temperatures of 80–90°C used in the poultry feed industry. Furthermore, compared with GPE/GSE, the temperature corresponding to the maximum thermal decomposition peak of GPE/GSE-Plg was shifted to a higher value, and the peak intensity was significantly reduced, indicating that the incorporation of palygorskite further enhanced the thermal stability of the composite material.
(a) TGA and (b) DTG curve of palygorskite (Plg), grape pip extract-palygorskite composite (GPE-Plg), and grape pip extract (GPE), (c) TGA and (d) DTG curve of palygorskite (Plg), grape skin extract-palygorskite composite (GSE-Plg), and grape skin extract (GSE).

Figure 2. Long description
Panel a and c are T G A graphs with x-axis Temperature in degrees Celsius from 0 to 900 and y-axis Weight percentage from 20 to 100. Panels b and d are D T G graphs with x-axis Temperature from 0 to 800 and y-axis Derivative weight in percent per minute.
Panel a: Plg shows a stepped decrease to 80 percent. G P E shows a steep decline to 45 percent. G P E- Plg is intermediate, ending at 60 percent. Vertical arrows indicate weight differences of 17.72 percent and 14.99 percent.
Panel b: D T G curves show peaks at various temperatures. Plg has peaks at 95, 186, 478, and 709. G P E has peaks at 86, 198, 296, and 494. G P E-Plg shows peaks at 102, 155, 300, and 680.
Panel c: Similar to panel a, Plg ends at 80 percent. G S E shows a very sharp drop between 200 and 400 degrees, ending near 30 percent. G S E- Plg ends at 50 percent. Vertical arrows show differences of 26.42 percent and 22.72 percent.
Panel d: Plg peaks are at 95, 186, 479, and 710. G S E shows a massive peak at 308 and smaller peaks at 86 and 496. G S E-Plg shows peaks at 94, 164, 317, and 693.
Scanning electron microscopy
The morphologies and microstructures of Plg, GPE-Plg, and GSE-Plg were characterized using scanning electron microscopy (SEM). Natural Plg exhibited a rod-like structure (Jiang et al., Reference Jiang, Yan, Zhang, Yang, Sarwar, Tang and Yang2023) as shown in Fig. 3a. After the GPE/GSE was compounded with Plg by mechanical force, it was found that the rod-like structure of Plg was wrapped by GPE/GSE, and the surface of the entire GPE/GSE-Plg showed an uneven layered structure, as shown in Fig. 3b,c. In Fig. 4, compared with the Plg itself, the atomic ratio and mass ratio of C in GPE-Plg and GSE-Plg significantly increased, while the atomic ratio and mass ratio of O, Al, Mg, and Si decreased to a certain extent, which was caused by the loading of organic matter in GPE/GSE on Plg. Due to the poor thermal resistance and low thermal conductivity of GPE/GSE, the bombardment of high-energy electron beamed on the surface of these samples will cause surface damage, but the damage in areas with rod-like structure was less. It also showed that the addition of Plg could improve the resistance of the material to the electron beam and improve its stability to some extent. The distribution of elements on the surface was observed by means of energy dispersive spectrometry. In Fig. S1 (Supplementary material) C, O, Mg, Al, and Si are distributed uniformly on the surface of the Plg; among these elements, Si had the strongest signal intensity. The element mapping diagram of GPE-Plg is shown in Fig. S2 shows the element mapping diagram of GPE-Plg. Compared with Plg, the distribution of C in GPE-Plg was clearly tighter, and the distribution of O and Si more sparse. The same situation was observed in GSE-Plg (Fig. S3). It also could be inferred that GPE/GSE was loaded successfully on the surface of the Plg.
SEM images of (a) palygorskite (Plg), (b) grape pip extract-palygorskite composite (GPE-Plg) and (c) grape skin extract-palygorskite composite (GSE-Plg).

Figure 3. Long description
A three-panel S E M micrograph series arranged horizontally.
* Panel a shows palygorskite Plg. The surface is densely packed with distinct, elongated rod-like crystals and small fibrous bundles oriented in various directions. A scale bar in the bottom-right indicates 500 nanometers.
* Panel b shows the grape pip extract-palygorskite composite GPE-Plg. The rod-like structures from the original Plg are still visible but appear partially embedded or coated by larger, irregular, and smoother mass-like aggregates. A scale bar in the bottom-right indicates 500 nanometers.
* Panel c shows the grape skin extract-palygorskite composite G S E-P l g. The morphology features a more continuous, film-like coating over the mineral surface. The underlying rod-like structures are less distinct compared to panel a, appearing integrated into a larger, rounded globular structure. A scale bar in the bottom-right indicates 500 nanometers.
EDS images of (a) palygorskite (Plg), (b) grape pip extract-palygorskite composite (GPE-Plg) and (c) grape skin extract-palygorskite composite (GSE-Plg).

Figure 4. Long description
A three-panel E D S analysis. Each panel contains a line graph of Counts versus Energy in k e V and two inset horizontal bar charts showing Weight percentage in purple and Atomic percentage in green.
Panel a for P l g shows a spectrum with a dominant S i peak at approximately 1.8 ke V, followed by a high O peak at 0.5 k e V, and smaller peaks for A l, M g, and C. The bar charts indicate a composition of 37.9 percent O and 35.3 percent Si by weight.
Panel b for G P E -P l g shows a significant increase in the C peak at approximately 0.3 k e V compared to panel a. The S i peak remains the highest. The bar charts show C has increased to 36.4 percent by weight and 50.2 percent by atomic percentage, while S i and O percentages have decreased.
Panel c for G S E-P l g shows the highest C peak among the three samples. The bar charts confirm this trend with C reaching 40.2 percent by weight and 53.3 percent by atomic percentage. The S i peak is noticeably lower in relative intensity compared to the previous panels, with its weight percentage dropping to 21.1 percent.
Brunauer–Emmett–Teller method
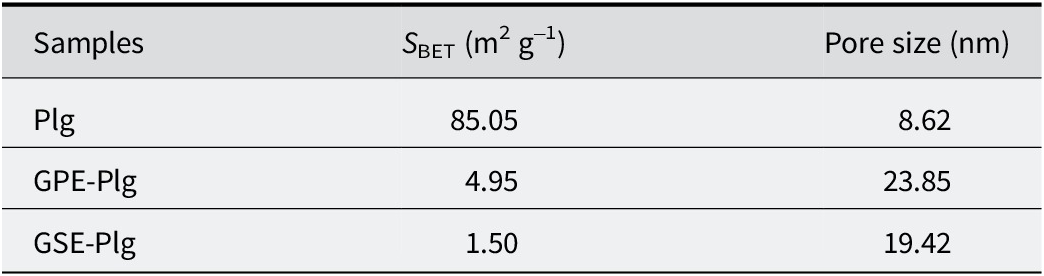
The results of the adsorption and desorption curves show a typical type IV curve (Ouyang et al., Reference Ouyang, Gu, Zhang, Yang, Jin, Chen and Jiang2018) (Fig. 5a–c). The type IV isotherm is derived from mesoporous adsorbent materials (e.g. many oxide colloids, industrial adsorbents, and mesoporous molecular sieves) (Schneider, Reference Schneider1995; Buttersack, Reference Buttersack2019). When the relative pressure is >0.8, a slender H3 hysteresis loop was observed, indicating that the samples have mesoporous characteristics (Liu et al., Reference Liu, Duan, Song, Hu and Zeng2019). The adsorption properties of mesoporous pores are determined by the adsorbent-adsorbent interaction and the interaction between molecules in the condensed state (Coasne et al., Reference Coasne, Grosman, Ortega and Simon2002). The BET method was employed to calculate the specific surface area of the three materials (Wang et al., Reference Wang, Zhang, Tian and Wang2015). The results indicate that palygorskite possessed a large specific surface area of 85.05 m2 g–1, providing ample space for the loading of plant extracts. In comparison, the BET-specific surface area of GPE-Plg is 4.95 m2 g–1, which is 16 times lower than that of palygorskite. Similarly, the BET-specific surface area of GSE-Plg is 1.5 m2 g–1, again, much smaller than that of palygorskite, as depicted in Table 1. Furthermore, the pore size of the GPE/GSE-Plg composites was bigger than that of palygorskite. Therefore, based on pore structure analysis, we inferred that GPE/GSE molecules are not only adsorbed on the surface of palygorskite but also penetrate the channels or pores of palygorskite, a similar outcome to the results for experiments with Maya blue or Maya blue-like pigments (Doménech et al., Reference Doménech, Doménech-Carbó, Vidal-Lorenzo and de Agredos-Pascual2012). While this significant reduction in surface area confirms the successful loading and encapsulation of the extracts within the clay matrix, it is important to consider that such severe pore blockage may partially compromise the inherent adsorption functionality of palygorskite, such as its ability to bind mycotoxins or other harmful substances in the digestive tract. Therefore, in practical applications, a strategic balance between the dosage of plant extracts and the preservation of the clay’s own gut-protective properties should be optimized according to specific therapeutic needs.
Adsorption desorption and pore-size distribution curves of (a) palygorskite (Plg), (b) grape pip extract-palygorskite composite (GPE-Plg), and (c) grape skin extract-palygorskite composite (GSE-Plg).

Figure 5. Long description
The image consists of three vertically stacked panels labeled a, b, and c.
Panel a P l g. The main graph plots Quantity Adsorbed in centimeters cubed per gram S T P on the y axis from 0 to 120, against Relative Pressure P forward slash P o on the x axis from 0.0 to 1.0. Both adsorption (black) and desorption (red) curves show a gradual increase until a relative pressure of 0.8, followed by a sharp asymptotic rise to 110. An inset graph shows d V forward slash d w Pore Volume against Pore Width in nanometers on a logarithmic scale from 1 to 100. The orange desorption curve peaks sharply at approximately 4 nanometers.
Panel b G P E- P l g. The main graph y axis ranges from 0 to 25. The curves remain nearly flat until a relative pressure of 0.9, where they rise sharply to a maximum of 20. The inset graph shows a green desorption curve with a prominent, narrow peak at 4 nanometers.
Panel c G S E -P l g. The main graph y axis ranges from 0 to 8. The curves show minimal adsorption until a relative pressure of 0.8, rising to a peak of approximately 6.5. The inset graph shows a blue desorption curve that starts with a high value at 3 nanometers, drops sharply, and then exhibits a broad, low plateau between 5 and 20 nanometers.
Pore structure parameters of Plg, GPE-Plg, and GSE-Plg

Table 1. Long description
The table consists of three columns and four rows including the header.
Column 1: Samples.
Column 2: S sub BET in meters-squared per gram.
Column 3: Pore size in nanometers.
Data rows:
1. P l g: S sub BET is 85.05. Pore size is 8.62.
2. G P E-P l g: S sub BET is 4.95. Pore size is 23.85.
3. G S E-P l g: S sub BET is 1.50. Pore size is 19.42.
Kinetic study of GPE/GSE-Plg
By establishing pseudo-first order and pseudo-second order kinetic models, the release behavior of GPE/GSE molecules from GPE/GSE-Plg, which served as the carrier for the active component, was investigated. The pseudo-first order model is expressed mathematically as Eqn 1:

where q e (mg g–1) is the desorption equilibrium capacity, q t (mg g–1) is the instantaneous desorption capacity, and t is the desorption time (min). k 1 (min−1) is the rate constant of the desorption in the pseudo-first order model.
The pseudo-second order model is described as Eqn 2:

where q e (mg g–1) and q t (mg g–1) are the equilibrium and time of desorption capacity, respectively. t is the desorption time (min). k 2 (g mg–1 min–1) is the rate constant of desorption in the pseudo-second order model.
The model parameters and determination coefficients (R2) are listed in Table 2. According to R2, the four materials all belonged to the pseudo-second order kinetic model. Diffusion-based models were not considered in this study because the release process of GPE/GSE from the composite materials involves the disruption of hydrogen bonds and electrostatic interactions between the polyphenolic molecules and the active sites of palygorskite. Therefore, the release behavior is primarily interpreted as a desorption-controlled process rather than a pure diffusion-controlled process, which aligns with the excellent fit of the pseudo-second order kinetic model that typically describes chemical desorption involving valence forces. As shown in Fig. 6, the desorption equilibrium capacity of GPE/GSE-Plg in ultrapure water was lower than that of GPE/GSE. The desorption rate constant (k 2) of the GSE was six times that of the GSE-Plg in Table 2, which indicated that the release rate of GSE in water is larger than that of GSE-Plg. As the gastric environment of piglets has a pH of approximately 4, an acidic solution with a pH of 4 was used to simulate the release kinetics. As depicted in Fig. 7, basically consistent with the above situation, the desorption equilibrium capacity of GPE/GSE-Plg in an acidic solution was lower than that of GPE/GSE. The desorption rate constant (k 2) of the GSE was three times that of the GSE-Plg. There was no significant difference in k 2 between GPE-Plg and GPE. Therefore, the addition of palygorskite made the sustained-release performance of GSE significantly better than that of pure GSE, while the sustained-release performance of GPE-Plg was not significantly improved compared with pure GPE. Moreover, the slow-release ability in ultra-pure water was greater than that in acidic solution.
Kinetic parameters for the release of samples, at 308 K

Table 2. Long description
The table is organized into eight columns. The first two columns identify the Solutions and Samples. The next three columns represent the Pseudo-first order model with parameters k sub 1 (per minute), q sub e (mg per g), and R super 2. The final three columns represent the Pseudo-second order model with parameters k sub 2 (g per mg per ), q sub e (mg per g), and R super 2.
Under Ultrapure water:
* G P E: Pseudo-first-order (k sub 1: 0.49, q sub e: 1056.8, R super 2: 0.9838); Pseudo-second order (k sub 2: 8.74 times 10 super minus 4, q sub e: 1085.9, R super 2: 0.9977).
* G P E- Plg: Pseudo-first order (k sub 1: 0.50, q sub e: 971.3, R super 2: 0.9494); Pseudo-second-order (k sub 2: 8.75 times 10 super minus 4, q sub e: 1004.4, R super 2: 0.9896).
* GSE: Pseudo-first-order (k sub 1: 0.70, q sub e: 998.8, R super 2: 0.9948); Pseudo-second-order (k sub 2: 1.02 times 10 super minus 2, q sub e: 999.5, R super 2: 0.9942).
* GSE-Plg: Pseudo-first-order (k sub 1: 0.41, q sub e: 813.3, R super 2: 0.9769); Pseudo-second-order (k sub 2: 1.70 times 10 super minus 3, q sub e: 825.9, R super 2: 0.9774).
Under p H equals 4:
* GPE: Pseudo-first-order (k sub 1: 0.06, q sub e: 904.9, R super 2: 0.9423); Pseudo-second-order (k sub 2: 1.22 times 10 super minus 4, q sub e: 967.5, R super 2: 0.9691).
* GPE-Plg: Pseudo-first-order (k sub 1: 0.08, q sub e: 875.7, R super 2: 0.9813); Pseudo-second-order (k sub 2: 1.77 times 10 super minus 4, q sub e: 921.4, R super 2: 0.9931).
* GSE: Pseudo-first-order (k sub 1: 0.09, q sub e: 1009.9, R super 2: 0.9695); Pseudo-second-order (k sub 2: 2.12 times 10 super minus 4, q sub e: 1051.8, R super 2: 0.9805).
* GSE-Plg: Pseudo-first-order (k sub 1: 0.04, q sub e: 862.5, R super 2: 0.9430); Pseudo-second-order (k sub 2: 6.93 times 10 super minus 5, q sub e: 950.2, R super 2: 0.9580).
Release characteristics in ultrapure water of (a) grape pip extracts (GPE) and grape pip extract-palygorskite composite (GPE-Plg), and (b) grape skin extracts (GSE), and grape skin extract-palygorskite composite (GSE-Plg).

Figure 6. Long description
Two vertically stacked line graphs labeled a and b. Both graphs share the same axes. The x-axis represents time t in minutes from 0 to 500. The y-axis represents q sub t in milligrams per gram from 0 to 1200.
Panel a shows data for GPE and GPE-Plg. Blue squares represent GP E, showing a rapid logarithmic increase in the first 50 minutes, reaching a plateau near 1100 milligrams per gram. Red circles represent GPE-Plg, following a similar rapid initial release but plateauing lower, near 1000 milligrams per gram. Solid lines represent the Pseudo-first-order model and dashed lines represent the Pseudo-second-order model, both closely fitting the data points.
Panel b shows data for GSE and GSE-Plg. Teal upward-pointing triangles represent GS E, rising sharply to plateau around 1000 milligrams per gram. Orange downward-pointing triangles represent GSE-Plg, which shows more variability with error bars and plateaus significantly lower, near 800 milligrams per gram. Similar to panel a, solid lines for Pseudo-first-order and dashed lines for Pseudo-second-order models are plotted through the data.
Release characteristics in acid solution (pH = 4) of (a) grape pip extract (GPE) and grape pip extract-palygorskite composite (GPE-Plg), and (b) grape skin extract (GSE), and grape skin extract-palygorskite composite (GSE-Plg).

Figure 7. Long description
Two vertically stacked line graphs. Both graphs share the same axes: the x-axis represents time t in min from 0 to 500, and the y-axis represents q sub t in m g / g from 0 to 1200.
Panel a: Release kinetics for G P E and GPE-Plg. Both datasets show a rapid logarithmic increase in the first 50 minutes, reaching a plateau around 800 to 1000 m g / g. G P E is represented by blue squares and GPE-Plg by red circles. Solid lines represent the Pseudo-first-order model, and dashed lines represent the Pseudo-second-order model. The models closely overlap the data points.
Panel b: Release kinetics for GSE and GSE-Plg. GS E, shown as blue upward triangles, reaches a higher plateau near 1000 to 1100 m g / g. G S E-Plg, shown as orange downward triangles, exhibits a slower initial release rate and plateaus lower, around 800 to 900 mg / g. Similar to panel a, solid lines indicate the Pseudo-first-order model and dashed lines indicate the Pseudo-second-order model, with the dashed lines showing a slightly better fit for the G S E-Plg data at later time points.
Antibacterial properties of GPE-Plg and GSE-Plg
The antibacterial activity of GPE/GSE and GPE/GSE-Plg against Gram-positive bacteria (S. aureus) was evaluated using the inhibition zone method (Lashgari et al., Reference Lashgari, Ghamami, Golzani, Salgado-Morán, Mendoza-Huizar and Romero2018; Yabalak et al., Reference Yabalak, Eliuz and Nazli2022). In Fig. 8 and Fig. S4 (Supplementary material) GPE/GSE (pure) and GPE/GSE-Plg (low, mid, high) all showed obvious antimicrobial performance against S. aureus. In contrast, pure palygorskite showed no discernible antibacterial activity. The inhibition zone diameter of pure extract was larger than that of the composite, and the antibacterial performance of GPE on S. aureus was stronger than that of GSE. According to Fig. 9a, the diameters of the inhibition zones of pure GPE and pure GSE were 11.5 mm and 6.5 mm, respectively. GPE-Plg had shown obvious antibacterial performance at low mE/mPlg, and its inhibition zone diameter was 9.6 mm, 6.6 times that of GSE-Plg, indicating that GPE could produce a good inhibitory effect against S. aureus at a lower concentration. With the increase of mE/mPlg, the inhibition zone diameter produced by GPE/GSE-Plg also increased. In Fig. 9b, when mE/mPlg increased from 5:1 to 10:1, the growth rate of the inhibition zone diameter was substantially smaller than before, and the size of the inhibition zone diameter was close to that for the pure extract. Overall, pure palygorskite did not demonstrate obvious antimicrobial performance against S. aureus. However, GPE/GSE-Plg still maintained strong antimicrobial performance, with its main antibacterial components derived from the active substances in GPE/GSE. S. aureus was selected as a representative Gram-positive model to establish a proof-of-concept for the Plg-based delivery system. Moreover, grape-derived polyphenols are reported to exhibit selective antimicrobial activity – potentially inhibiting pathogens while sparing beneficial microbiota. While the current in vitro findings are promising, a possible limitation of this study is that direct cytotoxicity assays and heavy metal analyses were not performed. Further in vivo investigations, alongside comprehensive toxicological and safety evaluations, are required to fully evaluate the broad-spectrum efficacy, cytotoxicity, and microbial safety of these composites within the complex gut environment.
Inhibition zones of GPE and GPE-Plg (top row) and GSE and GSE-Plg (bottom row) against S. aureus. Pure denotes the corresponding extract without Plg. Low, Medium, and High denote extract-Plg composites prepared at extract-to-Plg mass ratios of 1:1, 5:1 and 10:1, respectively. The numbers 1, 2, and 3 indicate three parallel replicates for each extract series. Scale bars: 20 mm.

Figure 8. Long description
A six-panel photo showing antimicrobial susceptibility tests. The top row contains three panels labeled GPE sub 1, GPE sub 2, and GPE sub 3. The bottom row contains three panels labeled GSE sub 1, GSE sub 2, and GSE sub 3. Each panel features a circular agar plate divided by black crosshairs into four quadrants labeled Pure (top-left), Low (top-right), Mid (bottom-right), and High (bottom-left).
In each quadrant, a dark circular well is surrounded by a lighter halo representing the zone of inhibition.
* Top row (G PE): The inhibition zones are large and relatively uniform across all three replicates. The halos around the Pure, Low, Mid, and High wells show significant clearing of the bacterial lawn.
* Bottom row (G SE): The inhibition zones are noticeably smaller than those in the GPE row. The Pure quadrant shows the largest halo, while the Low, Mid, and High quadrants show progressively smaller or less distinct clearing zones compared to the top row.
Each panel includes a 20 mm scale bar in the bottom-right corner for physical dimension reference.
(a) Inhibition zone diameter of grape pip extract (GPE) group and grape skin extract (GSE) group, and (b) change curves of antibacterial zone diameter of composites with different mE/MPlg values.

Figure 9. Long description
Panel a is a bar chart. The y-axis is Diameter in millimeters from 0 to 12. The x-axis categories are Pure Plg, L-GPE forward slash GSE-Plg, M-GPE forward slash GSE-Plg, H-GPE forward slash GSE-Plg, and Pure GPE forward slash G S E. A bracket labels the middle three categories as Composite m sub E all over M sub Plg. Orange bars represent the GPE group and blue bars represent the GSE group. Pure Plg shows zero inhibition. For all other categories, GPE bars are significantly higher than GSE bars, peaking at approximately 11.5 millimeters for Pure GP E.
Panel b is a line graph with the same y-axis. The x-axis is m sub E all over M sub P l g from 0 to 10. The orange GPE line shows a sharp logarithmic increase from 0 to 1, reaching nearly 10 millimeters, then plateaus between 5 and 10. The blue GSE line follows a similar trend but at a lower magnitude, plateauing at approximately 5 millimeters. Both lines include vertical error bars at each data point.
Some researchers have used metal ions or plant essential oils to combine palygorskite into composite materials. These materials have certain antibacterial properties against S. aureus. Han et al. (Reference Han, Zhang, Kang, Li, Zhang, Dong and Qin2016) used an ultraviolet irradiation technique to prepare Ag-Plg nanocomposite, the inhibition zone diameter of which was 9.2 mm for S. aureus. Tenci et al. (Reference Tenci, Rossi, Aguzzi, Carazo, Sandri, Bonferoni and Ferrari2017), Zhong et al. (Reference Zhong, Mu, Zhang, Hui, Kang and Wang2020), and Lei et al. (Reference Lei, Wei, Wang, Su, Xue, Liu and Hu2017) used an adsorption process and shear mixing, a mechanical milling method and an ion exchange process, respectively, to prepare CAR-Plg (Carvacrol-palygorskite) composites. The MIC (minimum inhibitory concentration) values of these three materials against S. aureus were 0.26 mg mL–1, 2.0 mg mL–1, and 6.25 mg mL–1, respectively. In the present study, mechanical grinding was selected as the preparation method for the Plg-based antibacterial composites because it is a relatively simple and mild physical process that requires little or no solvent and minimizes waste generation. Moreover, this solvent-free approach can reduce the potential introduction of residual toxic chemicals into the antibacterial composites.
Practical applicability and economic feasibility
In addition to its functional properties, the practical application of the GPE/GSE-Plg composite in the poultry industry depends on its economic and technical feasibility. The estimated inclusion level in animal feed is 0.5–2.0 g kg–1, which aligns with the standard dosage of commercial phytogenic additives. From an economic perspective, the combination of grape extracts – derived from high-value utilization of winery by-products – with low-cost natural palygorskite offers a significant cost advantage over synthetic alternatives. Moreover, the solvent-free mechanical grinding method used for synthesis is inherently scalable, energy-efficient, and readily integrable into industrial production lines. Collectively, these advantages, together with the composite’s sustained-release characteristics, highlight its potential as a cost-effective and sustainable candidate for antibiotic-free livestock farming.
Conclusions
In this study, a green antibacterial material was prepared by combining natural GPE/GSE extracts with palygorskite using a simple grinding process. The mechanical force facilitated the interaction between the oxygen-containing groups of GPE/GSE antibacterial components and Si-OH and Mg-OH2 groups through possible hydrogen bonds, resulting in the loading of GPE/GSE antibacterial components onto the surface and into the pore channels of palygorskite. Palygorskite serves as an excellent carrier for the volatile GPE/GSE, enhancing the thermal stability of the material. The release behavior of GPE/GSE and GPE/GSE-Plg conforms to a pseudo-second order kinetic model. The desorption rate constant (k2) of GSE-Plg in ultrapure water is 1.7×10⁻⁴ g mg–1 min–1, which is only one-sixth of GSE, and in an acid solution (pH = 4), it is 6.93×10⁻⁵ g mg–1 min–1, one third of of that GSE. These findings demonstrate that hybridization with palygorskite effectively sustains the release of GSE in both aqueous media and a simulated piglet gastric fluid environment. Pristine palygorskite exhibited negligible antimicrobial activity against S. aureus. Conversely, both pure GPE and GSE demonstrated distinct antimicrobial effectiveness against S. aureus, yielding inhibition zones of 11.5 mm and 6.5 mm, respectively. The antibacterial potency of GPE-Plg surpassed that of GSE-Plg, maintaining minimum inhibitory efficacy even at lower concentrations. The combination of natural antibacterial components with inorganic nanomaterials to create a novel antibacterial material shows promise as a potential alternative to antibiotic additives in animal feed.
Supplementary material
The supplementary material for this article can be found at http://doi.org/10.1017/cmn.2026.10045.
Data availability statement
The data that support the findings of this study are available from the corresponding author upon reasonable request.
Acknowledgments
None.
Author contributions
B.W.: Conceptualization, Methodology, Investigation, Data curation, Writing – original draft, Writing – review and editing, Visualization; S.Z.: Conceptualization, Methodology, Data curation, Writing – original draft, Writing – review and editing, Visualization; Y.S.: Methodology, Data curation;Y.H.: Methodology, Investigation, Data curation; Y.L.: Methodology, Resources, Formal analysis; Y.B.: Methodology, Investigation; J.J.: Conceptualization, Resources, Funding acquisition, Writing – review and editing, Supervision; J.H.: Conceptualization, Methodology, Formal analysis, Data curation, Resources, Writing – original draft, Writing – review and editing, Visualization, Supervision, Project administration.
Financial support
This work was supported by the Foundation of Key Laboratory for Palygorskite Science and Applied Technology of Jiangsu Province (HPK202101).
Competing interests
The authors declare none.