Introduction
Volatile organic pollutants (VOCs) are organic gases with high vapor pressure and low water solubility, which are increasingly harmful to human life as an atmospheric pollutant [Reference Chen, Li, Wang and Gong1]. If the human body is exposed to VOC-rich environments, it will have immeasurable consequences, which will cause a variety of diseases including lung, respiratory, and cardiovascular diseases, even leukemia, cancer, and other terminal illnesses [Reference Colman Lerner, Sanchez, Sambeth and Porta2, Reference Huang, Brook, Crippa, Janssens-Maenhout, Schieberle, Dore, Guizzardi, Muntean, Schaaf and Friedrich3]. To protect human safety, the effective control and degradation of VOCs have attracted considerable attention [Reference Yang, Miao, Pi, Xia, Wu, Li and Xiao4–Reference Wang, Wang, Han, Tang, Zhong, Huang and Chen8], so that more and more researchers are committed to the detection, control, degradation, and emission of VOCs. At present, the effective degradation of VOCs is mainly concentrated in catalytic combustion, which can be divided into three categories: (i) noble metal catalysts; (ii) non-noble metal catalysts; and (iii) mixed-metal catalysts [Reference Kamal, Razzak and Hossain9]. Among them, the perovskite phase catalyst has gained growing favor due to its higher lattice oxygen and better low-temperature combustion performance [Reference Tomatis, Xu, He and Zhang10]. However, with the development of science and technology, the concepts of “green chemistry” and “low carbon chemistry” have become increasingly popular, and thus, the combination of catalytic combustion and photocatalytic decomposition with better catalytic degradation comes into being [Reference Liu, Li, Yang, Mao, Zeng, Lan, Yun and Zhao11]. Because under the irradiation of light, the catalyst could efficiently promote synergetic photothermal effect, resulting in more electron excitation and relaxation, intensified heat emission, and then enhanced photothermocatalytic activity [Reference Zeng, Li, Mao, Bai, Ren and Zhao12]. In recent years, the research on photothermal synergistic degradation of VOCs has been very extensive. Among them, Chen [Reference Chen, He, Li, An, Shi and Li13] et al. found that La-based perovskites (LaMnO3) had excellent application prospects in the field of photothermal synergistic degradation of styrene on account of its small lattice size, narrow band gap, and high visible light absorption capacity. Li [Reference Li, Yu, Cai, Chen, Chen, Jia and Xu14] et al. obtained a toluene conversion of 89% and a CO2 yield of 87% by long-wave infrared (IR) irradiation using CeO2/LaMnO3 as a catalyst. These studies all prove that perovskites not only have a wide range of applications in solar cells [Reference Li, Yang, Que, Wang, Wang, Wu and Li15, Reference Chen and Yang16], photovoltaic device [Reference Ahmed, Harris, Shaffer, Devgun, Chowdhury, Abdulllah and Banerjee17], semiconductor films [Reference Pearson18], and thermoelectric materials [Reference Niu, Milam-Guerrero, Zhou, Ye, Zhao, Melot and Ravichandran19], but also have great potential for photothermal synergistic degradation of VOCs.
Single perovskite is usually described as ABO3 and A2BO4, and their A sites are usually rare earth elements (La, Pr, Sm) or alkaline earth elements (Sr, Ba) surrounded by 12 oxyanions ions [Reference Maiti, Saxena and Roy20]. The B sites are usually small transition metal elements (Fe, Cu, Ni, Co, or Mn) and located in the oxygen framework [Reference Zhang, Tan, Meng, Weng and Wu21]. At the same time, the single perovskite can be further synthesized to form a double perovskite, which can be simply represented by A1A2B1B2O6 [Reference Steward and Rooksby22]. They have a similar elemental composition, and transition elements B1 and B2 exhibit a rock-salt structure at the sublattice of the B site [Reference Anderson, Greenwood, Taylor and Poeppelmeier23]. The double perovskite possesses many unique surface characteristics. The B site of B1O6 and B2O6 alternates in three-dimensional order, and they share octahedrons along the three directions of the lattice [Reference Li, Wang, Xu, Liu, He and Chen24]. Because of this particular structure, double perovskites have more variation than a single perovskite, and this change often promotes the catalytic activity [Reference Pan, Pan, Chong and Chang25]. Tasca [Reference Tasca, Lavat and González26] et al. found that the double-perovskite La2MMnO6 (M = Co, Ni, Cu) exhibited higher reactivity and lower reaction temperature in the catalytic combustion of propane. This may be due to the fact that the different elements of the B site in the double perovskite affect the degree of binding of M4+–O–Mn2+ in the perovskite crystal lattice [Reference Liu, Wang, Chen, Cao, He and Fan27], thereby affecting the active oxygen content of the catalyst, resulting in a change in reactivity. Hu [Reference Hu, Li, Wang, Sun, Jia, Su and Zhang28] et al. obtained the double-perovskite La2FeTiO6 by incorporation of Ti at the B site of LaFeO3 and applied it to visible light catalytic decomposition of p-chlorophenol. It was found that the prepared double-perovskite La2FeTiO6 exhibited higher decomposition ability within visible light than the single perovskite LaFeO3. This may be due to the larger specific surface area of the double-perovskite La2FeTiO6, the smaller particle size, and the high oxygen vacancy concentration caused by the unique low magnetization of the double perovskite.
In view of the above analysis, in this work, La, Pr, and Sm are selected as A sites, and Mn and Ni as B sites of double perovskite for the sake of improving the ability of photothermal synergistic degradation of VOCs. A series of double-perovskite catalyst LaAMnNiO6 (A = La, Pr, Sm) was prepared by a typical sol–gel method, which was applied to photothermal synergistic degradation of gaseous toluene. Meanwhile, the research of reaction kinetics of the catalyst demonstrated that LaAMnNiO6 (A = La, Pr, Sm) had lower activation energy and thus possessed better catalytic activity. Through a group of characterizations, the active oxygen content, element valence state, and specific surface area of the catalyst were explored so as to clarify the reaction mechanism.
Results and discussion
Characterization
XRD analysis
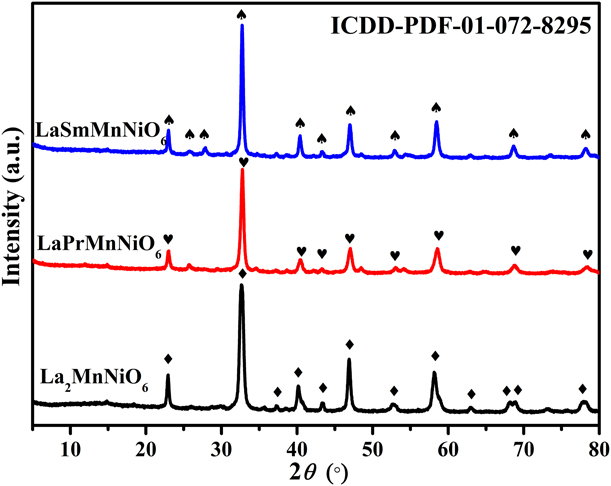
Figure 1 is an X-ray diffraction (XRD) pattern of the as-prepared LaAMnNiO6 (A = La, Pr, Sm). As can be seen from the Fig. 1, the double-perovskite catalyst prepared by sol–gel method has a good crystal structure and strong peak. The La2MnNiO6 catalyst calcined at 700 °C is identical to that in the literature and exhibits a single-phase monoclinic structure (P21/n) [Reference Pan, Pan, Chong and Chang25, Reference Zhao, Shi, Zhou, Zhao, Yang, Guo, Zhao, Shi, Zhou, Zhao, Yang and Guo29], which can also be identified by standard powder diffraction documents (ICDD-PDF-01-072-8295) [Reference Gaikwad, Yadav, Lofland, Ramanujachary, Chakravertya, Ganguli and Jha30]. The peaks at 22.9°, 32.7°, 37.3°, 40.2°, 43.3°, 46.9°, 52.7°, 58.3°, 62.8°, 68.0°, 69.0°, and 78.1° correspond to (110), (112), (211), (022), (202), (220), (114), (312), (204), (224), (400), and (420) of La2MnNiO6 crystal planes, respectively. Likewise, the LaPrMnNiO6 and LaSmMnNiO6 catalysts show the same peak shape as the La2MnNiO6 catalyst, and the peak position does not change as well. This indicates that the LaPrMnNiO6 and LaSmMnNiO6 catalyst are well prepared and exhibit a single-phase structure [Reference Touahra, Rabahi, Chebout, Boudjemaa, Lerari, Sehailia and Bachari31].
XRD patterns of LaAMnNiO6 (A = La, Pr, Sm).

TEM analysis
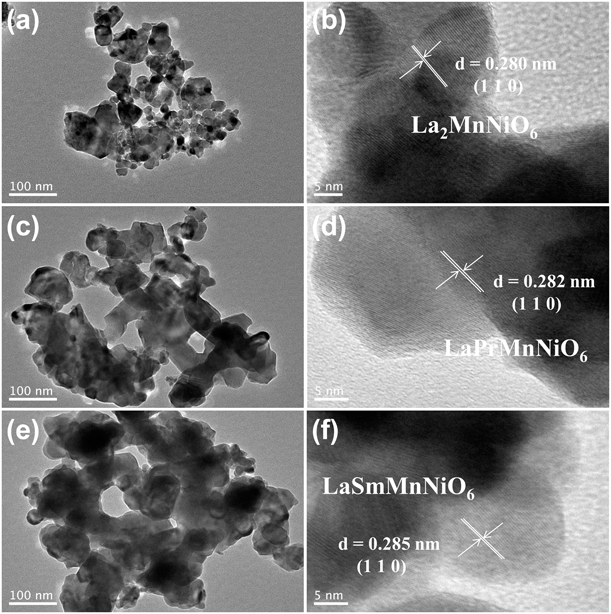
Figure 2 shows transmission electron microscopy (TEM) images and HRTEM images of LaAMnNiO6 (A = La, Pr, Sm). Among them, Figs. 2(a), 2(c), and 2(e) show TEM images of the as-prepared La2MnNiO6, LaPrMnNiO6, and LaSmMnNiO6 catalysts, respectively. It can be seen that the as-prepared LaAMnNiO6 (A = La, Pr, Sm) catalysts exhibit amorphous particles within size of 10–35 nm, and the particles are stacked on each other to form a porous polymer with a pore diameter of 10–50 nm. It may be that the citric acid (CA) molecule contains a number of carboxyl groups and the backbone of the CA molecule is not sufficiently close. When CA acts as a complexing agent to complex metal ions in the ethanol system, these metal groups form a “territory” of the respective reactions in solution [Reference Liu, Jiang, Gao, Du and Lu32]. Then, under calcination conditions, the nucleation of the double perovskite is limited in these territories, forming a wide variety of small particles. And as the complexing agent is carbonized and burned, the area occupied by the complexing agent is retained to form pores, and these mesoporous channels can provide a larger specific surface area, further enhancing the reactivity. Figures 2(b), 2(d), and 2(f) are HRTEM images of the prepared La2MnNiO6, LaPrMnNiO6, and LaSmMnNiO6. As can be seen, the lattice structure of as-prepared double-perovskite catalysts is clearly visible, and the lattice spacing of 0.280 nm in Fig. 2(c) belongs to the (110) crystal plane of La2MnNiO6. The lattice spacing of the (110) crystal plane of LaPrMnNiO6 in Fig. 2(d) and the one of LaSmMnNiO6 in Fig. 2(e) are 0.282 nm and 0.285 nm, respectively. This may be due to the gradual increase in the ionic radius of La, Pr, and Sm. The introduction of the A site of Pr and Sm leads to the lattice expansion and deformation of the double-perovskite crystal, further demonstrating the successful preparation of the double-perovskite catalysts [Reference Li, Yin, Yao, Zuo, Lu, Luo and Ni33].
TEM images of (a) La2MnNiO6, (c) LaPrMnNiO6, and (e) LaSmMnNiO6; HRTEM images of (b) La2MnNiO6, (d) LaPrMnNiO6, and (f) LaSmMnNiO6.

UV-vis analysis
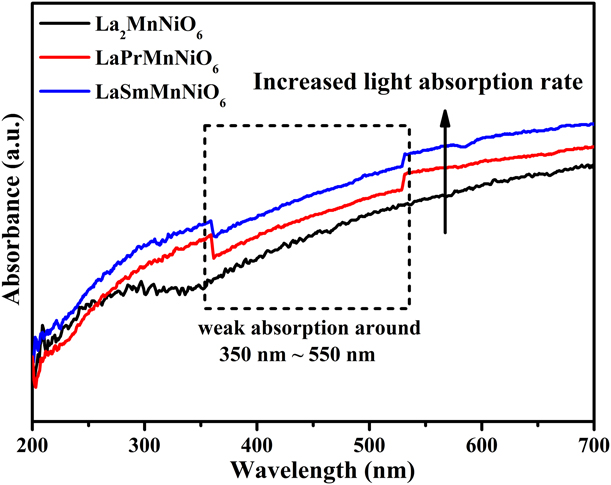
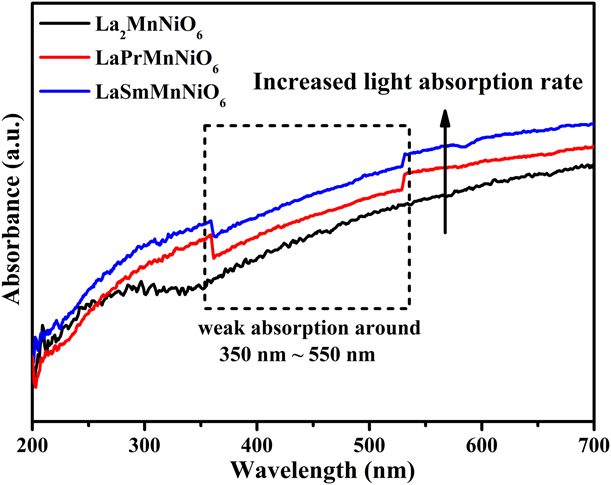
Figure 3 displays UV-vis spectra of the prepared LaAMnNiO6 (A = La, Pr, Sm). Conventional semiconductor photocatalysts have strong absorption only in the ultraviolet region, while LaAMnNiO6 (A = La, Pr, Sm) exhibits strong light absorption over the entire spectral range of 200–700 nm, indicating that LaAMnNiO6 (A = La, Pr, Sm) avoids the narrow absorption region of ordinary semiconductor photocatalyst and the low photon absorption caused by narrow band gap. They can achieve effective absorption in the whole spectrum and have efficient photocatalysis [Reference Mao, Li, Hou, Zeng and Zhao34].
UV-vis spectra of LaAMnNiO6 (A = La, Pr, Sm).
XPS analysis
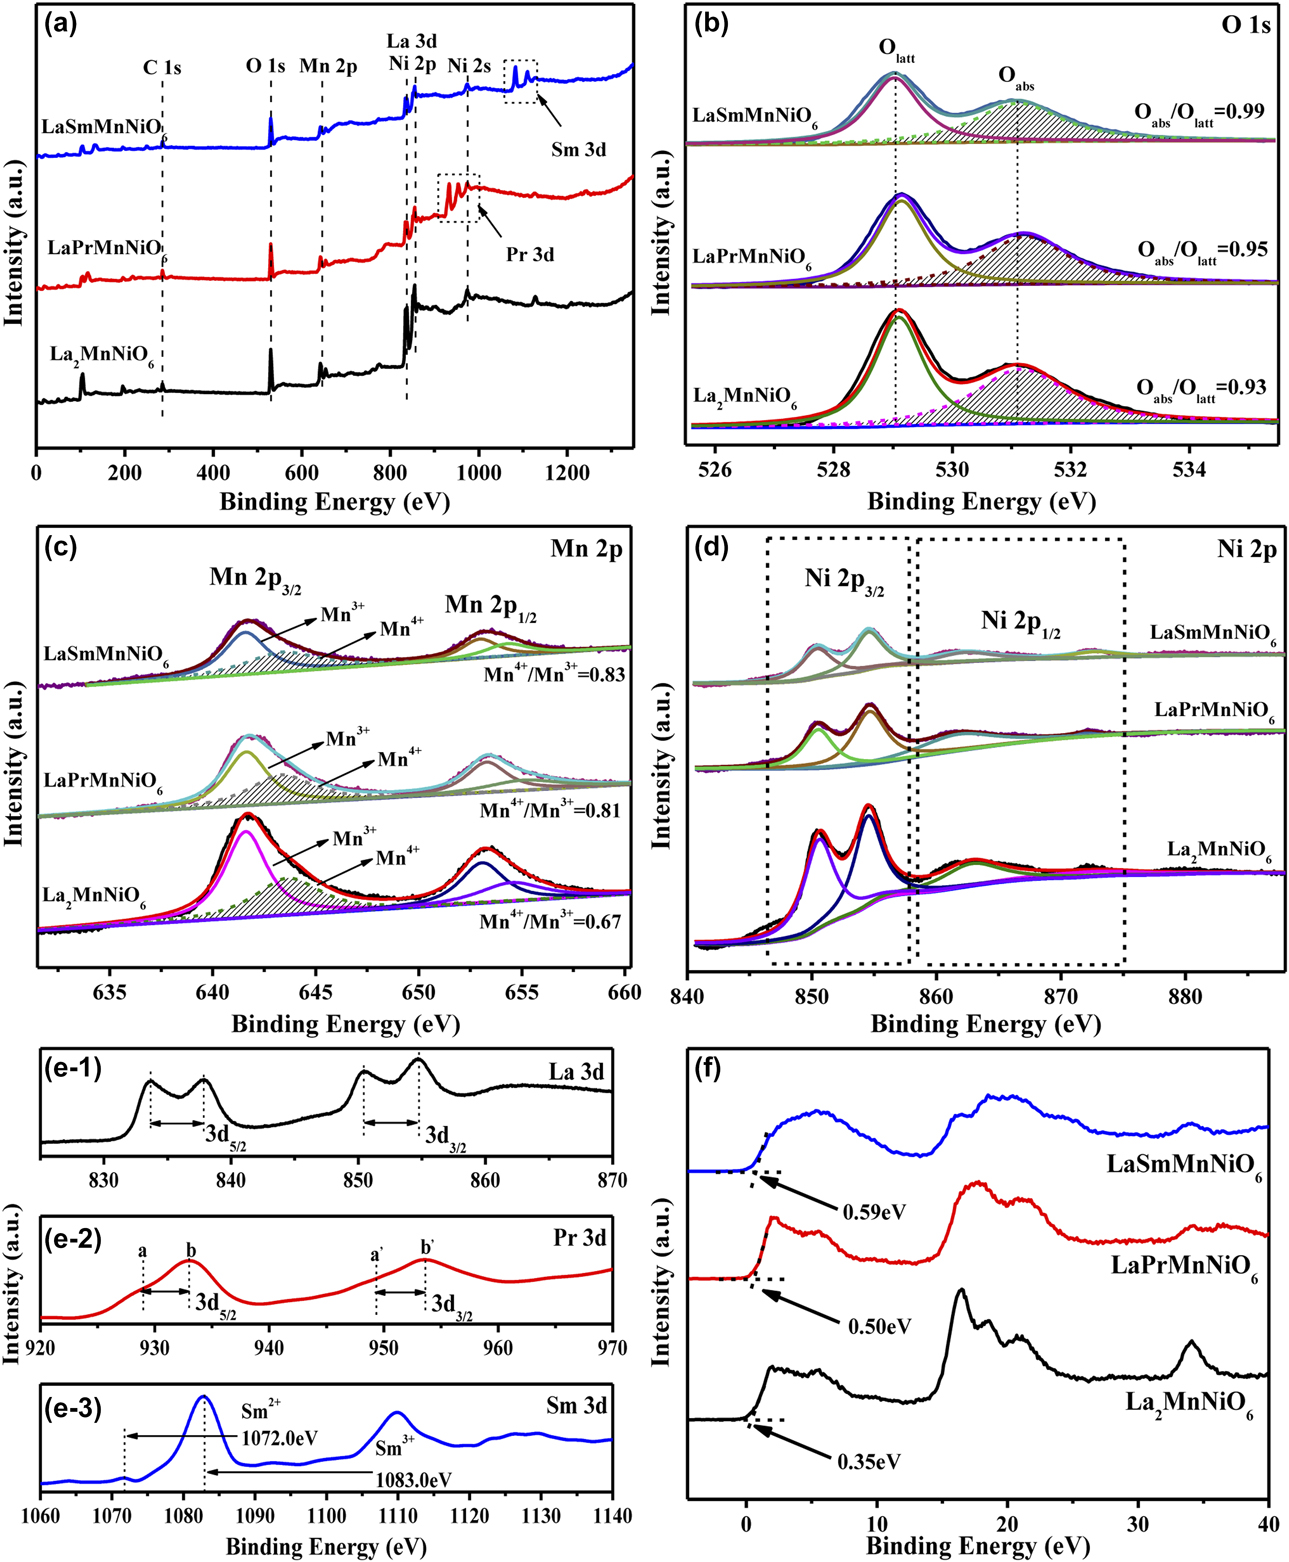
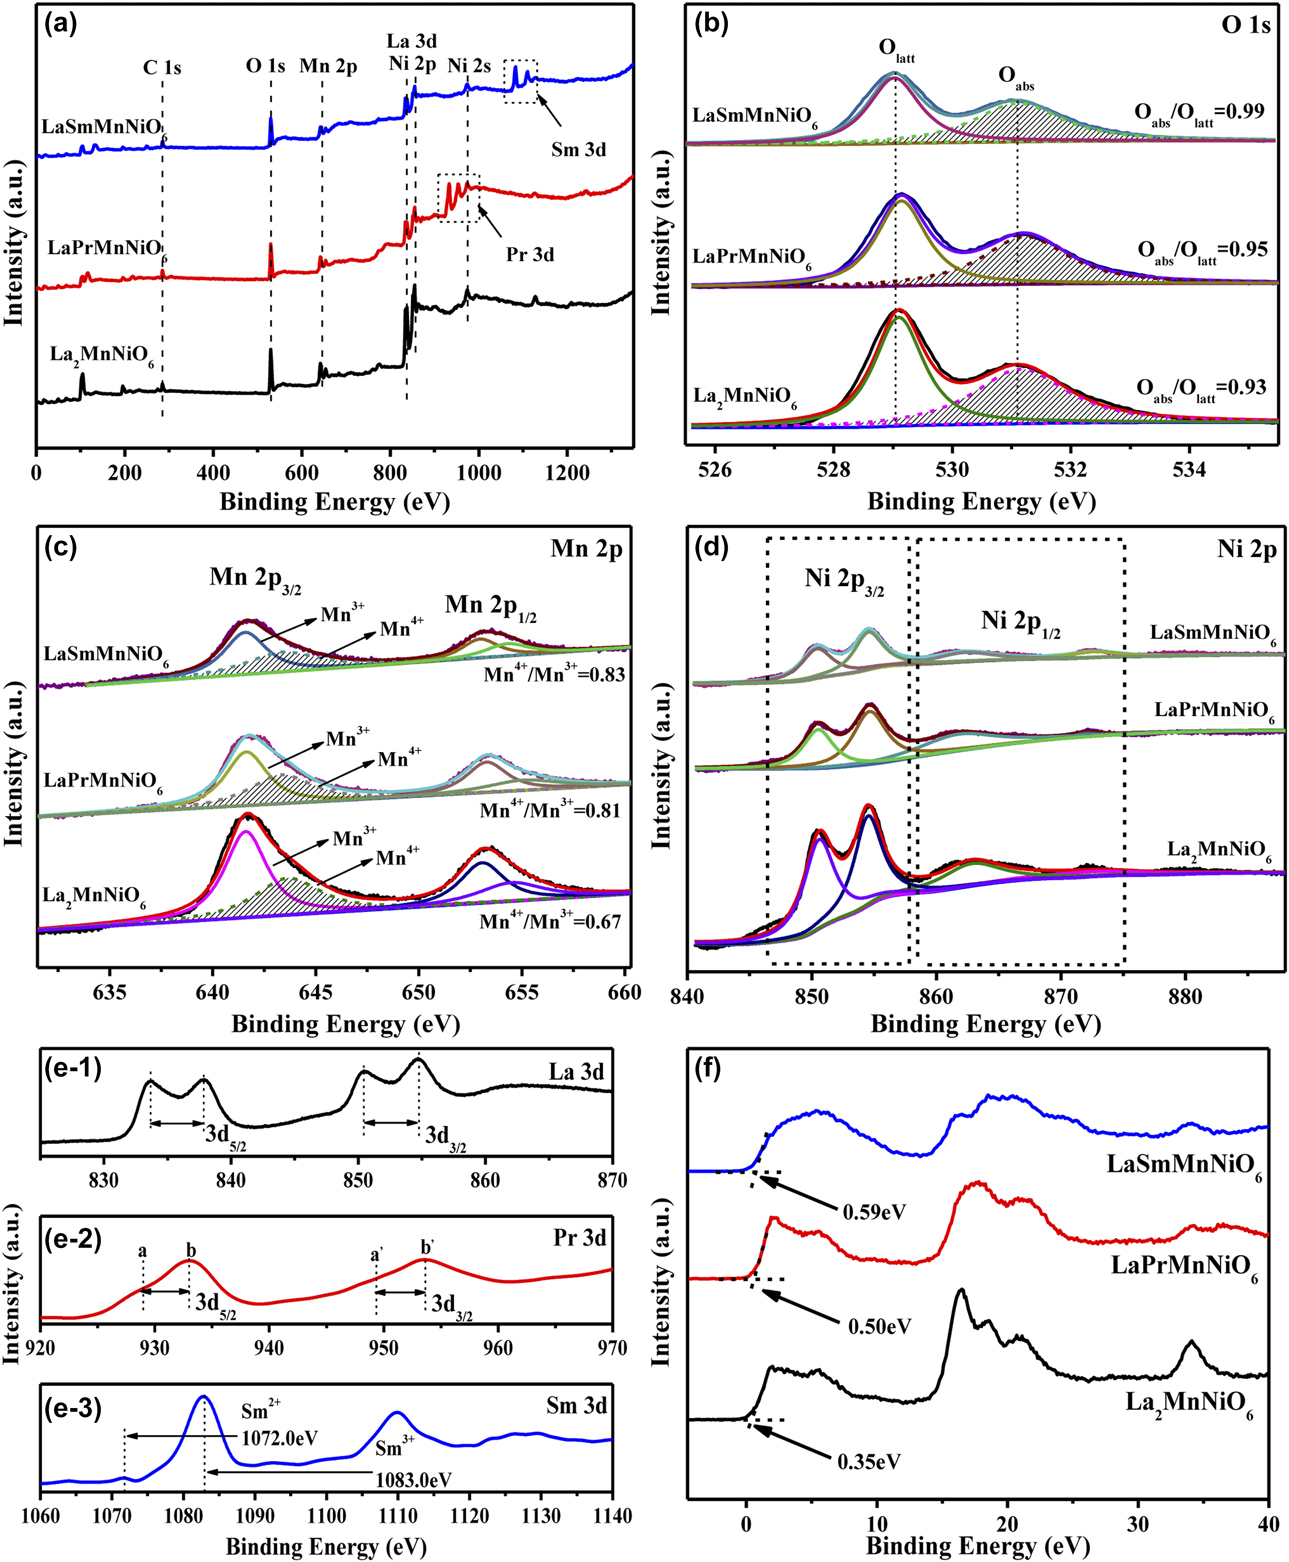
Figure 4 displays the representative X-ray photoelectron spectroscopy (XPS) spectra of the prepared LaAMnNiO6 (A = La, Pr, Sm). Figure 4(a) is the XPS survey spectra of LaAMnNiO6 (A = La, Pr, Sm), and the elemental composition of the prepared catalysts can be visually observed. Among them, the peak positions of La and Ni are not sufficiently distinguished because of their overlapping energy band. However, the relative concentration of atoms in the catalyst listed in Table SI can help to prove the presence of La and Ni in the respective components. Because the content of the O element plays a crucial role in the catalytic oxidation performance, the analysis of the O 1s needs to be prioritized and the result is presented in Fig. 4(b), in which a sub-band of about 529.8 eV is attributed to the lattice oxygen (Olatt), and a sub-band of about 531.1 eV is ascribed to the adsorbed oxygen (Oabs) [Reference Han, Meeprasert, Maitarad, Nammuangruk, Shi and Zhang35, Reference Pan, Shen, Jin and Zhu36]. It can be seen from Oabs/Olatt in Table SI that the adsorbed oxygen is sequentially arranged in the order of LaSmMnNiO6 > LaPrMnNiO6 > La2MnNiO6, implying that the addition of rare earth elements at the A site can significantly increase the adsorbed oxygen content of the catalyst. In addition, since the Mn4+ has higher redox ability than Mn3+, the content of Mn4+ is also an important factor. In Fig. 4(c), the two sets of peaks at 643.1 and 653.1 eV are assigned to Mn 2p 3/2 and Mn 2p 1/2. Then, the peak at Mn 2p 3/2 can be further divided into two groups of peaks appearing at 641.7 and 643.1 eV. They are attributed to Mn3+ and Mn4+, respectively [Reference Xie, Tang, Huang, Jin, Gu, Luo, Yao and Li37, Reference Tang, Tao, Wu, Xu, Huang, Zhou, Xie, Luo, Yao and Li38]. It can be found from Mn4+/Mn3+ in Table SI that the arrangement of Mn4+/Mn3+ is consistent with the order of Oabs/Olatt, and these findings are consistent with the reported literature. Among them, Zhang [Reference Zhang, Wang, Zhan, Guo, Guo, Lu, Baylet and Giroir-Fendler39] et al. found that LaB0.2Mn0.8O3 (B = Co, Ni, Fe) was used in the catalytic oxidation of vinyl chloride. The LaNi0.2Mn0.8O3 catalyst showed higher activity in the performance test due to its higher adsorption oxygen content and higher Mn4+ content. These are because in the catalytic degradation of VOCs dominated by the Mars–van Krevelen redox cycle mechanism, the higher adsorption oxygen facilitates the timely replenishment of the lattice oxygen consumed by catalytic oxidation. And the higher redox performance is beneficial to the reduction and recovery of the catalyst itself, which plays a crucial role in the catalytic degradation of VOCs. Figure 4(d) is the XPS spectrum of Ni 2p in the catalyst. Due to the overlapping band of La 3d and Ni 2p, the distribution of Ni 2p in LaAMnNiO6 (A = La, Pr, Sm) becomes complicated. This overlapping causes the Ni element cannot to be accurately measured and also mask the intensity of its peak [Reference Álvarez-Galván, de la Peña O’Shea, Arzamend, Pawelec, Gandía and Fierro40]. After several accurate measurements and comparisons, the Ni 2p 3/2 binding at 855.5 eV reveals the presence of ionic nickel [Reference Zhao, Wang, Wu, Fang, Liang, Fan and Li41]. However, owing to the close similarity between the energy bands of Ni2+ and Ni3+, the elemental valence of Ni cannot be accurately confirmed by XPS only. According to the literature, the Ni element in perovskite is generally present in the form of Ni2+ in the cell [Reference Álvarez-Galván, de la Peña O’Shea, Arzamend, Pawelec, Gandía and Fierro40]. Figure 4(e) is a 3d orbital of rare earth elements (La, Pr, and Sm) [Reference Li, Shi, Zhu, Zuo, Lu, Luo, Li, Yao and Chen42, Reference Guo, Yang, Chen, Chu, Zhang and Rao43, Reference Brunckova, Kanuchova, Kolev, Mudra and Medvecky44]. These orbits clearly represent the presence of rare earth elements in the as-prepared catalyst, which is consistent with the results in Table SI. Figure 4(f) is a valence band XPS (VB-XPS) spectrum of LaAMnNiO6 (A = La, Pr, Sm). It can be seen that LaSmMnNiO6 has a lower valence band, which is beneficial to the energy transition of the catalyst after absorbing photons and so it has higher catalytic ability [Reference Wang, Li, Qian, Zuo, Yan, Chen and Yao45]. Furthermore, the VB XPS analysis verifies the down-shift of the VB maximum from 0.59 to 0.35 eV, which indicates LaSmMnNiO6 has created more defect states and can cause higher charge separation; these all improve the degradation ability of the catalyst [Reference Li, Yu, Jaroniec and Chen46].
XPS patterns of LaAMnNiO6 (A = La, Pr, Sm): (a) survey spectra, (b) O 1s, (c) Mn 2p, (d) Ni 2p, (e) La 3d, Pr 3d, and Sm 3d, (f) Valence bands of LaAMnNiO6 (A = La, Pr, Sm).
O2-TPD analysis
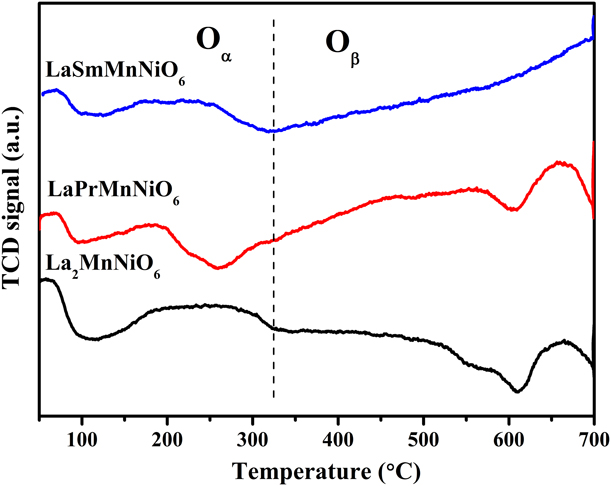
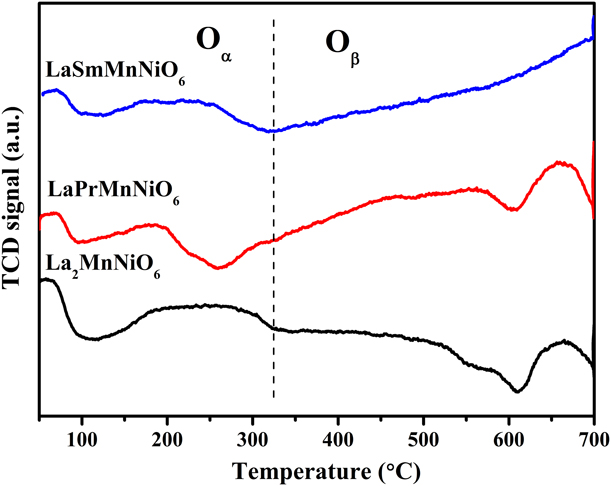
To investigate the surface and bulk oxygen species of the perovskite samples, the oxygen desorption profiles within the temperature range of 50–700 °C are depicted in Fig. 5. LaAMnNiO6 (A = La, Pr, Sm) has two oxygen desorption peaks at 50–315 °C and 315–700 °C, respectively. The oxygen desorption peak in the low-temperature region can be ascribed to physical adsorption of the weakest molecular or chemical adsorption of free oxygen (Oα) on the catalyst surface [Reference Liu, Dai, Du, Deng, Zhang, Zhao and Au47]. The desorption peak in the high-temperature region is ascribed to the oxygen (Oβ) originating from the oxygen vacancies on the surface or in the subsurface, which is used as a medium for exchange and conversion between free oxygen on the surface and lattice oxygen in the crystal structure [Reference Ziaei-Azad, Khodadadi, Esmaeilnejad-Ahranjani and Mortazavi48]. In photothermal synergistic degradation of VOC, lattice oxygen (•O2−) with strong oxidative properties acts as the main reactive oxygen species for catalytic degradation of VOC, mainly from oxygen vacancies on the surface or in the subsurface, which is excited by light and heat to produce [Reference Li, Xie, Jiang, Yu and Zhang49]. Therefore, the amount of oxygen vacancies can reflect the oxygen vacancies on the catalyst surface or subsurface. Table SII is the volume of oxygen consumed per unit mass of the prepared LaAMnNiO6 (A = La, Pr, Sm). As can be seen from that the catalyst is ranked based on Oβ such as LaSmMnNiO6 > LaPrMnNiO6 > La2MnNiO6. The results show that LaSmMnNiO6 has more oxygen vacancies, which can convert free oxygen into lattice oxygen more quickly during the reaction, thus supplementing the lattice oxygen consumed by the experiment to achieve better reaction ability [Reference Lu, Dai and Wang50].
O2-TPD profiles of LaAMnNiO6 (A = La, Pr, Sm).
H2-TPR analysis
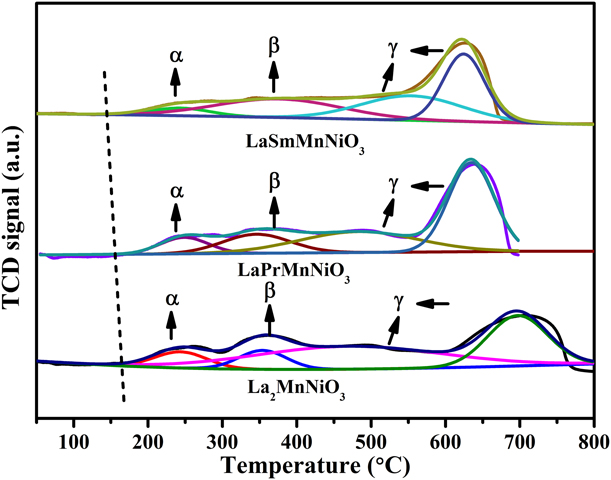
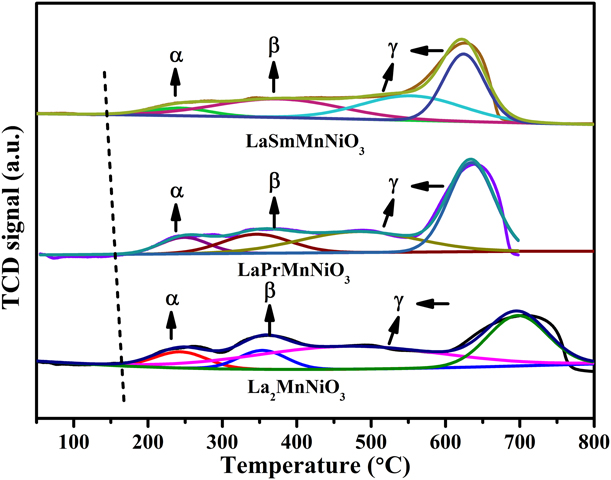
To investigate the redox ability of LaAMnNiO6 (A = La, Pr, Sm), the catalyst was characterized by H2-TPR. It can be seen from Fig. 6 that the catalysts have a broad peak in the range of 50–700 °C. Since the La-based species cannot react in the experimental environment of H2-TPR, the consumption of H2 is derived from the reduction of the Mn and Ni species. The peak around 700 °C is classified as the reduction of Mn3+ to Mn2+ and the reduction of Ni2+ to Ni0+. At this temperature, the perovskite structure is destroyed and the material is deactivated, so it will not be discussed [Reference Rivas, Hori, Fierro, Goldwasser and Griboval-Constant51]. Summarizing the above analysis, the peaks before 700 °C were convolved and labeled them as (α, β, γ), which represent the three steps of perovskite reduction, respectively. According to the literature, the reduction peak α occurring at 150–350 °C is attributed to the removal of surface oxygen species or nonstoichiometric excess oxygen [Reference Liu, Dai, Deng, Du, Li, Zhao, Wang, Gao, Yang and Guo52]. In Fig. 6, the starting position of the reduction peak of La2MnNiO6 is 173 °C, and for LaPrMnNiO6 and LaSmMnNiO6, the position of the reduction peak α is gradually shifted to 162 and 146 °C, indicating that LaSmMnNiO6 has a lower reaction initiation temperature, which is favorable for the reaction to occur. The second reduction peak β appears at 330–450 °C. This peak is attributed to the reduction of Mn4+ to Mn3+ and the reduction of Ni3+ to Ni2+ [Reference Lu, Dai and Wang50]. At this time, with the reduction of Mn and Ni in the B site, the contents of Mn and Ni in various valence states on the surface are increased, and the contents of Mn3+ and Ni2+ in the prepared catalysts are further increased due to the principle of electrical neutrality. Finally, the single electron reduction of Mn3+ and Ni2+ in the coordination-unsaturated microenvironment occurs at about 550 °C and is denoted as γ [Reference Liu, Dai, Deng, Du, Li, Zhao, Wang, Gao, Yang and Guo52]. The total amount of hydrogen consumed by all samples is summarized in Table SIII by a quantitative analysis of H2-TPR. It can be inferred from Table SII that the number of surface oxygen subspecies is consistent with LaSmMnNiO6 > LaPrMnNiO6 > La2MnNiO6, indicating that LaSmMnNiO6 exposes more oxygen vacancies which can adsorb more free oxygen for reaction and thus enhancing free oxygen in lattice oxygen consumption in supplemental catalyst. The adsorption rate greatly enhances the reaction process of the catalyst. Furthermore, since the metal ions coexist in the form of Mn4+/Mn3+, Ni3+/Ni2+ in the prepared catalyst, and the content of these ions in LaSmMnNiO6 is higher, the redox ability is higher, which is favorable for the occurrence of VOCs catalytic oxidation.
H2-TPR profiles of LaAMnNiO6 (A = La, Pr, Sm).
BET analysis
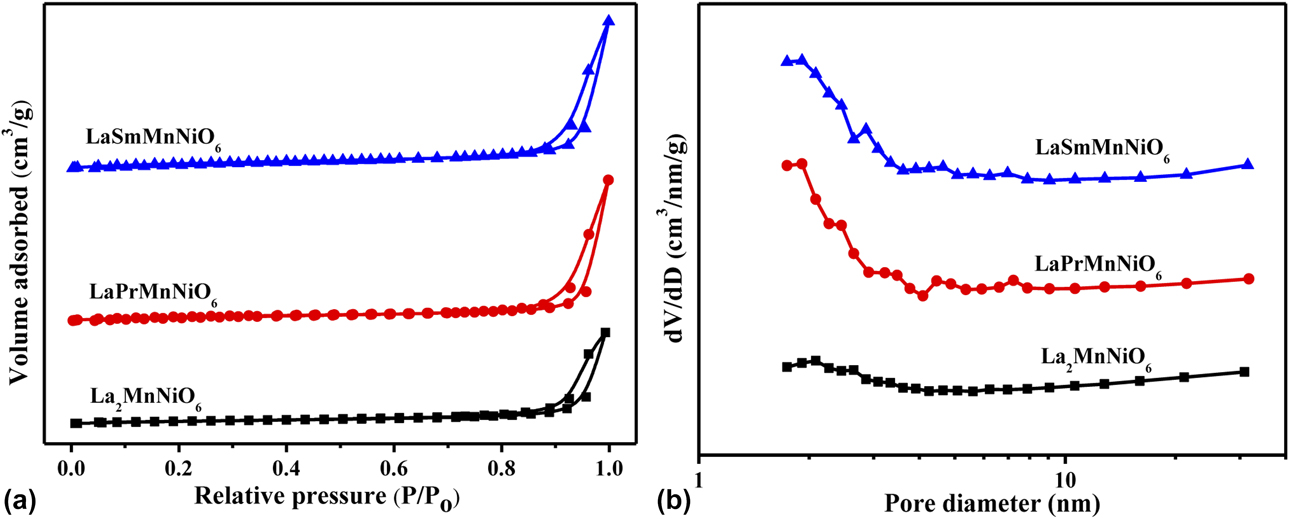
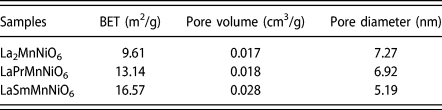
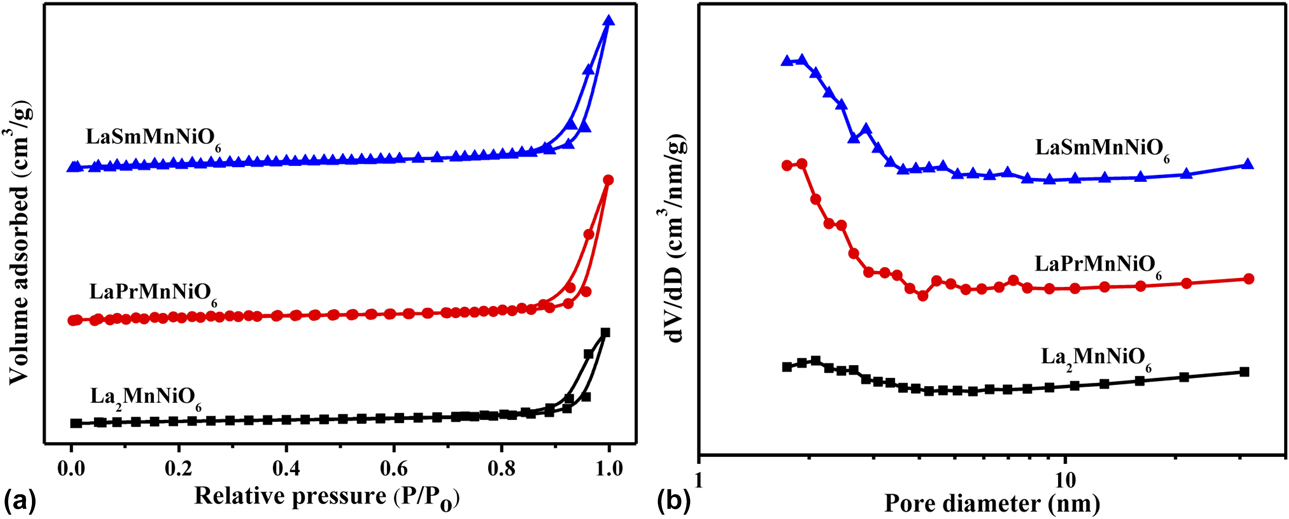
Figure 7 is the adsorption and desorption isotherm of LaAMnNiO6 (A = La, Pr, Sm). Figure 7(a) is the nitrogen adsorption-analytical isotherm of the three catalysts, which all show typical type IV isothermal and H3-type hysteresis loops, proving that LaAMnNiO6 (A = La, Pr, Sm) is of mesoporous structure [Reference Cai, Hu, Li, Shi and Zhang53]. Figure 7(b) presents the pore size distribution of LaAMnNiO6 (A = La, Pr, Sm). It can be observed that the main pore size distribution of the three materials is 2–4 nm. Combined with the pore structure found in TEM, it can be further confirmed that the as-prepared catalysts are mesoporous double perovskites. It is worth noting from Table I that LaSmMnNiO6 has a larger specific surface area, suggesting that LaSmMnNiO6 has more active sites, which is beneficial to the catalytic reaction [Reference Boningari, Ettireddy, Somogyvari and Liu54].
BET curve of LaAMnNiO6 (A = La, Pr, Sm). (a) Nitrogen adsorption–desorption isotherm, (b) pore size distribution of samples.
BET-specific area, pore volume, and pore diameter of LaAMnNiO6 (A = La, Pr, Sm).

Catalytic performance assessment
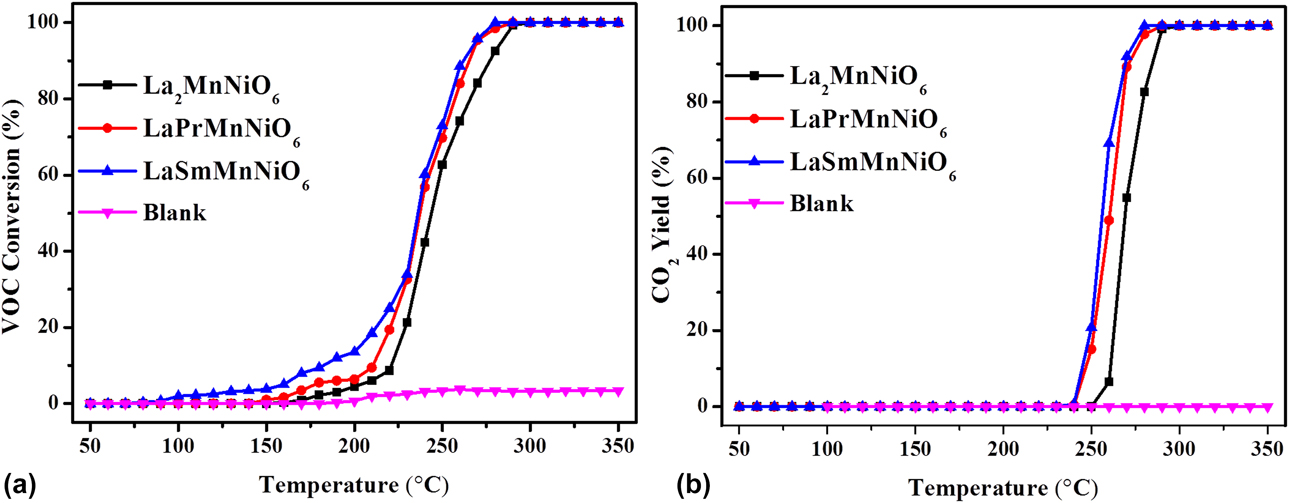
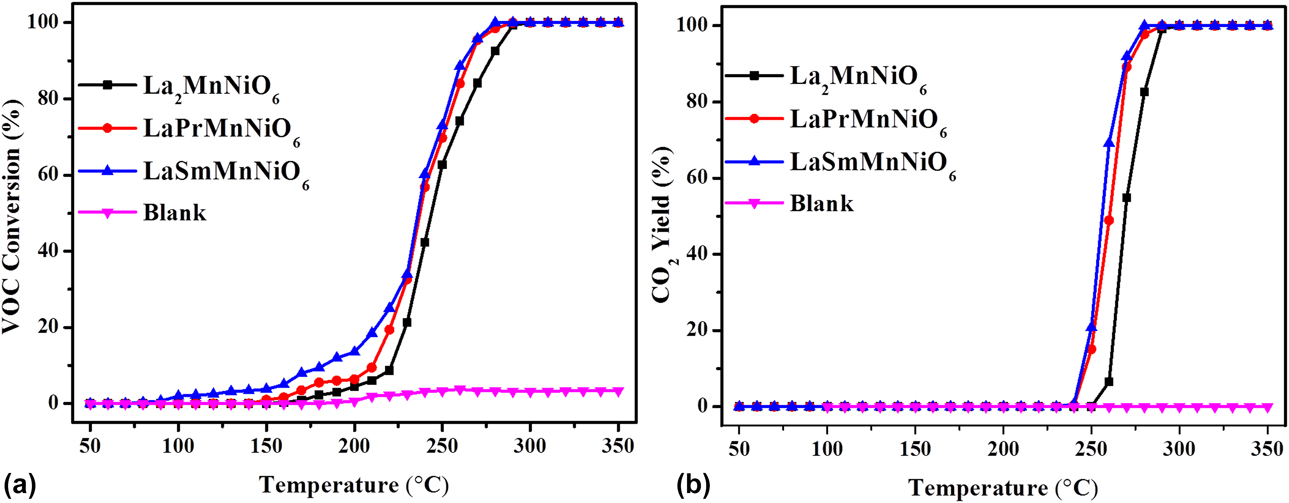
First, the activity of the catalytic oxidation of toluene by LaAMnNiO6 (A = La, Pr, Sm) was evaluated under light conditions, and the blank experiment under the same conditions (use the same volume of quartz sand as a blank) was chosen for comparison. As shown in Fig. 8(a), the catalyst activity for photothermal catalytic degradation of toluene increases with the gradual increase in the reaction temperature and reaches a degradation rate of 90% at 255 °C. This is about 90 °C lower than the need for single-phase perovskite to achieve the same degradation effect at 350 °C (which is shown in Table SIV). Figure 8(b) presents that LaAMnNiO6 (A = La, Pr, Sm) achieves 70% at 260 °C and 100% CO2 yield at 275 °C, respectively. Comparing the two activity maps, it can be visually found that LaSmMnNiO6 has not only a lower reaction initiation temperature and reaction temperature, but also a higher CO2 yield at a lower temperature. Therefore, the double-perovskite LaSmMnNiO6 exhibits its superior VOC removal ability.
(a) VOC conversion; (b) CO2 yield of LaAMnNiO6 (A = La, Pr, Sm).
Catalytic performance kinetics evaluation
The activation energy of LaAMnNiO6 (A = La, Pr, Sm) was further evaluated. According to the literature, the degradation of VOCs via double-perovskite phase catalyst follows the Mars–van Krevelen redox cycle mechanism [Reference Pan, Pan, Chong and Chang25]. Here, the degradation activity at lower temperature was chosen and substituted into the Arrhenius equation to calculate the activation energy (E a). Figure S2 shows that the activation energies of La2MnNiO6, LaPrMnNiO6, and LaSmMnNiO6 catalysts are 129, 75, and 49 kJ/mol, respectively. The results demonstrate that the prepared catalysts have better reaction activation ability than the previously reported catalysts [Reference Li, Hu, Zhang, Meng, Du, Si and Zhang55, Reference Buciuman, Patcas and Menezo56, Reference Giroir-Fendler, Alves-Fortunato, Richard, Wnag, Díaz, Gil, Zhang, Can, Bion and Guo57].
Photothermocatalytic mechanism clarification
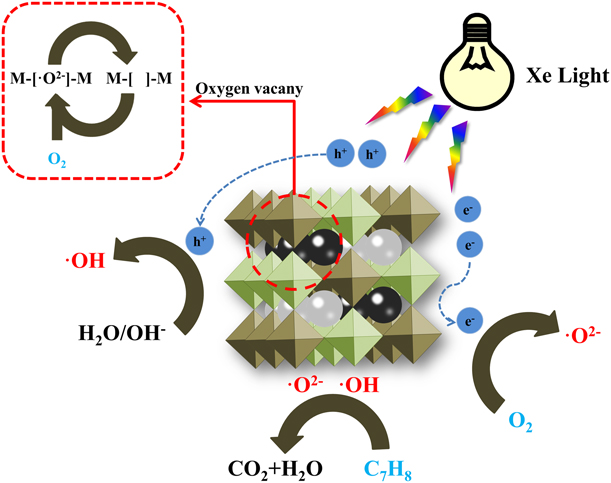
Based on the above conclusions, we simply sketched the possible C7H8 degradation mechanism of LaSmMnNiO6 under photothermal conditions in Fig. 9. As described above, the LaSmMnNiO6 catalyst follows the Mars–van Krevelen redox cycle mechanism. Under light conditions, LaSmMnNiO6 can absorb/transfer light energy and produce a small number of electron–hole (h+/e−) and “hot spots” on its surface, which can accelerate the oxidation of toluene adsorbed on the catalyst surface [Reference Pang, Diao, Wang, Ma, Yu, Zhu, Chen, Hu, Chen and Wang58, Reference Wang, Wang, Yu, Wang, Du and Zhang59]. Although the efficiency of catalytically degrading toluene caused by these small amounts of electron–hole (h+/e−) and “hot spots” is limited, it is important to contribute to the formation of the reactive species (•OH) to oxidize in the catalyst [Reference Xu, Lai, Guo and Da60]. At this time, under thermal conditions, the B-site atom of LaSmMnNiO6 undergoes a strong valence transformation (Mn4+/Mn3+, Ni3+/Ni2+), which activates the lattice vibration of the perovskite and the oxygen vacancies and lattice oxygen contained in the perovskite, resulting in a large amount •O2− with strong oxidizing properties are generated. Some of these •O2− will react with H2O and electron–hole (h+/e−) to produce active material •OH, and some will react with toluene to produce harmless H2O and CO, which greatly promote the deeper catalytic oxidation [Reference Li, Yu, Cai, Chen, Chen, Jia and Xu14, Reference Li, Yu, Low, Fang, Xiao and Chen61]. In addition, the catalyst prepared by ethanol as a solvent has excellent mesoporous morphology and specific surface area. It can convert free oxygen into lattice oxygen more quickly during the reaction, thus supplementing the lattice oxygen consumed by the experiment to achieve better reaction ability.
Possible C7H8 degradation mechanism of LaSmMnNiO6 under photothermal conditions.

Conclusion
In conclusion, the mesoporous double-perovskite catalysts LaAMnNiO6 (A = La, Pr, Sm) prepared by the sol–gel method using ethanol as a solvent have higher oxygen species content and better redox capacity. In terms of catalysis, LaSmMnNiO6 can completely remove toluene at 275 °C and achieve 100% CO2 yield. In addition, kinetic studies indicate that the double-perovskite catalysts have lower activation energy. The as-prepared LaAMnNiO6 (A = La, Pr, Sm) has wide application value in VOC catalytic oxidation.
Experimental
Materials preparation
Lanthanum nitrate [La(NO3)3·xH2O], praseodymium nitrate [Pr(NO3)3·6H2O], samarium nitrate [Sm(NO3)3·6H2O], manganese acetate (C4H6MnO4·4H2O), nickel acetate (C4H6NiO4·4H2O), polyethylene glycol 600 [H(OCH2CH2)nOH], and CA (C6H8O7·H2O) were purchased from Sinopharm Chemical Reagent Co., Ltd. (Shanghai, China). All reagents used in this experiment were of analytical grade, and no further purification was required. Taking La2MnNiO6 as an example, the experimental preparation method is as follows: 0.02 mmol of cerium nitrate, 0.01 mmol of manganese acetate, 0.01 mmol of nickel acetate, 0.04 mmol of CA, and 0.01 mmol of polyethylene glycol 600 are accurately weighed and fully dissolved in 200 mL ethanol. The resulting solution was transferred to a constant temperature water bath of 85 °C to form gel, which was continuously dried to a dry gel. Then, the dry gel was transferred to a muffle furnace at 700 °C for 6 h to obtain pure La2MnNiO6 followed by grinding and sieving (40–80 mesh) for use. The preparation of LaPrMnNiO6 and LaSmMnNiO6 followed the same steps as that of the La2MnNiO6 and only need to change the molar ratio of lanthanum nitrate in the raw material (La:Pr = 1:1, La:Sm = 1:1).
Catalyst characterization
The crystal structure of the catalysts was analyzed by the X-ray diffraction (XRD), which was done using an X-ray diffractometer equipped with a Cu anode (D/Max 2500 PC, Rigaku Corporation, Akishima City, Tokyo, Japan); scanning angle was 2–80°, sweep rate was 3°/min, and Cu Kα (40 kV, 40 mA). The UV-vis diffuse reflectance spectra (DRS) of the photocatalysts were collected with a UV-vis spectrometer (Thermo Nicolet Evolution 500, Thermo Fisher Scientific, Waltham, Massachusetts) which used 100% BaSO4 as a reflectance sample. The surface morphology of the catalysts was observed by the transmission electron microscopy (TEM) (JEM-2100, JEOL, Tokyo, Japan), operating at 200 kV. The surface composition and elemental state of the catalysts were tested by the X-ray photoelectron spectroscopy (XPS), which uses Al Kα radiation (Thermo ESCALAB 250, Thermo Fisher Scientific, Waltham, Massachusetts). The redox capability of the catalysts was detected by temperature-programmed reduction by hydrogen (H2-TPR), which uses an AutoChem II 2920 Chemosorption Instrument (Mike Instruments, Shanghai, China). Approximately 100 mg of the sample was pretreated with high-purity N2 for 30 min at 250 °C and then cooled to 50 °C; after the baseline was leveled, the gas was switched to H2–N2 gas mixture (H2 mole fraction 10%) and the temperature was gradually increased to 800 °C at a heating rate of 10 °C/min, and the desorption signal of the sample was recorded. The oxygen storage capacity of the catalysts was detected by temperature-programmed desorption by oxygen (O2-TPD), which was done using an AutoChem II 2920 Chemosorption Instrument (Mike Instruments, Shanghai, China). Approximately 100 mg of the sample was pretreated with high-purity N2 for 30 min at 250 °C and then cooled to 50 °C; after the baseline was leveled, the gas was switched to O2–N2 gas mixture (O2 mole fraction 10%) and the temperature was gradually increased to 800 °C at a heating rate of 10 °C/min, and the desorption signal of the sample was recorded. The specific surface area and pore structure of the catalysts were recorded by an automatic volumetric apparatus, following standard Brunauer–Emmett–Teller (BET) theory; the pore volume was obtained from the N2 desorption isotherm using Barrett–Joyner–Halenda (BJH) equations (ASAP2010C, Micromeritics manufacturers, Norcross, Georgia).
Catalytic activity measurements
Catalytic reaction was carried out on a photothermal catalytic dual-purpose fixed bed (Hunan Huasi) with a 420 nm cut filter and UV-vis light irradiation using 500 W Xe lamp (CEL-HXF300, Zhongjiao Jinyuan Technology Co., Ltd., Beijing, China). A glass quartz tube with an inner diameter of 15 mm was used as a catalyst reactor, and the glass tube was lined with a quartz sand substrate. Schematic for the VOCs degradation instrument is shown in Fig. S1. In the activity test, about 1 mL of the catalyst was placed in a fixed-bed quartz tube reactor (PFD-5000, Huasi Instrument Co., Ltd., Hunan, China), and a high-precision mass flow meter was used to accurately control the inlet gas flow rate. With N2 as the carrier gas, the gas composition was: [toluene] = 1000 ppm, O2 = 20 vol%, and the gas hourly space velocity (GHSV) was = 18,000 h−1. Before the test, the light was continuously ventilated for 30 min to make the catalyst adsorption saturated, thereby eliminating the concentration drop caused by the adsorption of VOC. During the test, the Xe lamp was turned on and the temperature was programmed, and a photo-ion gas sensor (PID-2000, Baseline, Lyon, Colorado) was used to obtain an accurate inlet VOC concentration, which was recorded as [VOC]in. Then, the temperature was gradually increased and the VOC concentration at the outlet was detected synchronously, which was recorded as [VOC]out. The toluene concentration at the outlet was recorded at intervals of 20 °C, and the IR sensor (AGM31, Sensors Europe GmbH, Hegel-Grenzhausen, Germany) was used to detect the CO2 concentration of the outlet. VOC conversion and CO2 yield are calculated as follows:
 $${\rm{VOC}}\;{\rm{conversion}}\;(\% ) = {{{{\left[ {{\rm{VOC}}} \right]}_{{\rm{in}}}} - {{\left[ {{\rm{VOC}}} \right]}_{{\rm{out}}}}} \over {{{\left[ {{\rm{VOC}}} \right]}_{{\rm{in}}}}}} \times 100\% \quad ,$$
 $${\rm{C}}{{\rm{O}}_2}\;{\rm{yield}} = {{{{\left[ {{\rm{C}}{{\rm{O}}_2}} \right]}_{{\rm{out}}}}} \over {{{\left[ {{\rm{VOC}}} \right]}_{{\rm{out}}}} + {{\left[ {{\rm{C}}{{\rm{O}}_2}} \right]}_{{\rm{out}}}}}} \times 100\% \quad .$$
Supplementary material
To view supplementary material for this article, please visit https://doi.org/10.1557/jmr.2019.273.
Acknowledgments
This work was supported by Social Development Fund of Jiangsu Province (BE2016654).