





Polycystic ovary syndrome (PCOS) is a common endocrine and metabolic disorder characterised by androgen excess, ovulatory dysfunction and polycystic ovarian morphology (PCOM), affecting up to one in five women of reproductive age(Reference Azziz, Carmina and Chen1–Reference Bozdag, Mumusoglu and Zengin3). Although its onset typically occurs in adolescence, the associated metabolic complications often persist throughout life(Reference Helvaci and Yildiz4). PCOS is linked with a broad spectrum of reproductive, metabolic, cardiovascular, oncological and psychological issues, underscoring its substantial health burden(Reference Azziz, Carmina and Chen1).
Meta-analyses have consistently shown an increased prevalence of cardiometabolic risk factors in women with PCOS, including obesity, insulin resistance, type 2 diabetes, dyslipidaemia, metabolic syndrome, hypertension, endothelial dysfunction and chronic low-grade inflammation(Reference Wekker, van Dammen and Koning5–Reference Yilmaz, Vellanki and Ata8). These risks are particularly pronounced in phenotypes A and B of PCOS, which are the most common phenotypes presenting to the clinic(Reference Helvaci and Yildiz4). Growing evidence suggests that inflammatory processes are linked to the metabolic consequences of PCOS(Reference Mancini, Bruno and Vergani9).
In women with PCOS, dietary interventions may serve as effective strategies for prevention, clinical management and the mitigation of chronic inflammation(Reference Teede, Tay and Laven10). The Dietary Inflammatory Index (DII), developed by Shivappa et al. (Reference Shivappa, Steck and Hurley11), quantifies the inflammatory potential of diets by aggregating the inflammatory index scores of various dietary components and has been proposed as a non-invasive marker for detecting inflammation in the body(Reference Shivappa, Steck and Hurley11). Numerous studies demonstrated that higher DII scores are associated with metabolic disorders, including insulin resistance, impaired glucose tolerance, type 2 diabetes(Reference Namazi, Anjom-Shoae and Najafi12,Reference Mi, Wang and Ma13) , CVD(Reference Namazi, Anjom-Shoae and Najafi12,Reference Zhang, Jia and Lai14) , dyslipidaemia(Reference Chen, Hou and Yao15) and chronic inflammation(Reference Mattavelli, Piperni and Asnicar16). Furthermore, emerging evidence suggests a potential link between elevated DII scores and the risk of PCOS development(Reference Zirak Sharkesh, Keshavarz and Nazari17,Reference Wang, Sun and Xu18) .
Chronic low-grade inflammation in PCOS highlights the need to examine the effects of the DII on PCOS and its associated metabolic disorders. Despite substantial research on DII and metabolic disorders, there is a notable gap in literature for the association between DII and metabolic consequences specifically in women with PCOS. Our hypothesis is that higher DII, reflecting more pro-inflammatory diet, are associated with a worse cardiometabolic profile in women with PCOS. Therefore, this study aimed to evaluate potential impact of DII on cardiometabolic risk parameters, including anthropometric indices, glucose metabolism, lipid profile and blood pressure, in women with PCOS.
Methods and materials
Study population
This case–control study included women with PCOS and age- and BMI-matched healthy controls recruited from the Endocrinology and Metabolism Outpatient Clinic at Hacettepe University between February 2022 and February 2024. The sample size was determined through a priori power analysis using G * Power software (version 3.1.9.4), with homeostatic model assessment for insulin resistance (HOMA-IR) identified as the primary outcome variable. To detect medium-to-large effect size (Cohen’s d = 0·67) with 80 % statistical power and two-sided significance level of 0·05, a total of seventy-six participants were required. This study was conducted according to the guidelines laid down in the Declaration of Helsinki, and all procedures involving human patients were approved by the Hacettepe University Clinical Research Ethics Committee (No: GO 21/350). Volunteers were interviewed face-to-face, and written informed consent was obtained from all participants prior to inclusion in the study.
PCOS was diagnosed according to the Rotterdam criteria, with phenotypes A and B included in the study (phenotype A: clinical/biochemical hyperandrogenism + oligo-anovulation + PCOM; phenotype B: clinical/biochemical hyperandrogenism + oligo-anovulation)(Reference Teede, Tay and Laven10,19,Reference Azziz, Carmina and Dewailly20) . The healthy control group consisted of women without clinical/biochemical hyperandrogenism, menstrual dysfunction or PCOM on ultrasound. Exclusion criteria were presence of chronic illness, medication use, pregnancy or lactation, endocrine disorders (e.g. hyperprolactinemia, thyroid disease and Cushing’s syndrome), recent use of oral contraceptives, smoking and being on a prescribed diet.
Clinical, hormonal and biochemical measurements
All measurements were conducted during the early follicular phase (days 2–5 of the menstrual cycle). For participants with amenorrhoea or severe oligomenorrhea, measurements were conducted during the early follicular phase of a progestin-induced withdrawal bleeding. The body composition was assessed using bioelectrical impedance analysis (TANITA MC-980), and BMI (kg/m2) was calculated from height and weight(21). The systolic (SBP) and diastolic blood pressure (DBP) measurements were obtained using a validated blood pressure monitor (Omron M3 Comfort) on the right arm, with participants seated and having rested for a minimum of 5 min.
Blood tests were taken after an overnight fast for at least 8 h in the morning. The levels of fasting blood glucose were analysed using the hexokinase method, lipid profiles (TAG, total cholesterol (TC), LDL-cholesterol, VLDL-cholesterol, HDL-cholesterol) were assessed with enzymatic methods, and fasting levels of insulin, total testosterone, follicle-stimulating hormone, luteinising hormone and sex hormone binding globulin (SHBG) were determined by the chemiluminescence microparticle immunoassay method as previously described(Reference Ozgen Saydam, Has and Bozdag22,Reference Çelik Eroğlu, Karaçoban and Idılman23) . Following blood collection from each participant, serum was separated from whole blood, snap-frozen and stored at –80°C. The high-sensitivity C-reactive protein (hs-CRP) levels were quantified using a commercially available enzyme-linked immunosorbent assay (ELISA) kit (Elabscience).
To provide a thorough evaluation of metabolic and hormonal status, the following indices were calculated. Free Androgen Index (FAI) was used to evaluate androgen bioavailability(Reference Al Kindi, Al Essry and Al Essry24), while HOMA-IR served as the standard measure for insulin resistance(Reference Rössner, Neovius and Mattsson25). To further investigate cardiometabolic risk and visceral adiposity beyond conventional markers, several specialised indices were included: Plasma Atherogenic Index (PAI) and Triglyceride-Glucose Index (TyG) were used as sensitive indicators of atherogenic risk and insulin sensitivity, respectively(Reference Simental-Mendía, Rodríguez-Morán and Guerrero-Romero26,Reference Onat, Can and Kaya27) . Additionally, Lipid Accumulation Product (LAP), Cardiometabolic Index (CMI) and Visceral Adiposity Index (VAI) were calculated as reliable indicators for visceral fat accumulation and distribution, which are closely associated with systemic metabolic dysfunction in women with PCOS(Reference Wakabayashi and Daimon28–Reference Amato, Giordano and Galia30). The formulas used were as follows: FAI = (total testosterone (mmol/l)/SHBG (nmol/l)) × 100; HOMA-IR = fasting serum glucose (mg/dl) × fasting insulin level (μIU/l)/405; PAI = log(TG (mg/dl) /HDL-C (mg/dl)); TyG = Ln [TG (mg/dl) × blood glucose (mg/dl)/ 2]; LAP = (waist circumference (cm) – 58] × TG (mM); CMI = TG (mg/dl)/ HDL-C (mg/dl) × waist circumference (cm)/height (cm); VAI = [waist circumference (cm)/36·58 + 1·89 × (BMI)] × (TG (mmol/l)/0·81) × (1·52/HDL (mmol/l))(Reference Al Kindi, Al Essry and Al Essry24–Reference Amato, Giordano and Galia30).
Dietary intake and Dietary Inflammatory Index calculation
The energy and nutrients intake of the individuals were determined using the validated semi-quantitative 129-item FFQ, which was administered and completed by the dietitian researcher for all individuals. Daily food intake was determined by multiplying the amounts of food consumed by the coefficients corresponding to the frequency of consumption. The obtained data were entered into the BEBIS (8.0) (Nutrition Information System) programme to determine the daily energy and nutrient intake of the individuals(Reference Neslişah and Emine31). Moreover, caffeine consumption of the individuals was calculated using US Department of Agriculture (USDA) National Nutrient Database-Caffeine(32).
The DII was calculated based on the method developed by Shivappa et al. (Reference Shivappa, Steck and Hurley11), using thirty-two food parameters (alcohol, β-carotene, caffeine, carbohydrate, cholesterol, energy, fibre, folic acid, garlic, green/black tea, Fe, Mg, MUFA, niacin, n-3 PUFA, n-6 PUFA, onion, total PUFA, protein, riboflavin, SFA, Se, thiamine, total fat, trans fatty acids, vitamin A, vitamin B6, vitamin B12, vitamin C, vitamin D, vitamin E and Zn). All thirty-two dietary parameters required for DII calculation were available for all participants. For each dietary parameter, a Z-score was computed by standardising intake values using global references; these scores were then converted to centred percentiles and multiplied by the respective inflammatory effect scores. Finally, the inflammatory score of each food item was summed to calculate the overall DII score for each participant(Reference Shivappa, Steck and Hurley11).
Statistical analysis
Data analysis was performed with the Statistical Package for Social Sciences (SPSS version 23.0). The distributions of the data were evaluated with Kolmogorov–Smirnov/Shapiro–Wilk, CV and skewness–kurtosis values. Data were presented as mean and standard deviation or median and interquartile range. To evaluate the difference between the groups, independent-samples t test was performed if the data were normally distributed; Mann–Whitney U test was performed if the data were not normally distributed. Furthermore, to evaluate the differences between PCOS and control groups while controlling for the effects of DII, separate ANCOVA was conducted for each cardiometabolic risk parameters. Additionally, the association between DII and cardiometabolic risk parameters in PCOS groups were assessed using linear regression models. In this context, data related to anthropometric measurements were adjusted for age and daily energy intake, while the rest of data were adjusted for age, daily energy intake, BMI and waist-to-hip ratio. Statistically significance level was determined at P < 0·05.
Results
General characteristics of the participants
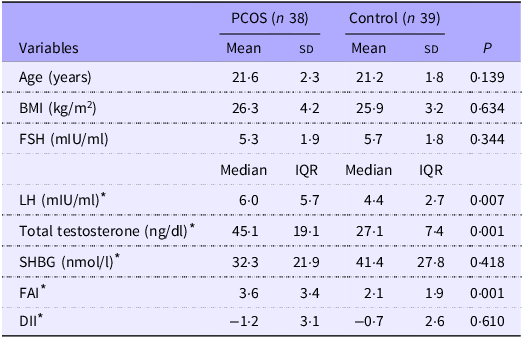
The study included thirty-eight women with PCOS and thirty-nine age- and BMI-matched healthy women as controls. Data on general characteristics of participants were presented in Table 1. Serum luteinising hormone, total testosterone and FAI values were significantly higher in PCOS group compared with controls (P = 0·007, 0·001, and 0·001, respectively). There were no statistically significant differences in the DII scores between the PCOS and control groups (P = 0·610) (Table 1).
General characteristics of women with PCOS and healthy controls

Table 1. Long description
The table presents a comparison of general characteristics between thirty-eight women with PCOS and thirty-nine age- and BMI-matched healthy women as controls. It includes variables such as age, body mass index (BMI), follicle-stimulating hormone (FSH), luteinizing hormone (LH), total testosterone, sex hormone-binding globulin (SHBG), free androgen index (FAI), and dietary inflammatory index (DII) scores. The table has six rows and eight columns, with columns for mean, standard deviation (SD), median, and interquartile range (IQR) for each variable. Notable trends include significantly higher LH, total testosterone, and FAI values in the PCOS group compared to controls, with P values of 0.007, 0.001, and 0.001, respectively. There were no statistically significant differences in the DII scores between the two groups, with a P value of 0.610. The table provides a detailed comparison of these variables, highlighting key differences and similarities between the PCOS and control groups.
PCOS, polycystic ovary syndrome; FSH, follicle-stimulating hormone; LH, luteinising hormone; SHBG, sex hormone binging globulin; FAI, Free Androgen Index; DII, Dietary Inflammatory Index.
* The data were shown as median (interquartile range (IQR)) and evaluated with Mann–Whitney U test; the rest of data was shown as mean and standard deviation and assessed using the independent-samples t test to analyse the differences between the PCOS and control groups.
Effects of polycystic ovary syndrome and Dietary Inflammatory Index on cardiometabolic risk
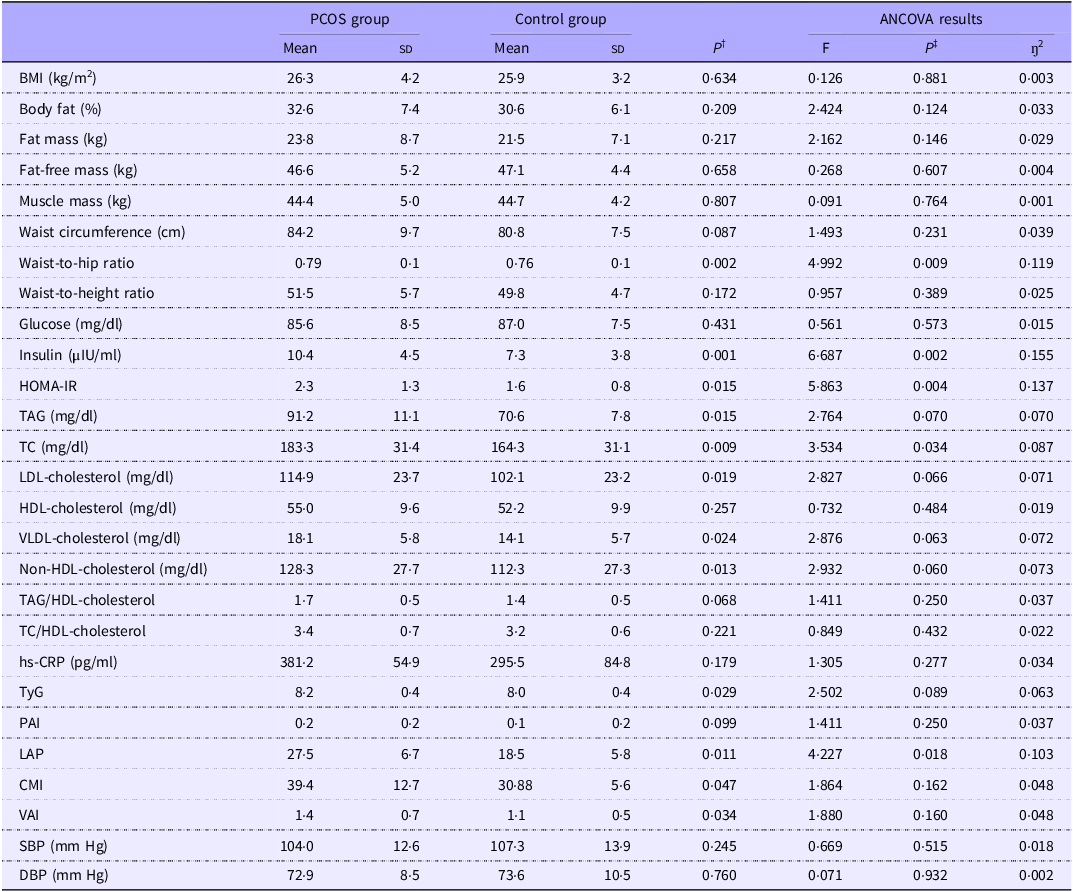
Clinical, anthropometric, biochemical data, cardiometabolic risk indices of the PCOS and control groups, as well as the effects of DII on these data, are presented in Table 2. No statistically significant differences were observed between the groups for BMI, waist circumference, waist-to-height ratio, body fat percentage, fat mass, fat-free mass and muscle mass. In contrast, the waist-to-hip ratio was higher in PCOS group compared with control group (P = 0·002). The results of the ANCOVA revealed a significant difference between the groups for waist-to-hip ratio even after adjusting for the DII (F = 4·992, P = 0·009, η2 = 0·119) (Table 2).
Effects of group differences and Dietary Inflammatory Index on cardiometabolic risk parameters in women with PCOS and healthy controls: descriptive statistics and ANCOVA results

Table 2. Long description
The table presents descriptive statistics and ANCOVA results for cardiometabolic risk parameters in women with PCOS and healthy controls. It includes measurements such as BMI, body fat percentage, fat mass, fat-free mass, muscle mass, waist circumference, waist-to-hip ratio, waist-to-height ratio, glucose, insulin, HOMA-IR, TAG, TC, LDL-cholesterol, HDL-cholesterol, VLDL-cholesterol, non-HDL-cholesterol, TAG/HDL-cholesterol, TC/HDL-cholesterol, hs-CRP, TyG, PAI, LAP, CMI, VAI, SBP, and DBP. The table shows mean values and standard deviations for each parameter in both groups, along with ANCOVA results including P-values, F-values, and partial eta squared. Notable differences include higher waist-to-hip ratio in the PCOS group and significant differences in insulin, HOMA-IR, TAG, TC, LDL-cholesterol, VLDL-cholesterol, non-HDL-cholesterol, TyG, LAP, CMI, and VAI between the groups.
PCOS, polycystic ovary syndrome; HOMA-IR, homeostatic model assessment for insulin resistance; TC, total cholesterol; hs-CRP, high-sensitivity C-reactive protein; TyG, Triglyceride-Glucose Index; PAI, Plasma Atherogenic Index; LAP, Lipid Accumulation Product; CMI, Cardiometabolic Index; VAI, Visceral Adiposity Index; SBP, systolic blood pressure; DBP, diastolic blood pressure.
The data were shown as mean and standard deviation and assessed using the independent-samples t test to analyse the differences between the PCOS and control groups.
† Independent-samples t tests were performed.
‡ P-values reported here are from the ANCOVA models.
Fasting serum insulin and HOMA-IR values were higher in women with PCOS compared with controls (P = 0·001 and P = 0·015, respectively). In the ANCOVA analysis, when DII was included as a covariate, the differences in serum insulin levels (F = 6·687, P = 0·002, η2 = 0·115) and HOMA-IR values (F = 5·863, P = 0·004, η2 = 0·137) between the groups persisted independently of DII (Table 2).
Lipids including TAG, TC, LDL-cholesterol, VLDL-cholesterol and non-HDL-cholesterol were significantly higher in the PCOS group, while HDL-cholesterol levels the TAG/HDL-cholesterol and TC/HDL-cholesterol ratios did not differ between the groups (Table 2). ANCOVA analysis, with DII included as a covariate, revealed a significant difference in TC levels between the groups independent of DII (F = 3·534, P = 0·034, η2 = 0·087), while ANCOVA analysis indicated no statistically significant differences in TAG, LDL-cholesterol, VLDL-cholesterol and non-HDL-cholesterol levels between the groups (Table 2).
Calculated indices (TyG, PAI, LAP, CMI and VAI) were analysed across groups. Compared with the control group, the PCOS group showed significantly higher values for TyG, LAP, CMI and VAI, while PAI did not differ significantly between groups. When controlling for the DII using ANCOVA, a significant difference was observed only for LAP (F = 4·227, P = 0·018, η2 = 0·103) between the groups, whereas no significant differences were found for TyG, CMI or VAI. Additionally, no significant differences were observed between the groups for hs-CRP, SBP or DBP (Table 2).
Correlation of Dietary Inflammatory Index and cardiometabolic risk factors in polycystic ovary syndrome
The associations between DII and cardiometabolic risk factors in PCOS group were analysed by linear regression, with the results presented in Figure 1. After adjusting for age and daily energy intake, positive associations were found between the DII scores and waist-to-hip ratio (β = 0·393, P = 0·001), waist-to-height ratio (β = 0·283, P = 0·036), LAP (β = 0·378, P = 0·001) and CMI (β = 0·363, P = 0·004). Further analysis of biochemical data, adjusting for age, BMI, waist-to-hip ratio and daily energy intake, demonstrated that the DII scores were positively correlated with fasting serum glucose (β = 0·429, P = 0·001), TAG (β = 0·222, P = 0·037), VLDL-cholesterol (β = 0·220, P = 0·036), non-HDL-cholesterol (β = 0·180, P = 0·042) and LDL-cholesterol (β = 0·163, P = 0·048). Additionally, significant positive correlations were observed between the DII scores and TC:HDL-cholesterol ratio (β = 0·290, P = 0·019), TAG:HDL-cholesterol ratio (β = 0·234, P = 0·036), PAI (β = 0·351, P = 0·002), TyG (β = 0·204, P = 0·028) and SBP (β = 0·245, P = 0·038). In contrast, the DII scores were inversely associated with serum HDL-cholesterol levels (β = −0·146, P = 0·018) (Figure 1). In addition, the DII scores were not statistically associated with body fat percentage (β = 0·233, P = 0·193), fat mass (β = 0·192, P = 0·286), fat-free mass (β = −0·048, P = 0·787) and muscle mass (β = 0·026, P = 0·883) (data were not shown).
Higher Dietary Inflammatory Index (DII) scores were significantly associated with adverse cardiometabolic risk parameters in women with polycystic ovary syndrome (PCOS). Linear regression analysis was performed to examine the associations. Variables are grouped by category: anthropometric measurements (BMI, waist circumference, waist-to-hip ratio, waist-to-height ratio; Lipid Accumulation Product (LAP), Cardiometabolic Index (CMI), Visceral Adiposity Index (VAI)); blood pressure: systolic blood pressure (SBP), diastolic blood pressure (DBP); glucose regulation: fasting glucose, fasting insulin, homeostatic model assessment for insulin resistance (HOMA-IR); lipid profile: TAG, LDL-cholesterol, HDL-cholesterol, total cholesterol (TC); others: high-sensitivity C-reactive protein (hs-CRP), Triglyceride-Glucose Index (TyG). Data related to anthropometric measurements were adjusted for age and daily energy intake, while the remaining parameters were adjusted for age, daily energy intake, BMI and waist-to-hip ratio.

Figure 1. Long description
The dot plot presents standardized beta-coefficients for the association of Dietary Inflammatory Index scores with various cardiometabolic risk parameters in women with polycystic ovary syndrome. The x-axis represents standardized beta-coefficients, while the y-axis lists different cardiometabolic risk parameters grouped by category: anthropometric measurements, blood pressure, glucose regulation, lipid profile, and others. Each dot represents a parameter, with different shapes and colors indicating the category. Positive associations are shown with dots to the right of the vertical dashed line at zero. The plot includes data points for glucose, waist-to-hip ratio, LAP, CMI, TC/HDL-C, waist-to-height ratio, SBP, TG/HDL-C, TG, VLDL-C, TyG, non HDL-C, LDL, DBP, hs-CRP, TC, waist circumference, VAI, BMI, HOMA-IR, insulin, and HDL-C. The legend explains the color coding for different categories: purple for anthropometric measurements, cyan for blood pressure, blue for glucose regulation, yellow for lipid profile, and green for others. The plot highlights significant associations with glucose, waist-to-hip ratio, LAP, CMI, and other parameters. All values are approximated.
Discussion
In this study, we identified a notable association between the inflammatory potential of the diet, as measured by the DII, and cardiometabolic disturbances in women with PCOS. Our findings highlight that women classified under phenotypes A and B, those presenting with hyperandrogenism and ovulatory dysfunction, showed a greater burden of metabolic abnormalities. The novelty of our results lies in the observation that higher DII scores, reflecting pro-inflammatory dietary patterns, were linked to the exacerbation of these metabolic derangements, supporting our hypothesis. This relationship seemed to persist independently or alongside the intrinsic endocrine and metabolic disruptions typical of PCOS, indicating that dietary inflammation may contribute to disease severity. Though, given the case–control design of the study, these associations should be interpreted with caution, as causal relationships cannot be established.
Low-grade chronic inflammation contributes significantly to metabolic dysfunction in PCOS(Reference Rudnicka, Suchta and Grymowicz33–Reference Deng, Chen and Xing35). While DII scores did not differ between groups, consistent with previous studies(Reference Zirak Sharkesh, Keshavarz and Nazari17,Reference Azarbayjani, Jahanian Sadatmahalleh and Mottaghi36) , this finding suggests that women with PCOS do not inherently consume diets with a higher inflammatory potential than healthy controls(Reference Álvarez-Blasco, Luque-Ramírez and Escobar-Morreale37,Reference Wright, Zborowski and Talbott38) . Our univariate ANCOVA analysis showed that several significant differences in cardiometabolic markers (such as TAG, LDL-cholesterol and VAI) between the PCOS and control groups were no longer statistically significant after controlling for DII. Given the significant associations found between DII and cardiometabolic risk parameters in the PCOS group, this result suggests that dietary inflammatory potential may serve as an amplifier of underlying metabolic vulnerabilities rather than an independent determinant(Reference Rudnicka, Suchta and Grymowicz33–Reference Deng, Chen and Xing35). This observation is particularly relevant within the context of a case–control design, where differences between groups may reflect underlying group characteristics rather than causal or directional relationships. Because PCOS is characterised by chronic low-grade inflammation and insulin resistance, women with the syndrome may have increased biological susceptibility to pro-inflammatory dietary patterns, such that similar DII scores may result in more pronounced metabolic consequences(Reference Deng, Chen and Xing35). Notably, despite these metabolic links, no significant association was observed between DII and hs-CRP levels, and hs-CRP levels did not differ between groups. This finding is consistent with previous studies reporting inconsistent associations between DII and systemic inflammatory biomarkers(Reference Azarbayjani, Jahanian Sadatmahalleh and Mottaghi36,Reference Gomes, Viola and Carvalho39) . Because hs-CRP is sensitive to acute physiological changes, hormonal status and adiposity, it may not fully capture the complex, multi-pathway inflammatory mechanisms involved in PCOS(Reference De Robles, Wiggins and Del Mundo40). Therefore, the lack of a significant hs-CRP association does not necessarily diminish the critical role of dietary inflammatory potential in contributing to the metabolic disturbances observed in this population.
Women with PCOS often exhibit abdominal obesity, reflected in a higher waist-to-hip ratio, even when their BMI is normal(Reference Lim, Davies and Norman41). This fat distribution pattern is associated with reduced SHBG levels, elevated free androgens and the worsening of metabolic and reproductive disturbances in PCOS, thereby enhancing metabolic disturbances(Reference Delitala, Capobianco and Delitala42–Reference Jena, Choudhury and Mangaraj45). In our study, the PCOS group showed significantly higher waist-to-hip ratio, a difference explained by the presence of PCOS as confirmed by univariate analysis with DII. Additionally, regression analysis demonstrated that DII scores were positively linked to central obesity. Similarly, recent studies have indicated that an increased DII may lead to higher waist-to-hip ratio and waist-to-height ratio, both of which are indicators of abdominal obesity(Reference Li, Shu and Yi46,Reference Rahimlou, Ahmadi and Cheraghian47) . These findings highlight that beyond total weight, the inflammatory potential of the diet may play a key role in fat distribution, particularly in the abdominal region. Notably, there were no significant differences between groups in body fat percentage, fat mass, fat-free mass or muscle mass. This suggests that the elevated HOMA-IR and fasting insulin observed in women with PCOS are related to the distinct hormonal and inflammatory dynamics of the syndrome rather than just total mass(Reference Dumesic, Phan and Leung48). Since abdominal obesity is one of the key drivers of insulin resistance, inflammation and related metabolic disorders in PCOS, medical nutrition therapy should prioritise not only weight and fat mass loss but also the modulation of dietary inflammatory load.
Insulin resistance and resulting hyperinsulinemia are key contributors to metabolic disturbances commonly observed in PCOS(Reference Armanini, Boscaro and Bordin49). Meta-analyses have shown that women with PCOS are at increased risk for impaired glucose tolerance, insulin resistance and type 2 diabetes, regardless of BMI status(Reference Moran, Misso and Wild50,Reference Zhu, Zhang and Jiang51) . Notably, insulin resistance affects up to 75 % of lean and 95 % of overweight women with PCOS(Reference Stepto, Cassar and Joham52). In line with these findings, our study revealed significantly higher fasting insulin levels and HOMA-IR values in the PCOS group compared with age- and BMI-matched healthy controls, even after adjusting for DII. Moreover, both a recent meta-analysis(Reference Bakhshimoghaddam, Chaharlang and Mansoori53) and observational studies(Reference Mi, Wang and Ma13,Reference Rahimlou, Ahmadi and Cheraghian47) have reported significant associations between higher DII scores and increased risk of hyperglycaemia. Consistent with evidence linking chronic low-grade inflammation to impaired glucose regulation in PCOS(Reference Aboeldalyl, James and Seyam54), our analysis also revealed a positive association between DII scores and fasting glucose levels. Collectively, these findings underscore the potential of anti-inflammatory dietary strategies in the nutritional management of PCOS, particularly in improving glucose regulation and reducing chronic inflammation. While insulin resistance remains a key feature of PCOS, our findings suggest that dietary inflammation may influence glycaemic control independently of insulin resistance.
Meta-analyses have shown that the risk of dyslipidaemia is doubled in women with PCOS compared with healthy women, even after adjusting for BMI and weight(Reference Wang, Calderon-Margalit and Cedars55,Reference Wild, Rizzo and Clifton56) . Consistent with these findings, our study showed that women with PCOS had significantly more adverse lipid profiles than age- and BMI-matched healthy controls. Moreover, higher DII scores were positively associated with an atherogenic lipid profile and negatively associated with HDL-C levels. Although the relationship between DII and lipid parameters has been documented in various populations(Reference Pasdar, Moradi and Cheshmeh57,Reference Heidarzadeh-Esfahani, Hajahmadi and Pasdar58) , evidence regarding this association specifically in women with PCOS remains limited. Our findings therefore contribute to the growing body of literature suggesting that dietary inflammatory potential may be linked to adverse lipid profile in this population. In addition, several cardiometabolic risk indices including TyG, PAI, LAP, CMI and VAI, many of which reflect visceral adiposity and metabolic dysfunction, were significantly elevated in women with PCOS and showed positive associations with DII scores. Taken together with existing literature(Reference Wekker, van Dammen and Koning5,Reference Delitala, Capobianco and Delitala42,Reference Anagnostis, Tarlatzis and Kauffman43,Reference Kamboj, Banerjee and Das59) , our findings emphasise that women with PCOS are at increased cardiometabolic risk and that dietary patterns may play a critical role in the development and progression of these metabolic disturbances.
While some studies reported an increased risk of hypertension in women with PCOS(Reference Chen, Yang and Yang60), the evidence remains inconsistent(Reference Amiri, Ramezani Tehrani and Behboudi-Gandevani61). In our study, higher DII scores were positively associated with SBP. Notably, although DII scores did not differ significantly between groups, the observed associations between dietary inflammatory potential and adverse metabolic outcomes in women with PCOS underscore dietary inflammation as a modifiable factor that may contribute to disease progression.
This study has several limitations. First, the case–control design employed in this study enables comparison between women with PCOS and matched healthy controls; however, it limits the ability to infer causality. Second, the sample size may limit the power to detect small effect sizes in complex regression models; therefore, secondary findings should be interpreted with caution. Third, the assessment of dietary intake was based on self-reported FFQ, which are prone to recall bias and inaccuracies. Finally, although the DII is a validated tool, it does not account for food preparation methods, nutrient bioavailability or interactions between nutrients, which may influence the inflammatory potential of the diet.
This study suggests that dietary inflammatory potential may be associated with adverse cardiometabolic markers in women with PCOS, including central adiposity, dyslipidaemia, impaired glucose regulation and elevated SBP. Although the case–control design limits causal inference, these findings support the anti-inflammatory dietary patterns characterised by higher intake of fruits, vegetables, whole grains, fish and healthy fats in improving metabolic outcomes. Further longitudinal and interventional studies are warranted.
Acknowledgements
None
This study was supported by the Hacettepe University Scientific Research Projects Coordination Unit with project number THD-2022-19873.
E. U.: conceptualisation, data curation, formal analysis, methodology, visualisation and writing – original draft; S. A.: conceptualisation, data curation and writing – original draft; A. A. P.: conceptualisation, methodology, project administration and writing – review and editing; B. O. Y.: conceptualisation, methodology, project administration and writing – review and editing. All authors have read and approved the final manuscript.
There are no conflicts of interest.


 Open access

