I. INTRODUCTION
Co-base superalloys strengthened by coherently embedded Co3(Al,W) γ′ precipitates were discovered in 2006 in the ternary system Co–Al–W. Reference Sato, Omori, Oikawa, Ohnuma, Kainuma and Ishida1 This novel material class with a γ/γ′ microstructure similar to Ni-base superalloys has the potential for high temperature applications. The strength and creep properties of Co–Al–W-based superalloys are comparable to wrought Reference Neumeier, Freund and Göken2 and first generation cast Reference Suzuki and Pollock3–Reference Titus, Suzuki and Pollock6 Ni-base superalloys. In Ni-base superalloys refractory elements, especially Re, are added to increase the high temperature capability and creep properties. Reference Blavette, Caron and Khan7,Reference Pyczak, Neumeier and Göken8 Re acts as a strong solid solution strengthening element in the γ phase Reference Durst and Göken9,Reference Yeh and Tin10 since it strongly partitions to the matrix phase. Reference Pyczak, Devrient, Mughrabi, Green, Pollock, Harada, Howson, Reed, Schirra and Walston11–Reference Reed, Yeh, Tin, Babu and Miller14 Furthermore, Re is the slowest diffusing element in Ni-base superalloys and thus of great importance for retarding diffusion controlled creep processes. Reference Franke, Durst and Göken15–Reference Mottura, Reed, Guédou and Choné18 Therefore, Re would be a very interesting alloying element also for Co-base superalloys if it behaves there in a similar manner. Recently, Neumeier et al. Reference Neumeier, Rehman, Neuner, Zenk, Michel, Schuwalow, Rogal, Drautz and Göken19 published diffusion coefficients for Re and other elements in fcc Co. They found that Re is also the slowest diffusing element in fcc Co among the elements typically added to superalloys. The diffusivity of the transition metal solutes is typically lower than in Ni alloys. These findings suggest that Re could also play a significant role for improving the creep resistance of Co-base superalloys. However, so far there are no investigations on the partitioning behavior of Re in γ/γ′ Co-base superalloys. Furthermore it is not clear how Re influences the mechanical properties of the γ and γ′ phase and the creep properties. Suzuki et al. Reference Suzuki and Pollock3 investigated the mechanical properties of a Re containing Co–8.8Al–9.8W–2Re alloy. They did not observe any increase in the compression strength up to 800 °C compared to a Re-free alloy. The main topic of this study is to clarify if the addition of Re to Co-base superalloys has a similar beneficial impact on the mechanical properties as it has for Ni-base superalloys.
II. EXPERIMENTAL
For these investigations, two γ′-strengthened model Co-base superalloys, one Re-containing (referred to as “ERBOCo-Re1”) and one Re-free (referred to as “ERBOCo-Re0”) alloy, were produced. The nominal and measured compositions of the alloys are shown in Table I. The material was produced from a master melt (45.53Co–7Al–47.5W in wt%) and raw elements of at least 99.9% purity. For creep testing, nanoindentation and micro-pillar compression testing, single crystalline bars with an orientation misalignment below 9° from the [100] crystal direction were produced using the Bridgman process. Reference Heckl, Rettig and Singer20 For atom probe tomography (APT), polycrystalline bars were produced by arc melting.
Nominal and measured compositions (SEM-EDX) of the investigated alloys in at.%.

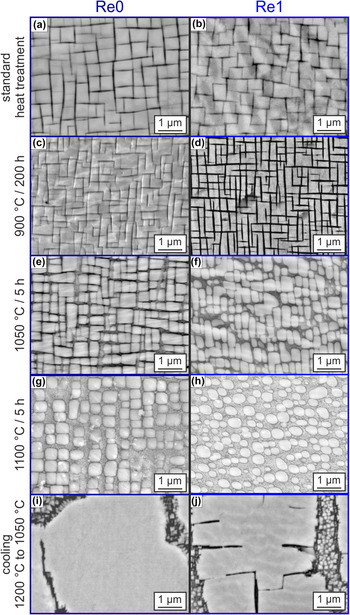
For different experimental purposes, various heat treatments were conducted. The samples for APT were homogenized at 1280 °C for 24 h and subsequently aged at 900 °C for 200 h. This heat treatment was chosen according to a standard heat treatment for ternary Co–Al–W alloys Reference Bauer, Neumeier, Pyczak and Göken4 with a γ′-solvus temperature around 960 °C. For achieving a reasonable γ′ size, the heat treatment was conducted for 200 h. To analyze the chemical composition as a function of temperature, two additional heat treatments for 5 h at 1100 °C and 1050 °C, respectively, were performed [see Figs. 1(c)–1(h)]. The intention of these heat treatments was to generate the specific phase fractions and compositions characteristic for these different temperatures. Due to the relatively high temperatures, short annealing times are believed to be sufficient. For all the other experiments the same standard heat treatment consisting of a solution heat treatment at 1280 °C for 8 h and two precipitate aging steps at 1050 °C for 5 h and 900 °C at 16 h were performed. To coarsen the γ′ precipitates for the nanoindentation and micro-pillar compression tests, the samples were subjected to an additional heat treatment, starting at 1200 °C with subsequent continuous cooling to 1050 °C, using a very slow cooling rate of 1.5 °C/h. At the final temperature of 1050 °C the samples were additionally held for 100 h to further coarsen the microstructure.
SEM-BSE micrographs of the alloys ERBOCo-Re0 (left column) and ERBOCo-Re1 (right column) after different heat treatments. Standard heat treated: 1280 °C/8 h + 1050 °C/5 h + 900 °C/16 h (a) and (b). Heat treated for APT investigations: 1280 °C/24 h + 900 °C/200 h (c) and (d), aging at 1280 °C/24 h + 900 °C/200 h + X, X = 1050 °C/5 h (e) and (f), X = 1100 °C/5 h (g) and (h). Heat treated for micromechanical testing: 1280 °C/8 h + 1050 °C/5 h + 900 °C/16 h + slow cooling from 1200 to 1050 °C (i) and (j).

The γ′-solvus temperature was determined by differential scanning calorimetry (DSC) (STA 409, Netzsch, Selb, Germany), using samples with a diameter of 5 mm and a thickness of 1 mm. Measurements were performed up to 1500 °C with a heating rate of 5 °C/min from 900 to 1500 °C.
After a metallographic standard sample preparation procedure with a final chemical mechanical polishing, the microstructure was characterized using a scanning electron microscope (SEM) (Crossbeam 1540 EsB, Zeiss, Oberkochen, Germany). The chemical composition was checked in the SEM by using energy dispersive X-ray spectroscopy (EDX; INCA Energy 350, Oxford Instruments, Abingdon, United Kingdom). Transmission electron microscopy (TEM) (CM200, Philips, now FEI company, Hillsboro, Oregon) was carried out at 200 kV acceleration voltage on creep deformed samples. For this purpose, slices were cut parallel to the loading direction, ground to a thickness of about 200 nm and thinned by electro twin-jet polishing using a 60% perchloric acid in methanol and 2-butoxy-ethanol electrolyte (A3 electrolyte, Struers, Ballerup, Denmark) at −30 °C.
Compression creep tests were performed in air at 1050 °C with a constant stress of 125 MPa to a plastic strain of 0.5 and 2.5%.
Micro-pillars were prepared using focused ion beam (FIB) milling (Helios NanoLab, FEI, Hillsboro, OR) from γ′ precipitates. The FIB currents were progressively reduced, starting with 30 kV/10 nA and ending with a fine milling current of 30 kV/70 pA. All micro-pillars were milled to a diameter of 1 µm. The pillars are surrounded by a trench to avoid contact between the flat punch indenter and the surface. Nanoindentation (Nanoindenter G200, Keysight Technologies, Santa Clara, CA) was performed using a Berkovich tip and an indentation strain rate of 5 × 10⁻² s−1 to a final indentation depth of 100 nm. The resulting load–displacement data were analyzed using the Oliver and Pharr method. Reference Oliver and Pharr21 For micro-pillar compression the same nanoindenter was used, yet equipped with a flat punch indenter (8 µm diameter). The top surfaces of the micro-pillars were aligned parallel to the flat punch using a goniometer sample holder. A loading rate of 50 µN s−1 was used and the tests were stopped at a displacement of 200 nm. The top diameter of the pillar was used to calculate the flow stress.
The chemical composition of the γ and γ′ phase was measured with a reflectron-equipped local electrode atom probe (LEAP 3000X HR, Cameca Instruments, Madison, WI) in pulsed laser mode. Laser pulses of 532 nm wave length, 12 ps pulse length, 0.4 nJ energy, and 100 kHz frequency were applied, while the base temperature of the samples was kept at ∼40 K and a detection rate at 0.005 ions per pulse. Data reconstruction and analysis were performed using the software package IVASTM 3.6.6. (Cameca Instruments, Madison, Wisconsin). Ranging limits for all mass spectra peaks of alloying elements were set at 1/5 of the peak amplitude to reduce the influence of peak overlap on the measured compositions. γ/γ′ interfaces were identified as Co isoconcentration surfaces (concentration value varies for different samples) and concentration profiles across interfaces were built as proximity histograms. Reference Hellman, Vandenbroucke, Rüsing, Isheim and Seidman22 Bulk compositions for γ and γ′ phases were accurately measured for the APT dataset subvolumes distant at least 4 nm from interfaces. APT samples were prepared using a dual-beam FIB system (Helios Nanolab 600, FEI, Hillsboro, Oregon by the conventional lift-out technique. Reference Thompson, Lawrence, Larson, Olson, Kelly and Gorman23 The first ∼1 Mio. ions in each APT dataset were discarded from the analysis due to its residual contamination with Ga ions during a sample preparation.
III. RESULTS AND DISCUSSION
The microstructures observed after different heat treatments are shown in Fig. 1. All samples exhibit a typical γ/γ′ microstructure, where the γ′ phase appears in bright contrast as probed in backscattered electron mode (BSE).
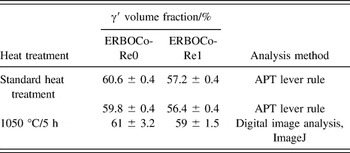
The γ′ volume fraction (see Table II) determined by the lever rule from APT measurements after standard heat treatment and 1050 °C/5 h show that in both cases the ERBOCo-Re0 has a slightly higher γ′ volume fraction. The γ′ volume fraction determined by digital image analysis using ImageJ is slightly higher but shows a similar trend. The morphology of the γ′ precipitates at high temperatures changes from rather cuboidal [see Figs. 1(e) and 1(g)] to more round-shaped precipitates [see Figs. 1(f) and 1(h)] through the addition of Re. This implies that the lattice misfit and thus the coherency stresses are reduced by the addition of Re. The γ′ solvus temperature was determined to approximately 1150 °C for both alloys. The coarsened microstructure after slow cooling from 1200 to 1050 °C is characterized by large γ′ precipitates with a size of up to 10 μm [see Figs. 1(i) and 1(j)]. This coarsened microstructure allows to mill micro-pillars from γ′ precipitates, hence it is not necessary to produce a single phase γ′ alloy with a different alloy composition. Due to the formation of secondary γ′ precipitates [see Figs. 1(i) and 1(j)] in the matrix channels the nanomechanical tests were performed only on the γ′ phase, since the mechanical properties of the matrix phase would have been influenced by an additional precipitation hardening. Reference Neumeier, Pyczak and Göken24
γ′ volume fractions of the investigated alloys after standard heat treatment and 1050 °C/5 h.

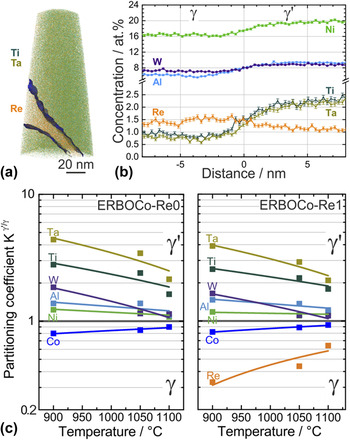
Figure 2(a) shows exemplary a three-dimensional element map acquired from an APT analysis of the ERBOCo-Re1 sample annealed at 1100 °C/5 h. The corresponding concentration profile across a γ/γ′ interface [defined here as a 60 at.% Co isoconcentration surface and visualized in Fig. 2(a) in blue] reveals that Re partitions to the γ phase, see Fig. 2(b). By measuring the phase composition, the partitioning coefficient k for a specific element i is given by
 ${k_i} = {{c_i^{\gamma '}} \mathord{\left/ {\vphantom {{c_i^{\gamma '}} {c_i^\gamma }}} \right. \kern-\nulldelimiterspace} {c_i^\gamma }}$
. In this equation,
 $c_i^{\gamma '}$
and
 $c_i^\gamma$
are the concentrations of a specific element i in the γ′ and γ phase, respectively.
(a) APT atom map for Ti, Ta, and Re of the sample aged at 1100 °C/5 h (Re is represented by orange color), (b) the corresponding concentration profile across a γ/γ′ interface, and (c) the measured partitioning coefficients for all conditions tested of the alloys ERBOCo-Re0 and ERBOCo-Re1.

All partitioning coefficients as a function of temperature are shown in Fig. 2(c). With increasing temperature the partitioning of the elements to a specific phase is less pronounced and approaches a coefficient of 1, which is consistent to results reported in literature. Reference Pyczak, Neumeier and Göken25 This occurs due to a decreasing γ′ volume fraction that results in progressive release of γ′-forming elements into the γ matrix. All elements, except Co and Re, partition preferable to the γ′ phase (k i > 1). Ta is the element with the strongest partitioning to the γ′ phase over the entire temperature range and W shows also a preferred partitioning behavior to the γ′ phase which is consistent with literature. Reference Sato, Omori, Oikawa, Ohnuma, Kainuma and Ishida1,Reference Omori, Oikawa, Sato, Ohnuma, Kattner, Kainuma and Ishida26–Reference Meher, Yan, Nag, Dye and Banerjee30 This is opposite to the typical behavior of W in Ni-base superalloys. Reference Pyczak, Devrient, Mughrabi, Green, Pollock, Harada, Howson, Reed, Schirra and Walston11,Reference Reed, Yeh, Tin, Babu and Miller14 A quite higher amount of W is present in the γ phase of Ni-base superalloys compared to the Co-base superalloy investigated here. Re is found to partition preferably to the γ matrix, which is the same trend observed also for multinary Ni-base superalloys. However, the partitioning of Re to the γ matrix (∼60% of all atoms) of the current Co-base superalloy is lower than in multinary Ni-base superalloys, where up to 90% of all Re atoms are concentrated in the γ phase. Reference Murakami, Honma, Koizumi, Harada, Pollock, Kissinger, Bowman, Green, McLean, Olsen and Schirra13,Reference Neumeier, Pyczak and Göken24,Reference Han, Ma, Dong, Li, Gong, Reed, Green, Caron, Gabb, Fahrmann, Huron and Woodard31 Such a pronounced partitioning effect is not observed for the ERBOCo-Re1 alloy, i.e., Re partitions more modestly between γ and γ′ in this material. The solubility of Re in pure fcc Co Reference Brunner, Hüttner, Bölitz, Völkl, Mukherji, Rösler, Depka, Somsen, Eggeler and Glatzel32 and that in Ni Reference Nash and Nash33 are approximately equal between 900 and 1100 °C. This observation implies that the observed partitioning behavior is not due to a different solubility in the γ phase. Furthermore, it is observed that the addition of Re changes the partitioning coefficient of other alloying elements only slightly (see Table III).
Compositions (APT) of the γ phase and the γ′ phase of the investigated alloys in at.% after standard heat treatment and additionally aged at 1050 °C/5 h.

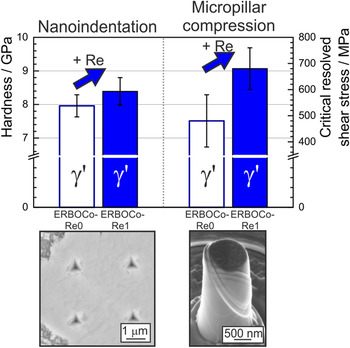
Due to the significant solubility of Re in the γ′ phase, a certain amount of Re is present in the γ′ phase (0.7 at.% at 1050 °C, see Table III). This leads to an increase in hardness of the γ′ phase as revealed by nanoindentation and micro-pillar compression tests (Fig. 3). Mishima et al. Reference Mishima, Ochiai, Hamao, Yodogawa and Suzuki34,Reference Mishima, Ochiai, Yodogawa and Suzuki35 could show that W and Ta are not only effective solid solution strengthening elements in fcc Ni but also in the L12 compound Ni3Al. It is likely that W and Ta as well as Re strengthen the L12 compound Co3(Al,W). Since the overall concentration of W, Ta, and Re is higher in the γ′ phase due to the addition of Re, the hardness increases (Fig. 3). These results are in contrast to nanoindentation results for Ni-base superalloys, where the addition of Re does not lead to an increase of the hardness of the γ′ phase due to its very low concentration. Reference Neumeier, Pyczak and Göken24
Effect of Re addition on the hardness and CRSS as determined by nanoindentation and micro-pillar compression experiments.

The results from nanoindentation testing closely correlate with the micro-pillar experiments which show an increased critical resolved shear stress (CRSS) due to the addition of Re. For compression along the [100] loading direction, the deformation is expected to operate on the {111}〈110〉 slip system (see deformed pillar in Fig. 3) and thus the CRSS for this slip system is determined.
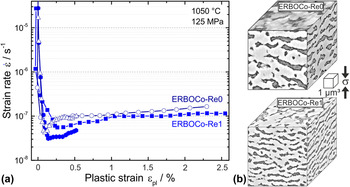
To finally evaluate the performance at high temperatures, the creep properties need to be considered. During creep the microstructure of both alloys changes and γ/γ′ rafts form perpendicular to the compressive stress axis [see Fig. 4(b)]. This indicates a positive lattice misfit at the test temperature of 1050 °C Reference Titus, Suzuki and Pollock6 which is different to most Ni-base superalloys with a negative lattice misfit. Reference Mughrabi36 Moreover, a topological inversion takes place in both alloys so that the former γ′ cubes connect, percolate and finally form the matrix phase. Both ERBOCo alloys show similar creep curves; however, after reaching the minimum creep rate [see Fig. 4(a)], the Re-free samples show an accelerated softening compared to the Re-containing samples, which may be due to a faster coarsening of the microstructure of the Re-free sample due to a larger misfit and an enhanced diffusivity.
(a) Compression creep curves of ERBOCo-Re0 and ERBOCo-Re1 at 1050 °C/125 MPa (b) SEM micrographs after creep deformation to 2.5% plastic strain.

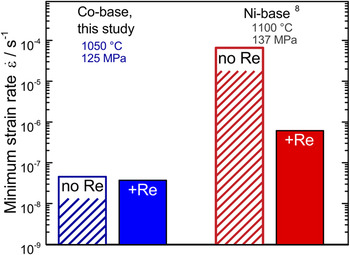
However, the most interesting result is that the effect of Re on the creep properties in Co-base superalloys is surprisingly small. Fig. 5 shows an overview of the effect of Re on the minimum creep rate of Co-base superalloys tested in this work in comparison to Ni-base superalloys [nominal compositions in wt%: Ni–4.9Al–3.9Ti–8.2Cr–4.1Co–2.5Mo–1.6Ta(–3.0Re)]. Reference Pyczak, Neumeier and Göken8 In Fig. 5 the averaged minimum creep rates for ERBOCo-Re0 and ERBOCo-Re1, respectively, are presented. Although the compositions of the Ni-base superalloys are not equivalent to those of the Co-base superalloys used in this work and the temperature as well as the applied stresses are slightly higher compared to the parameters used in this study, it becomes clear that while Re has a very strong effect on Ni-base superalloys it has a more or less negligible effect in Co-base superalloys.
Influence of Re on the minimum creep rate of Co- and Ni-base superalloys. The creep data of the Ni-base superalloys [nominal compositions in wt%: Ni–4.9Al–3.9Ti–8.2Cr–4.1Co–2.5Mo–1.6Ta(–3.0Re)] are taken from Ref. Reference Pyczak, Neumeier and Göken8.

Since it is known that Re has a slow diffusivity in fcc Co Reference Neumeier, Rehman, Neuner, Zenk, Michel, Schuwalow, Rogal, Drautz and Göken19 which is particularly beneficial for retarding diffusion controlled processes like dislocation climb at the γ/γ′ interface, a higher impact of Re could have been expected at such high creep temperatures. However, the small influence of Re in Co-base superalloys might be the consequence of several direct or indirect effects that are discussed in the following:
-
(i) One direct effect could be the lower partitioning of Re to the γ matrix, since the matrix composition strongly affects the diffusivity in that phase. To estimate to what extend the creep rates are influenced by Re, the effective diffusion coefficients within the γ solid solution phases were calculated according to Zhu et al. Reference Zhu, Basoalto, Warnken and Reed37 [see Eqs. (1)–(3)]:
 $${D^{{\rm{eff}}}} = D_0^{{\rm{eff}}}\exp \left\{ {{{ - {Q^{{\rm{eff}}}}} \over {{\rm{RT}}}}} \right\}\quad .$$
 $$D_0^{{\rm{eff}}} = {1 \over {\sum\limits_m {{{{x_m}} \over {D_0^{m,{\rm{Co}}}}}} }}\quad .$$
 $${Q^{{\rm{eff}}}} = {Q^{{\rm{Co}}}} + \sum\limits_m {{x_m}{Q^{m,{\rm{Co}}}}} \quad .$$
In this model
 $D_0^{{\rm{eff}}}$
is the harmonic mean of the atomic concentration x
m
(here the γ phase composition at 1050 °C) and the pre-exponential factor
 $D_0^{m,{\rm{Co}}}$
of a solute m in Co. The activation energy Q
eff is given by the activation energy for self-diffusion of co Q
Co and of the weighted average of the different solutes Q
m,Co.
All used pre-exponential factors and activation energies are taken from literature
Reference Neumeier, Rehman, Neuner, Zenk, Michel, Schuwalow, Rogal, Drautz and Göken19,Reference Wazzan38,Reference Bussmann, Herzig, Rempp, Maier and Mehrer39
and are listed in Table IV. The γ compositions from Table III were used for the calculation of
 $D_0^{{\rm{eff}}}$
.
Pre-exponential factors
 $D_0^{m,{\rm{Co}}}$
and activation energies Q
m,Co for the diffusion in Co for the calculation of the effective diffusion coefficient of the ERBOCo-Re0 and ERBOCo-Re1 alloys.

The effective diffusion coefficient
 $D_0^{{\rm{eff}}}$
at 1050 °C for ERBOCo-Re0 and ERBOCo-Re1 is calculated to be 1.0 × 10⁻¹⁹ m2/s and 4.9 × 10⁻²⁰ m2/s respectively. This means the effective diffusion coefficient was reduced by a factor of 2.1, which is mainly caused by the comparatively moderate partitioning of Re to the γ phase. Therefore the minimum creep rate of the Re-containing alloy should only be slightly lower than for its Re-free pendant. The same calculation was carried out for a Re-free and a Re-containing fully aged Ni-base superalloy crept at 1100 °C, resprectively.
Reference Pyczak, Neumeier and Göken8
The pre-exponential factors
 $D_0^{m,{\rm{Co}}}$
, the activation energies Q
m,Co for the diffusion in Ni, as well as the used γ composition of the standard heat treated alloys were taken from literature.
Reference Pyczak, Neumeier and Göken25,Reference Pröbstle, Neumeier, Feldner, Rettig, Helmer, Singer and Göken40
The calculated effective diffusion coefficient of the Re-free Ni-base superalloy is more than 60 times larger than the Re-containing variant. At the same time the minimum creep rate of Re-containing alloy (see Fig. 5) is more than two orders of magnitude smaller. In the work of Pröbstle et al.
Reference Pröbstle, Neumeier, Feldner, Rettig, Helmer, Singer and Göken40
the same effect was shown for a CMSX-4 alloy and a Re-free variant. Consequently, in Ni-base superalloys this effect can be attributed to the strong partitioning of Re to the γ phase. However, one has to consider that the low diffusivity of Re becomes more dominant the higher the temperature. At 1100 °C the effect of Re in Co-base superalloys might also be more pronounced than at 1050 °C. However, the effect would be still less distinct than in Ni-base superalloys.
-
(ii) The low diffusivity of Re in Co is due to the high vacancy formation energy (see Table V). However, due to the lower diffusion barrier of Re in Co compared to Ni, it is also conceivable that Re diffuses faster along the dislocation cores if pipe diffusion occurs and interfacial dislocation networks are present at the γ/γ′ interface. Reference Wollgramm, Buck, Neuking, Parsa, Schuwalow, Rogal, Drautz and Eggeler41 In consequence, Re could have a smaller impact on the diffusion-controlled climb of dislocations along the γ/γ′ interface when compared to its strong effect in Ni-base superalloys and thus it does not play such a dominant role in Co-base superalloys.
-
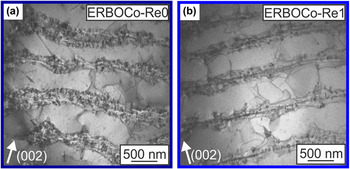
(iii) The deformation at high temperatures is not confined to the γ channels and the γ′ phase can be sheared more easily. This would mean that the diffusivity of Re in γ is less important and the energies of defects that formed in γ′ are more significant. However, the TEM micrographs in Fig. 6 show that—similarly to Ni-base superalloys—no frequent cutting of dislocations into the γ′ phase takes place at such high creep temperatures and low strains. This observation indicates that most of the deformation takes place primarily in the γ phase at the chosen creep conditions. Hence, this argument is not considered to be the reason for the observed results.
-
(iv) Due to the enrichment of Re in the γ phase of Ni-base superalloys its lattice parameter increases, giving rise to a higher absolute value of the negative lattice misfit. For the same reason, the positive lattice misfit in Co-base superalloys is reduced. As a consequence, the morphology of the γ′ precipitates in the alloy ERBOCo-Re0 is more cuboidal, whereas in ERBOCo-Re1 more rounded precipitates form [see Figs. 1(e) and 1(f)]. It is conceivable that these roundish precipitates in combination with the smaller coherency stresses could reduce the creep strength as well.
Diffusion barriers and vacancy formation energies for Co and Ni.

TEM micrographs after compression creep deformation to a plastic strain εpl of 0.5% at 1050 °C/125 MPa of the (a) ERBOCo-Re0 and (b) ERBOCo-Re1 alloys. The secondary γ′ precipitates in the γ channels appear during cooling and are not present during creep at 1050 °C.

Furthermore, the positive misfit produces tensile stresses which would probably accelerate diffusion whereas the compressive coherency stresses in the matrix of Ni-base alloys would even retard it. Reference Wollgramm, Buck, Neuking, Parsa, Schuwalow, Rogal, Drautz and Eggeler41 This effect might counteract the slow diffusivity of Re in Co.
-
(v) The microstructural analysis and APT results indicate that the γ′ volume fraction of the Re-containing sample is slightly lower, which could counterbalance a strengthening effect of Re. However, this influence alone is quite small and cannot explain the large difference of the minimum creep rate between Co-and Ni-base superalloys.
IV. CONCLUSIONS
Creep experiments show that Re only leads to a marginal improvement of the creep resistance in Co-base superalloys compared to multinary Ni-base superalloys. This is at least partly caused by the lower partitioning of Re to the γ phase as shown by APT measurements. In consequence the effective diffusion coefficient is only slightly reduced by Re and thus the minimum creep rate of the Re-containing alloy should only be slightly lower than that of the Re-free alloy. Further direct and indirect effects such as the smaller diffusion barrier of Re in Co, a slightly lower lattice misfit of the Re-containing alloy and a slightly lower γ′ volume fraction could contribute to this effect too. As shown by nanoindentation and micro-pillar compression tests, the hardness as well as the CRSS of the γ′ phase is increased due to a significant solubility of Re in the γ′ phase.
These observations suggest that Re is less beneficial in Co-base superalloys than in Ni-base superalloys, where Re significantly improves the high-temperature creep properties.
ACKNOWLEDGMENTS
The authors acknowledge funding by the Deutsche Forschungsgemeinschaft (DFG) through projects A4, A6, and B3 of the Collaborative Research Center SFB/TR 103 “From Atoms to Turbine Blades–a Scientific Approach for Developing the Next Generation of Single Crystal Superalloys”. The authors would like to thank Jan Philipp Liebig for milling the micro-pillars.