Introduction
The fall armyworm (FAW), Spodoptera frugiperda (J. E. Smith) (Lepidoptera: Noctuidae), is a polyphagous and highly destructive insect pest of economically important crops such as maize, rice, sorghum, cotton and vegetables (Pogue, Reference Pogue2002; Nagoshi et al., Reference Nagoshi, Adamczyk, Meagher, Gore and Jackson2007; Bueno et al., Reference Bueno, Carneiro, Bueno, Pratissoli, Fernandes and Vieira2010). It is native to tropical and subtropical regions of America and reported from various countries such as Brazil, Argentina and USA (Prowell et al., Reference Prowell, McMichael and Silvain2004; Clark et al., Reference Clark, Molina-Ochoa S, Martinelli, Skoda, Isenhour, Lee, Krumm and Foster2007). The host range of this insect pest is very wide and poses enormous crop losses, especially in tropical regions. In a recent host plant review of S. frugiperda, it was identified that larvae have the potential to consume 353 different plant species belonging to 76 botanical families (Montezano et al., Reference Montezano, Specht, Sosa-Gómez, Roque-Specht, Souza Silva, Peterson and Hunt2018), including crops, weeds, ornamental plants and seedlings in nurseries (Pogue, Reference Pogue2002; Montezano et al., Reference Montezano, Specht, Sosa-Gómez, Roque-Specht, Souza Silva, Peterson and Hunt2018). Severe losses to crops due to FAW were reported in the recent past from African countries (Goergen et al., Reference Goergen, Kumar, Sankung, Togola and Tamò2016). The incidence of FAW in Asia was reported for the first time from the Southern part of India by Sharanabasappa et al. (Reference Sharanabasappa, Kalleshwaraswamy, Asokan, Mahadeva Swamy, Maruthi, Pavithra, Hedge, Navi, Prabhu and Goergen2018); Ganiger et al. (Reference Ganiger, Yeshwanth, Muralimohan, Vinay, Kumar and Chandrashekara2018) and Shylesha et al. (Reference Shylesha, Jalali, Gupta, Varshney, Venkatesan, Shetty, Ojha, Ganiger, Navik, Subaharan, Bakthavatsalam and Ballal2018) in the year 2018. The occurrence of S. frugiperda in southern India was reported in May 2018, and subsequently in July–August, it was noticed to cause severe damage in various districts of south Indian states. After that, this insect pest has been widely reported from various parts of southern and northern India (Swamy et al., Reference Swamy, Asokan, Kalleshwaraswamy, Sharanabasappa, Prasad, Maruthi, Shashank, Devi, Anusha, Adarsha, Srinivas, Rao Srinivasa, Vidyasekhar, Shali, Shyam Sunder Reddy and Nagesh2018; Rakshit et al., Reference Rakshit, Ballal, Prasad, Sekhar, Lakshmi Soujanya, Suby, Jat, Siva Kumar and Prasad2019).
To develop any pest management programme for a specific agro-ecosystem, information on the abundance and distribution of pest in relation to weather parameters is a basic requirement (Patel and Shekh, Reference Patel and Shekh2006). The incidence of insect pests is driven by various environmental factors and temperature is a key abiotic factor influencing survival and reproduction rates in insects (Bale et al., Reference Bale, Masters, Hodkinson, Awmack, Bezemer, Brown, Butterfield, Buse, Coulson and Farrar2002). Hence, temperature strongly determines the pest's demographic parameters, which are essential for interpreting population dynamics, developmental rates and seasonal occurrence (McCornack et al., Reference McCornack, Ragsdale and Venette2004). Detailed knowledge on temperature effects on herbivore insect pests can be used to determine the range where the pest might develop (establish) and to predict the population's growth potential (i.e. intrinsic rate of increase) and dynamics. Each pest management programme requires authentic determination of the pest's population parameters (Zamani et al., Reference Zamani, Talebi, Fathipour and Baniameri2006). The ability of an insect to develop at different temperatures is an important adaptation to survive in various climatic conditions, and its understanding is important for predicting pest outbreaks (Gilbert and Raworth, Reference Gilbert and Raworth1996). The relationship between the aspects of an insect life-history (development, survival, reproduction, etc.) and environmental variables (temperature) can be well described by process-based phenology models. These models use non-linear equations of higher biological significance for stochastic simulation of developmental time variability within populations, based on comprehensive laboratory evaluation of life table parameters. So, phenology models based on the deductive method are detailed mathematical simulation models that consider primary physiological parameters of insect development, survival and reproduction and thus, these models can predict a high-quality result on future pest dynamics (Wagner et al., Reference Wagner, Wu, Sharpe and Coulson1984; Choudhary et al., Reference Choudhary, Mali, Mukherjee, Kumari, Moanaro Rao, Das, Singh and Bhatt2019).
The pest forecasting models facilitate better preparedness to combat outbreaks of serious insect pests by developing effective pest management strategies well in advance. The Insect Life Cycle Modelling (ILCYM) software version 3.0 developed by the International Potato Centre (Tonnang et al., Reference Tonnang, Juarez, Carhuapoma, Gonzales, Mendoza, Sporleder, Simon and Kroschel2013) has been used to predict climatically suitable areas for distribution, abundance and damage activity, and to examine the impact of climate change on future pest status of insects of economically important crops. With this background, we aimed at developing an inclusive temperature-dependent process-based phenology growth model for S. frugiperda, to predict its population growth potential in different agroecological regions of India due to future changes, temperature conditions and further simulation data generated from ILCYM software were adopted for the development of future pest risk maps using ArcGIS environment.
Materials and methods
Insect culture
During the rainy seasons of 2018 and 2019, egg masses and larval population of ‘R’ type S. frugiperda were collected from the maize fields of Hayathnagar Research Farm of ICAR-Central Research Institute for Dryland Agriculture (CRIDA), Hyderabad (17.32°N, 78.59°E, Alt. 566 m), Telangana, India. The larvae got identified and confirmed as ‘R’ type S. frugiperda (Swamy et al., Reference Swamy, Asokan, Kalleshwaraswamy, Sharanabasappa, Prasad, Maruthi, Shashank, Devi, Anusha, Adarsha, Srinivas, Rao Srinivasa, Vidyasekhar, Shali, Shyam Sunder Reddy and Nagesh2018). Mass rearing of S. frugiperda for further experiments base culture was maintained on maize leaves in glass jars (15 cm × 10 cm) at room temperature and 65 ± 5% RH under natural photoperiod conditions in the insectary of Entomology laboratory of our institute. Fresh maize leaves were provided as diet daily until pupation. The late instars larvae were transferred to pupation jars containing a 2–3 cm layer of moist sterilized sand covered with filter paper. Just after emergence, the adults were shifted in oviposition jars lined with filter paper on the inner side to facilitate egg laying. The jars were covered with clean black muslin cloth tied and closed gently. The adults were fed by introducing cotton swabs immersed in honey solution.
Experiments on life tables were conducted at six constant temperatures (15, 20, 25, 27, 30 and 35°C) and on fluctuating temperature environment inside the growth chambers (I 36LL; Percival Scientific, Inc. Perry, USA) at 75 ± 5% relative humidity with a photoperiod ratio of 14:10 (14 h of light:10 h of dark). The data obtained from these experiments were used to develop a temperature-dependent phenology model for S. frugiperda. The daily temperature fluctuations in growth chambers were programmed at half-hourly intervals to ramp between 19.2 and 32.5°C every 24 h for generating life cycle data of S. frugiperda. The daily temperature fluctuations range was selected by averaging the half-hourly temperature records for the season obtained from Automatic Weather Station at ICAR-CRIDA, Hyderabad where insect species prevails (average of previous 2 years). It represented the average half-hourly temperatures covering the low, moderate and high temperature ranges for FAW development. To confirm the final temperature conditions, HOBO loggers were placed inside the cabinets, which automatically measured temperature at 30 min intervals for the duration of experiments. The data obtained from this experiment were used to validate the temperature-dependent phenology model developed for S. frugiperda at constant temperatures.
The effects of temperatures on the biology of S. frugiperda were studied in cohorts of single life stages (Sporleder et al., Reference Sporleder, Kroschel, Gutierrez Quispe and Lagnaoui2004; Tonnang et al., Reference Tonnang, Juarez, Carhuapoma, Gonzales, Mendoza, Sporleder, Simon and Kroschel2013). Each life stage of S. frugiperda was maintained and evaluated at six constant temperature environments between 15 and 35°C. In order to construct life tables, a group of newly laid eggs of S. frugiperda were placed on a piece of wet filter paper in Petri dish (75 × 10 mm) and kept inside the growth chambers for incubation at respective temperatures so as to observe at least 300 individual eggs at each test constant temperature. The number of hatched eggs and incubation period were recorded daily. A total of 200 neonate larvae were collected and reared individually in Petri dishes (75 × 10 mm) till the pupal stage at each constant temperature. Larvae were fed daily with green and tender maize leaves collected from fields. The development time and mortality of larvae during each instar and the number of formed pupae were recorded daily. The late larval instars were transferred into pupation jars as mentioned above. The pupae were kept individually after separating from the sand by gentle sifting into separate test tubes (10 × 4 cm diameter). A total of 100 individual pupae in test tubes were placed in test tube stands and kept inside the growth chambers for incubation at respective temperatures. The adult emergence was recorded daily. The newly emerged adults were paired and kept in oviposition jars (20 × 10 cm diameter) and lined with filter paper on the inner side to facilitate egg laying and these jars were covered with a black muslin cloth. A total of 20 individual females and males were evaluated at each test temperature. The adults were fed on water and honey solution (4:1 v/v) soaked on a cotton swab and differentiated into male and female. The moths were transferred 1:2 (male: female) to new jars each morning throughout the entire oviposition period of females. Egg masses were kept date wise for each female till hatching. The daily numbers of hatched and unhatched eggs were counted from each jar to calculate total fecundity per female. The survival time (longevity) was recorded for individual males and females till the death of the last adult moth.
Simulation tools and phenology model parameterization
The ILCYM software version 3.0, developed by the International Potato Centre, Lima, Peru (https://research.cip.cgiar.org/confluence/displayilcym/Downloads; Tonnang et al., Reference Tonnang, Juarez, Carhuapoma, Gonzales, Mendoza, Sporleder, Simon and Kroschel2013) was used for the building of process-based temperature-driven and age-stage structured S. frugiperda phenology model.
Developmental times and its distribution
The cumulative frequencies of development times of each life stage and temperatures were plotted against normalized developmental times by fitting a normal (Logit) distribution curve for all immature stages and males and a complementary log-log (CLL) distribution curve for females. The mathematical expressions of distribution function are given below (Tonnang et al., Reference Tonnang, Juarez, Carhuapoma, Gonzales, Mendoza, Sporleder, Simon and Kroschel2013):

where F(x) is the probability to complete development at time x, lnx is the natural logarithm of the days observed, a is the intercept corresponding to temperature i, and b is the common slope of the regression model.

where F(x) is the probability to complete development at time x, lnx is the natural logarithm of the days observed, a is the intercept corresponding to temperature i, and b is the common slope of the regression model.
Developmental rate
The inverse of durations of immature development and adult survival (1/days) were taken as rates of development and survival, respectively. The non-linear regression model was fitted to establish the relationship between development rate and temperature (Zajac et al., Reference Zajac, Hall and Wilson1989). The modified Sharpe and DeMichele model was selected among 59 models and found to be best fitted on the basis of high multiple coefficient of determination (R 2) and Akaike's Information Criterion (AIC) for estimating rates of eggs, larval and pupal development of S. frugiperda at various constant temperatures (Sharpe et al., Reference Sharpe, Curry and DeMichele1977). In addition to these two criteria, these models are also found fit on the basis of the lowest residual sum of squares (RSS; Shi et al., Reference Shi, Reddy, Chen and Ge2015; Ratkowsky and Reddy, Reference Ratkowsky and Reddy2017; Milosavljević et al., Reference Milosavljević, McCalla, Ratkowsky and Hoddle2019). The theoretical lower development threshold temperatures were estimated from the slope and intercepts of the linear regressions (LTT = intercept/slope). Based on these thresholds, the thermal constants for the development were determined and expressed in degree days (DD = 1/slope). Development rates at temperatures which deviated from rectilinearity were considered as outliers with large residuals. Outlier observations were identified using the Cook's D metric when critical values of Cook's D had >4/n (n = number of observations) (Bollen and Jackman, Reference Bollen and Jackman1990; Milosavljević et al., Reference Milosavljević, McCalla, Ratkowsky and Hoddle2019). For the model fitting, temperatures of 15°C for eggs, 35°C for larvae and pupae, and 15 and 35°C for adult stages were excluded in analyses because these data points were not aligned with the linear portion of the dataset.
Immature stages mortality and adult duration period or longevity
The immature stages mortality of S. frugiperda at various constant temperatures was fitted with Wang model (Wang et al., Reference Wang, Lan and Ding1982). The adult senescence of S. frugiperda at various constant temperatures was determined by fitting an exponential equation (Stinner et al., Reference Stinner, Gutierrez and Butler1974).
Temperature-dependent reproduction
The oviposition was modelled considering the three temperature-dependent functions: temperature-dependent total fecundity, age-related oviposition frequency and age-specific adult survival. A non-linear regression model (Janisch and Analytis) was fitted to find out the effects of various constant temperatures on the total number of eggs produced by a female adult during its whole life span (Kim and Lee, Reference Kim and Lee2003). The relationship between cumulative oviposition rate and female age was well described by the γ function. The best-fit models were selected based on AIC and multiple coefficient of determination (R 2), well-known goodness of fit indicators (Soh et al., Reference Soh, Kekeunou, Nanga Nanga, Dongmo and Rachid2018).
Estimation of life table parameters at constant temperatures
Using ‘stochastic simulation tool’ in ILCYM which is based on rate summation and cohort up-dating approach (Curry et al., Reference Curry, Fieldman and Smith1978), the life table parameters viz., gross reproductive rate (GRR), net reproductive rate (R o), intrinsic rate of natural increase (r m), finite rate of increase (ƛ), mean generation time (T) and doubling time (D t) were estimated. The process utilized the thermal reaction norms developed for S. frugiperda life stages at six constant temperatures (15–35°C) for estimating the life table parameters (Tonnang et al., Reference Tonnang, Juarez, Carhuapoma, Gonzales, Mendoza, Sporleder, Simon and Kroschel2013). The estimates were based on the developed phenology model at six constant temperatures ranging from 15 to 35°C with five repetitions each while considering 100 individuals and 365 days. The estimated life table parameters were plotted against respective temperatures and fitted to a polynomial equation [L(T) = a + bT + cT 2, where L(T) is the respective life table parameter at temperature (T)].
Comparison of life tables at constant and fluctuating temperatures
The life table data on S. frugiperda obtained from fluctuating temperature experiment were compared with model outputs produced using stochastic simulation at constant temperatures. The stochastic simulation based on rate summation and cohort updating approach (Curry et al., Reference Curry, Fieldman and Smith1978) was used in simulating life-history parameters on constant temperatures. The values for immature development, survival and life history parameters were simulated and compared with observed values obtained using fluctuating temperature experiments. The stable age-stage distribution of cohort individuals in a population was plotted. The differences between the predicted and observed life table values of S. frugiperda were used as a measure for the validity of the model, the significance of which was tested based on P value. Differences were considered significant if the value of P deviated from zero.
Estimation of establishment and distribution risk of S. frugiperda
Using simulated life table parameters and climatic data (temperature), we counted the establishment risk index (ERI), generation index (GI) and activity index (AI) of FAW for present and future time periods (during 2050–2070) (Kroschel et al., Reference Kroschel, Sporleder, Tonnang, Juarez, Carhuapoma and Gonzales2013; Tonnang et al., Reference Tonnang, Juarez, Carhuapoma, Gonzales, Mendoza, Sporleder, Simon and Kroschel2013). For the assessment of the potential distribution and abundance of FAW insect pest in the region, the life table parameter values were used to calculate the three pest risk indices (ERI, GI and AI) at each data point in the ILCYM programme (Kroschel et al., Reference Kroschel, Sporleder, Tonnang, Juarez, Carhuapoma and Gonzales2013).
Temperature data for calculation of risk indices
The high-level spatial resolution data, ~4.6 km (2.5 arc min) temperature data used in the present study for present (near to current) and future scenarios were downloaded from WorldClim database (ver. 1.4; http://www.worldclim.org/) (Hijmans et al., Reference Hijmans, Cameron, Parra, Jones and Jarvis2005). Monthly mean of minimum and maximum temperatures interpolated from historical temperature records from 1960 to 2000 periods. Future temperature data (years 2050 and 2070) in the present study were used from the ensemble of eight general circulation models (GCMs) (BCC-CSM1-1; GISS-ER-R; HADGEM2-AO; HadGEM2-ES; IPSL-CM5A-MR; MIROC-ESM-CHEM; MRI-CGCM3; Nor-ESM1-M) and four greenhouse gas concentration trajectories scenarios (RCP 2.6, RCP 4.5, RCP 6.0, RCP 8.5) as proposed in the Fifth Assessment of the Intergovernmental Panel for Climate Change to reduce GCM and scenario-based uncertainties (CMIP5) (Moss et al., Reference Moss, Jae, Kathy, Martin, Steven, Detlef, Timothy, Emori, Kainuma, Kram, Gerald, John, Nakicenovic, Riahi, Steven, Ronald, Allison, John and Thomas2010). A simple arithmetic average of the ensemble members with equal weight is generally more reliable over a single model approach (Her et al., Reference Her, Yoo, Seong, Jeong, Cho and Hwang2016; Kim et al., Reference Kim, Ivanov and Fatichi2016; Ahmed et al., Reference Ahmed, Sachindra, Shahid, Demirel M and Chung2019). Therefore, in the present study, we used an arithmetic average ensemble of eight GCMs. Ensembling of monthly temperatures data was done in ArcGIS environment. The region masking and data format conversions were done in ArcGIS™ (ver. 10.4) environment.
Spatial mapping of risk indices
The risk indices thus estimated were employed in the ‘potential population analysis and mapping’ module of ILCYM for visualizing the risk maps using simulated life table data and temperature data. The generated ASCII files of risk indices (ERI, AI and GI) from ILCYM for present and future predictions were imported into ArcGIS and converted into a polygon-based classified geo-referenced data set under different risk levels of S. frugiperda in India. The ERI (value ranges from 0 to 1) is used for the identification of the region where insect pest is having the risk of survival and establishment region. GI denotes the mean number of generations produced by S. frugiperda in a year. The AI explains the temperature-driven population increase and an increase in the value of AI by one indicates a tenfold increase in pest population in an area assuming restrictions of biotic and abiotic factors.
Statistical analysis and modelling tools
All analyses for developing a temperature-dependent phenology model were conducted using ‘model builder’ tool in ILCYM software, version 3.0. Among the models and sub-models, the best-fit models were selected based on AIC and multiple coefficient of determination (R 2), well-known goodness of fit indicators (Soh et al., Reference Soh, Kekeunou, Nanga Nanga, Dongmo and Rachid2018). Analysis of Variance (ANOVA) and Least Square Design (LSD) tests were used to compare the means at probability level P = 0.05.
Results
Effects of temperature on development time
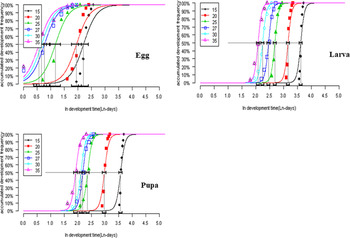
Development durations of different immature and adult stages of S. frugiperda at different constant temperatures are presented in table 1. The temperatures within the evaluation range have a great influence on the development of the immature life stages of S. frugiperda. Logit and CLL distribution models were best fitted against accumulated development frequency and normalized development time of insect pest. Models were selected based on the highest coefficient of determination (R 2) and the lowest RSS and AIC values (fig. 1). Results indicated that the duration of the immature stages decreased significantly with increasing temperatures within the temperature range of 15–35°C (table 1). The observed mean development (days) of all the immature life stages was lower at 35°C (egg: 2 ± 0.18; larva: 9 ± 0.24; pupa: 7 ± 0.28), and higher at 15°C (egg: 10.0 ± 0.22; larva: 38.0 ± 0.31; pupa: 36.0 ± 0.47). The developmental duration of adult stages decreased linearly from low (15°C: female = 39.0, male = 37.0) to high (35°C: female = 7.0, male = 5.0) temperatures within the evaluation range.
Mean development time (days ± SE) of immature and adult life stages of S. frugiperda at different constant temperatures (fitted function: logit for egg, larva, pupa and male; cloglog for female)

Temperature-dependent developmental times (Ln/days) for immature stages of S. frugiperda at different temperatures. Egg (a): larva (b): and pupa (c). Fitted curves: logit model for all immature stages.

Effects of temperature on development rate
Development rate as a function of temperature increased for all the immature stages (egg, larva and pupa) until tested 35°C temperature. Temperature-dependent non-linear equations of development rates of immature stages were fitted with the modified version of Sharpe and DeMichele models (table 2; fig. 2). The thermal reaction norms were well fitted by the modified Sharpe and DeMichele model as indicated by the smallest value of AIC (3.24 and −22.31), RSS (0.0817 and 0.066) and higher value of R 2 (0.87 and 0.96) for egg and pupa stage of S. frugiperda, respectively (table 2). The estimated lower developmental threshold temperatures were 12.1°C for eggs, 11°C for larvae, 12.2°C for pupae, 15.13°C for males and 12.66°C for females. DD requirements for the development of the different stages of S. frugiperda were 50, 250 and 200 DD for egg, larva and pupa, respectively.
Parameter values of the functions used for simulation of temperature-dependent phenology of S. frugiperda

Temperature-dependent developmental rates (1/day) for immature stages of S. frugiperda. Egg (a): larva (b): and pupa (c) fitted with modified Sharpe & DeMichele model. The bold solid line is the selected model output and dashed lines above and below represents the upper and lower 95% confidence bands. Bars represent standard deviation of the mean.

Mortality and senescence of S. frugiperda at constant temperatures
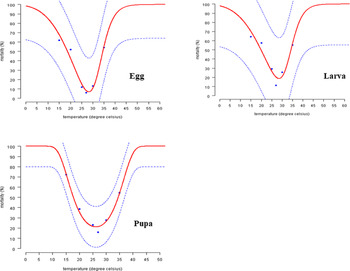
Mortality of immature stages of S. frugiperda varied drastically at different temperatures and Wang model fitted well with immature stage mortality (fig. 3). The highest mortality (egg: 64.4%; larva: 62%; pupa: 72.3%) was observed at tested lowest (15°C) and highest (35°C) (egg: 54%; larva: 55.4%; pupa: 54.3%) temperature constants while lowest (egg: 6%; larva:11.1%; pupa: 15.9%) at 27°C for all immature stages of S. frugiperda. (ANOVA: for immature stages mortality at 15°C, P < 0.05; df: (2, 3); F statistics: egg = 14.66; larva = 6.46; pupa = 34.33). The senescence rate for both the female and the male adults increased sharply from low to high temperatures and maximum senescence was observed at 35°C. Exponential simple model provided a good fit to the observed mean senescence rates for both females and males (table 2).
Temperature-dependent mortality for immature stages of S. frugiperda. Egg (a): larva (b): and pupa (c) fitted curves with Wang model.

Temperature-dependent reproduction
The results revealed significant effects of temperature on the period of S. frugiperda. The effects of temperature on fecundity predicted higher fecundity at 30°C (1076.42 eggs/female) and relatively low fecundity at 15°C (229.33 eggs/female). The model predicted the favourable temperature range for S. frugiperda oviposition to be between 27 and 30°C and thereafter showed a negative relationship with temperature (ANOVA: for oviposition, P < 0.05; df: (2, 3); F statistics: oviposition = 129.33).
Simulated life table parameters at constant temperatures
Finite (λ) and intrinsic rates of increase (r m), net reproductive rate (R o), mean generation time (T) and doubling time (DT) of S. frugiperda varied significantly with temperature variation (table 3). Net reproductive rate, intrinsic rate of increase, finite rate of increase and egg production increase with the increasing temperature, but these parameters decrease with the increasing temperature when the temperature exceeds 30°C. The results revealed that maximum net reproductive rate (215.66 females/female/generation) and total fecundity (981.08 individuals/female/generation) were attained at 30°C constant temperature. The mean length of generations decreased from 74.29 days at 15°C to 38.74 days at 30°C. The maximum intrinsic rate of increase (0.138 females/female/ day) and shortest doubling time (4.9 days) were also observed at 30°C. Results of simulated life table parameters showed high temperature-dependent development of S. frugiperda and completes development within all the tested constant temperature ranges (15–35°C). The intrinsic rate of increase (r m) and finite rate of increase (λ) are elevated with an increase in temperature from 15 to 30 °C. Intrinsic rate of increase (r m) varied from 0.015 (15°C) to 0.138 females/female/day (30°C). The estimated life table parameters were plotted against the respective temperatures and fitted to a quadratic equation (fig. 4). The reduction of ‘T’ was noticed from a maximum value of 74.29 days at 15°C to a minimum of 38.74 days at 30°C and finite rate of increase (λ), which is the indicator of reproductive potential of new egg, was highest at 30°C and thereafter showed a negative relationship with temperature (fig. 4). Life table parameters predicted temperatures between 25 and 30°C as a favourable range for S. frugiperda development, survival and reproduction with shorter generation length and high reproductive potential (fig. 4). The shorter T and higher r m shortened the population doubling time of S. frugiperda to 4.9 days at 30°C compared to 44.74 days at 15°C (table 3).
Estimated life table parameters of S. frugiperda at different constant temperatures and fluctuating temperature

Life table parameters of S. frugiperda estimated at six constant temperatures. Intrinsic rate of natural increase (a), net reproduction rate (b), gross reproductive rate (c), mean generation time (d), finite rate of increase (e), and doubling time (f).

Validation of phenology models
The life cycle parameters of S. frugiperda generated under fluctuating temperature (19.2–32.5°C) experiment were validated with life table parameters obtained from temperature simulations. The phenology models fitted for immature life stages under constant temperature predictions were non-significant (P < 0.05) compared to the fluctuating temperatures (fig. 5; table 3).
Model validation. Observed and simulated life stage frequencies of S. frugiperda. Dots represent observed data points at fluctuating experiments, and the lines represent developmental frequencies simulated at fluctuating temperatures based on thermal reaction norms for constant temperatures.

Changes of establishment and distribution of S. frugiperda in present and future climate change periods
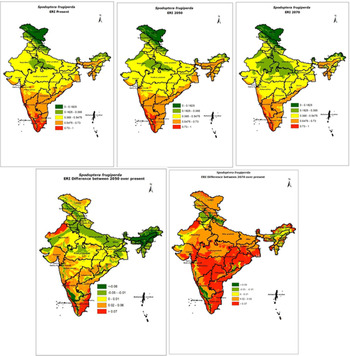
The area suitability for the establishment of S. frugiperda in India was visualized using ArcGIS for current (baseline worldclim climate data for the year 2000) and future projections based on the ensemble of eight GCMs (2050 and 2070) (fig. 6). Southern states of India including Kerala, part of Tamil Nadu and Karnataka and some coastal parts of Maharashtra were predicted to have high ERI (>0.7) indicating that a certain proportion of S. frugiperda population would establish and survive throughout the year in these areas (fig. 6). Highly suitable areas of coastal Maharashtra and Odisha for the establishment of S. frugiperda are expected to be reduced as moderately suitable (0.5–0.7 ERI) in the years 2050 and 2070 (fig. 6). The ERI values below 0.5 indicate the low probability of permanent establishment of S. frugiperda. The ERI findings show that the major changes in the establishment risk would happen in central, eastern and southern parts of India where major area is projected to slightly increase in the risk of establishments during 2050 and 2070 over current periods.
Change in abundance and damage potential of S. frugiperda in India based on establishment risk index (ERI) for (a) present, (b) 2050, (c) 2070, (d) difference between the present and 2050, (e) difference between present and 2070.

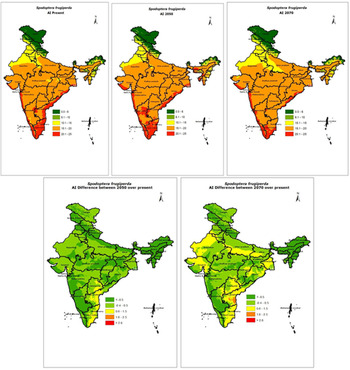
The potential activity of S. frugiperda in India under the current and future climatic conditions is depicted in fig. 7. Under the future climatic conditions, hot semi-arid and hot sub-humid regions of Southern states and East and Western coastal areas are predicted to be optimal for population abundance (AI of 0.6–1.5). Major parts of India including Northern plains, Deccan plateau and Eastern region are predicted to have more potential activity of S. frugiperda.
Change in abundance and damage potential of S. frugiperda in India based on activity index (AI) for (a) present, (b) 2050, (c) 2070, (d) difference between the present and 2050, (e) difference between present and 2070.

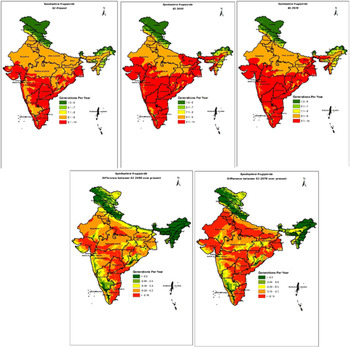
The total number of generations that can be completed by S. frugiperda in a year as indicated by GI in the future (2050 and 2070) climate change scenarios is visualized in fig. 8. The generation indices are directly correlated with the abundance and potential infestation of S. frugiperda under field conditions. Ensemble model has predicted 8–14 generations of S. frugiperda in a year in a major portion of India. The Himalayan region area and its ranges from north to north-eastern regions are predicted to have 1–6 generations in a year under current climatic conditions. Under future climate change scenarios (2050 and 2070), maximum regions of India, except Northern Himalayan and top of north-eastern states, are predicted with more than nine generations of S. frugiperda in a year (fig. 8).
Change in abundance and damage potential of S. frugiperda in India based on generation index (GI) for (a) present, (b) 2050, (c) 2070, (d) difference between the present and 2050, (e) difference between present and 2070.

Discussion
FAW (S. frugiperda) is a new invasive insect pest and was noticed for the first time in southern parts of the country. Understanding biology and the population dynamics of S. frugiperda would help in formulating and developing better and efficient management measures. Life table parameters and occurrence of phenology events of S. frugiperda are the most important aspects for understanding the ecology of this pest. Thus, the present study was the first to develop a process-based phenology model, which is the combination of several non-linear models to predict the temperature-dependent population growth potential of S. frugiperda. Non-linear models are superior to linear models for modelling insect development as they incorporate readily interpretable parameters of biological relevance, can be fit to development data derived over broad temperature ranges, and can provide estimates of optimum and upper temperature developmental thresholds (Shi and Ge, Reference Shi and Ge2010). We evaluated the effects of ecologically relevant range of daily temperature fluctuations compared with the effects of constant temperatures in a regime of 15–35°C on the development, survival and reproduction of S. frugiperda. We have considered the whole life history for estimating S. frugiperda population growth potential at various temperatures. Our study revealed that the developmental time of S. frugiperda decreased with the increase in temperature up to 35°C. The embryonic development of the FAW was 10 days at 15°C and 2 days at 35°C. These findings are in agreement with those of Heinrichs et al. (Reference Heinrichs, Foster, Rice and Molina2000) and Du Plessis et al. (Reference Du Plessis, Schlemmer and Van den Berg2020). The larval developmental period recorded as 38 days at 15°C and 9 days at 35°C in the current study was in the proximity of larval development times reported by Du Plessis et al. (Reference Du Plessis, Schlemmer and Van den Berg2020) which were 34.39 days at 18°C and 10.45 days at 32°C and shorter than those reported by Busato et al. (Reference Busato, Grützmacher, Garcia, Giolo, Zotti and Bandeira2005) which were 41.9 days at 18°C and 11.1 days at 32°C. The pupal period was 36 days at 15°C and it decreased to 7 days at 35°C. Pupae kept at 15 and 35°C by Simmons (Reference Simmons1993) took approximately 37.2 and 5.6 days, respectively, to complete the pupal period. The developmental durations of immature stages of S. frugiperda reported in the present study were slightly different from the reports of earlier authors and might be due to the fact that the life-history traits may differ among the population of different geographical regions (Tsoukanas et al., Reference Tsoukanas, Papadopoulos, Fantinou and Papadoulis2006), rearing techniques and diet.
When the temperature increased, the duration of each phase decreased, showing a life cycle of 25 days at 35°C and 46.5 days at 25°C. Temperature is another strong factor in the biology of the species and in the case of S. frugiperda, as most of the lepidopteran species, when temperature increased, the duration of each phase decreased, showing a life cycle of 26.8 days at 35.3°C and 43.5 days at 25°C (Clavijo et al., Reference Clavijo, Fernández, Ramírez, Delgado and Lathullerie1991). A similar trend in the developmental durations of S. frugiperda immature stages at different constant temperatures was also observed by Ali et al. (Reference Ali, Luttrell and Schneider1990) and Du Plessis et al. (Reference Du Plessis, Schlemmer and Van den Berg2020). It is well known that among various abiotic factors, temperature plays a vital role on different life-history traits; including development time, longevity and fecundity of insect pests. Thus, reduction of longevity or duration of an insect with an increase in temperature occurs due to the accelerated use of energy (Choudhary et al., Reference Choudhary, Mali, Naaz, Mukherjee, Moanaro Das, Singh, Srinivasa Rao and Bhatt2020) and a similar trend was observed in our study. The temperatures within the evaluation range (15–35°C) had a large impact on the development durations of S. frugiperda life stages. The mean development time (days) of each stage and total life span decreased by 96 days from 15 to 30°C temperature. A similar decrease in development period with an increase in constant temperatures was reported in case of other lepidopteran insect pests such as Helicoverpa armigera (Jallow and Matsumura, Reference Jallow and Matsumura2001), Cnaphalocrocis medinalis (Padmavathi et al., Reference Padmavathi, Katti, Sailaja, Padmakumari, Jhansilakshmi, Prabhakar and Prasad2013), Elasmopalpus lignosellus (Hardev et al., Reference Hardev, Sandhu Garegg, Nueddly Susan, Webb Ronald and Cherry Robert Gilbert2013) and S. litura (Srinivasa Rao et al., Reference Srinivasa Rao, Manimanjari, Rama Rao, Swathi and Maheswari2014; Fand et al., Reference Fand, Sul, Bal and Minhas2015; Srinivasa Rao and Prasad, Reference Srinivasa Rao and Prasad2020).
The development rate of S. frugiperda eggs, larvae and pupae increased linearly with temperatures increasing from 15 to 35°C. Similarly, Ali et al. (Reference Ali, Luttrell and Schneider1990) and Du Plessis et al. (Reference Du Plessis, Schlemmer and Van den Berg2020) observed a linear increase in development rate with an increase in temperatures. The highest mortality was observed at tested lowest (15°C) and highest (35°C) temperature constants while lowest at 27 and 30°C for all immature stages of S. frugiperda. Similarly, Barfield et al. (Reference Barfield, Mitchell and Poe1978) also reported S. frugiperda larval mortality to be higher at 18 and 37°C than at 26.7°C. A similar trend was noted with the mean senescence times/longevities of adults also were found to be linear.
In the present study, the estimated lower development threshold temperature was 12.1°C for eggs which is near the thresholds estimated by Ali et al. (Reference Ali, Luttrell and Schneider1990) (12.69°C), Du Plessis et al. (Reference Du Plessis, Schlemmer and Van den Berg2020) (13.01°C) and Hogg et al. (Reference Hogg, Pitre and Anderson1982) (13.4°C). Knowledge of the temperature thresholds of insects is important for predicting their potential distribution (Cammell and Knight, Reference Cammell and Knight1992; Marco et al., Reference Marco, Taberner and Castañera1997). The respective developmental stages have specific temperature requirements, which is important for survival in specific environments (Marco et al., Reference Marco, Taberner and Castañera1997). DD requirements for the development of the different stages of S. frugiperda were 50, 250 and 200 DD for egg, larva and pupa, respectively. Du Plessis et al. (Reference Du Plessis, Schlemmer and Van den Berg2020) reported DD requirements for S. frugiperda larval development as 202.67 and 150.29 DD for pupa. However, differences in the DD requirement of larval and pupal stages were higher in the present study and it might be due to the changes in the diet of larvae as reported by Ali et al. (Reference Ali, Luttrell and Schneider1990). Larvae reared on cotton leaves required 37% more DD to complete their development than larvae that were reared on an artificial diet or maize (Ali et al., Reference Ali, Luttrell and Schneider1990). Knowing the thermal requirements of an insect can aid interpretation of its present geographical distribution and in predicting its future distribution (Hance et al., Reference Hance, van Baaren, Vernon and Boivin2007).
The temperature influenced significantly the reproductive traits in S. frugiperda in the present study. The developed phenology model predicted temperatures between 27 and 30°C as the favourable range for S. frugiperda development, survival and reproduction. It was reported that S. frugiperda is capable of withstanding temperatures between 15 to 35°C, and favoured temperatures were between 20 and 30°C (Clavijo et al., Reference Clavijo, Fernández, Ramírez, Delgado and Lathullerie1991). This demonstrates that the prevalence of optimum temperature can play a bigger role in determining the suitability of climate for the mating and oviposition of S. frugiperda adults. This study presents only the effect of temperature on S. frugiperda infestation of fecundity on maize. However, fecundity is also influenced by several other factors such as host nutritional quality, food availability, nutrition of immature stages, and abiotic factors such as light intensity, relative humidity, etc. (Shahout et al., Reference Shahout, Xu, Yao and Jia2011; Patil et al., Reference Patil, Mehta and Jat2014; Choudhary et al., Reference Choudhary, Mali, Naaz, Mukherjee, Moanaro Das, Singh, Srinivasa Rao and Bhatt2020).
We noted that the ‘R o’ of S. frugiperda was higher at 30°C temperature by recording maximum offspring and ‘R o’ decreased with an increase in temperature and a similar trend was reported by Guang et al. (Reference Guang, Cheng and Zhang2000). The present results revealed that the association between temperature and life table parameters was non-linear. Many empirical models by incorporating ‘r m’ as a key parameter were used for the prediction of population dynamics of insect pests. A similar approach of using laboratory measurements of temperature was adopted by Tshiala et al. (Reference Tshiala, Botaim and Olwoch2012) to model the empirical relationship between life table parameters and temperature and assessed the impact of climate change on leaf miner. Temperature-driven phenology models developed using laboratory information can be used for the projection of the status of the future insect population (Vincent et al., Reference Vincent, Jones Carrie, Lois and Caprio1997).
We quantified the relationship between life table parameters and temperature variations and further used it for predicting the pest population under present and future climate change scenarios. According to the model predictions, ERI, AI and GI are expected to be higher during future climate change periods of 2050 and 2070 compared to the present climate conditions (figs 6–8). Southern states of India including Kerala, part of Tamil Nadu and Karnataka and some coastal parts of Maharashtra are predicted to have high ERI (>0.7) with a more potential abundance of pest (AI > 20) indicating that these areas would expect to have the high proportion of FAW population in future climate change scenarios (2050 and 2070). Results of the present study showed that the values of risk indices (establishment, abundance and generations) significantly vary between locations, scenarios, GCMs and time periods. Variation in the number of generations due to geographical locations, time periods and GCMs was well understood by various previous studies such as Srinivasa Rao et al. (Reference Srinivasa Rao, Dammua, Sengottaiyan, Ongolua, Biradara, Kondrua, Srinivas, Murali, Rama Rao and Srinivasa Rao2016) predicting the spread of H. armigera Hubner on pigeon pea and Choudhary et al. (Reference Choudhary, Mali, Mukherjee, Kumari, Moanaro Rao, Das, Singh and Bhatt2019) predicting the spread of Bactrocera species on mango for Indian region. Since, it is well known that insects being a poikilothermic organism, temperature acts as a major factor to govern the insect phenology. The distant geographical locations have variations in temperature which will lead to variation in risk indices as indicated in the present study (Choudhary et al., Reference Choudhary, Mali, Mukherjee, Kumari, Moanaro Rao, Das, Singh and Bhatt2019). The present predictions are based on the effects of only temperature, a key abiotic factor affecting growth, survival and reproduction of poikilotherms like insects (Bale et al., Reference Bale, Masters, Hodkinson, Awmack, Bezemer, Brown, Butterfield, Buse, Coulson and Farrar2002).
In the present study, the model outputs represent only the potential population growth parameters for S. frugiperda in a given agro-ecological region. Thus, it needs to be cautiously interpreted while predicting field dynamics and abundance of S. frugiperda population, where other abiotic and biotic factors do play a significant role in regulating the population dynamics of pest. The present results indicate that temperature is vital in influencing the growth and life table parameters of S. frugiperda and this pest incidence is likely to be higher in the future climate change periods in India.
Conclusion
This study indicated that the growth and development of S. frugiperda are significantly influenced by temperature. Both lower and higher temperatures limited the survival and development of insect pest and the ideal condition for the growth of the pest is at 27–30°C temperature, while the development rate increases with temperature up to 30°C. The present study assessed the temperature-dependent development of S. frugiperda and developed a temperature-driven phenology model for this pest on maize which is essential knowledge for setting up local pest management programmes, and analysing the pests’ establishing risks and potential abundance under present and future climate periods of 2050 and 2070. In the present study, pest risk indices are simulated using the pests’ process-based phenology model that describes the basic physiological principles of insect species’ growth, i.e. its development, survival and reproduction. The discussed model here might be used as a tool for specific pest risk assessments and for improving pest management strategies for S. frugiperda. Furthermore, all other possible sources of uncertainty (e.g. predictions of climate change, future host plant distribution, etc.) in building the phonologic model of S. frugiperda distribution, abundance and its response to future climatic changes warrant more detailed insights into the abiotic and biotic factors that impact the species population growth and spatiotemporal abundance.
Acknowledgements
This work was financially supported by grants from the Indian Council of Agricultural Research (ICAR), New Delhi in the form of the National Initiative on Climate Resilient Agriculture (NICRA) Project. The authors are thankful to the Head, Division of Crop Sciences, ICAR-CRIDA, Hyderabad for providing the necessary facilities in carrying out the research.