Introduction
Cognitive impairment has been repeatedly demonstrated in people with bipolar disorder (BD; Bora, Yucel, & Pantelis, Reference Bora, Yucel and Pantelis2009; Robinson et al., Reference Robinson, Thompson, Gallagher, Goswami, Young, Ferrier and Moore2006; Sheffield, Karcher, & Barch, Reference Sheffield, Karcher and Barch2018), with such impairment associated with reduced function and quality of life (Cotrena, Branco, Shansis, & Fonseca, Reference Cotrena, Branco, Shansis and Fonseca2016). Many individuals perform worse than controls on tests of several widely measured cognitive processes: executive function, working memory, processing speed, and attention (Dickinson, Becerra, & Coombes, Reference Dickinson, Becerra and Coombes2017) which is not entirely explained by mood state or medication (Bourne et al., Reference Bourne, Aydemir, Balanzá-Martínez, Bora, Brissos, Cavanagh and Dittmann2013; Robinson et al., Reference Robinson, Thompson, Gallagher, Goswami, Young, Ferrier and Moore2006). Impairment in sustained attention (or vigilance) has been suggested as a cognitive endophenotype in BD and central to the cognitive deficits seen (Clark, Sarna, & Goodwin, Reference Clark, Sarna and Goodwin2005). Sustained attention is most commonly studied using continuous performance tests (CPTs). These are repetitive tasks in which attention must be maintained to successfully respond to target stimuli. Reported outcomes are often the absolute error rates or average reaction times. However, these aggregate measures may mask detail regarding variability in an individual's responses that could provide further information about their capacity to sustain attention over time. Intra-individual variability in response times in CPT tasks can be examined using an ex-Gaussian distribution, which provides the mean and standard deviation of the normally distributed portion of the data and a measure of the exponential component, tau (τ), which represents the skew in the distribution due to slower responses (Whelan Reference Whelan2008). Gallagher et al. (Reference Gallagher, Nilsson, Finkelmeyer, Goshawk, Macritchie, Lloyd and Ferrier2015) found a significantly higher τ in patients with BD compared with controls on the Vigil CPT, with much greater differences in effect sizes than typical aggregate measures. This suggests using ex-Gaussian analysis could improve sensitivity to detect differences in sustained attention between patients and controls.
While significant cognitive deficits (defined as more than one standard deviation below control scores in two separate cognitive domains) are common, they are only seen in 30–40% of patients with BD (Douglas et al., Reference Douglas, Gallagher, Robinson, Carter, Vw McIntosh and Ma Frampton2018; Iverson, Brooks, Langenecker, & Young, Reference Iverson, Brooks, Langenecker and Young2011). Additionally, one-third to one-quarter of patients have moderate impairments in a subset of domains (Burdick et al., Reference Burdick, Russo, Frangou, Mahon, Braga, Shanahan and Malhotra2014; Lima et al., Reference Lima, Rabelo-da-Ponte, Bücker, Czepielewski, Hasse-Sousa, Telesca and Rosa2019). What remains unclear is what determines whether or not a patient with BD experiences significant deficits. Cognitive deficits may arise secondary to the biology underlying the mood disorder. Additionally, or alternatively, many other factors might influence cognitive performance in patients. For example, deficits in attention have been found in non-psychiatric population groups such as smokers (Loree, Lundahl, & Ledgerwood, Reference Loree, Lundahl and Ledgerwood2015), the obese (Barkin, Reference Barkin2013), and individuals who are sleep deprived (Lim & Dinges, Reference Lim and Dinges2008), who have circadian rhythm disturbance (Carpenter et al., Reference Carpenter, Robillard, Lee, Hermens, Naismith, White and Hickie2015) or Obstructive Sleep Apnoea (OSA; Olaithe, Bucks, Hillman, and Eastwood, Reference Olaithe, Bucks, Hillman and Eastwood2018) suggesting that many processes, both physiological and pathological, influence attention and hence cognition more generally. A number of these may be relevant to BD.
People with BD engage in significantly less physical activity than controls (Janney et al., Reference Janney, Fagiolini, Swartz, Jakicic, Holleman and Richardson2014; Melo, Daher, Albuquerque, & de Bruin, Reference Melo, Daher, Albuquerque and de Bruin2016) and are more sedentary (Vancampfort et al., Reference Vancampfort, Firth, Schuch, Rosenbaum, De Hert, Mugisha and Stubbs2016a, Reference Vancampfort, Sienaert, Wyckaert, De Hert, Stubbs and Probst2016b). While there is relatively little literature showing a relationship between long-term physical fitness and executive function in healthy working-age adults (Swagerman et al., Reference Swagerman, de Geus, Koenis, Hulshoff Pol, Boomsma and Kan2015; Verburgh, Königs, Scherder, & Oosterlaan, Reference Verburgh, Königs, Scherder and Oosterlaan2014), a growing body of prospective research shows that physical activity can improve cognition and brain function. Meta-analyses of trials have found that aerobic exercise interventions improve attention, processing speed, executive function, and memory (Smith et al., Reference Smith, Blumenthal, Hoffman, Cooper, Strauman, Welsh-Bohmer and Sherwood2010), and global cognition, working memory, and attention in schizophrenia (Firth et al., Reference Firth, Stubbs, Rosenbaum, Vancampfort, Malchow, Schuch and Elliott2017). The biological mechanism behind this association is unknown: it is not thought to be due to an increase in cardiovascular fitness (Etnier, Nowell, Landers, & Sibley, Reference Etnier, Nowell, Landers and Sibley2006), but it could be due to neuroprotection from increasing neurotrophic growth factors and synaptic plasticity, and altering epigenetic gene expression (Thomson et al., Reference Thomson, Turner, Lauder, Gigler, Berk, Singh and Sylvia2015).
The rate of obesity in mood disorders varies by country and methodology used but ranges from 19 to 67% in BD (McElroy et al., Reference McElroy, Kotwal, Malhotra, Nelson, Keck and Nemeroff2004). Cournot et al. (Reference Cournot, Marquie, Ansiau, Martinaud, Fonds, Ferrieres and Ruidavets2006) found that higher body mass index (BMI) is associated with lower cognitive test scores and greater cognitive decline in healthy adults, while weight loss is associated with a small improvement in attention and executive functioning in obese individuals (Siervo et al., Reference Siervo, Arnold, Wells, Tagliabue, Colantuoni, Albanese and Stephan2011).
There is clear evidence of circadian disturbance in BD. Takaesu et al. (Reference Takaesu, Inoue, Murakoshi, Komada, Otsuka, Futenma and Inoue2016) interviewed a sample of euthymic BD outpatients and found that nearly one-third met criteria for a circadian rhythm sleep-wake disorder. Data from the UK BioBank show that disruption in circadian rhythm was associated with slower reaction times on a brief card-matching task, as well as a greater risk of depression and BD (Lyall et al., Reference Lyall, Wyse, Graham, Ferguson, Lyall, Cullen and Smith2018)
Sleep, and sleep disruption is also an obvious candidate factor that may mediate or moderate the occurrence of cognitive deficits in BD. Impairments have been found to be related to abnormal sleep as measured subjectively, for example using sleep diaries (Kanady, Soehner, Klein, & Harvey, Reference Kanady, Soehner, Klein and Harvey2017; Russo et al., Reference Russo, Mahon, Shanahan, Ramjas, Solon, Purcell and Burdick2015), and work using objective measures has confirmed this association. Bradley et al. (Reference Bradley, Webb-Mitchell, Hazu, Slater, Middleton, Gallagher and Anderson2017) found a variety of sleep phenotypes in a sample of patients with BD, including circadian rhythm disruption, OSA, hypersomnia, and insomnia. Some patients had multiple abnormalities, and abnormal sleep was significantly associated with decreased functioning and quality of life. Sleep deprivation is well known to impair sustained attention and increase lapses in responses (Lim & Dinges, Reference Lim and Dinges2008), the very abnormalities that may be central to the cognitive deficits seen in BD (Clark et al., Reference Clark, Sarna and Goodwin2005; Gallagher et al., Reference Gallagher, Nilsson, Finkelmeyer, Goshawk, Macritchie, Lloyd and Ferrier2015).
We have previously explored the relationship between sleep abnormalities and cognition in a cohort of patients with BD and found that measures of attention and processing speed were only different from controls in those patients who had abnormal sleep (Bradley et al., Reference Bradley, Anderson, Gallagher and McAllister-Williams2020). This could be a direct association, or indirect and involve factors such as exercise and obesity, given that the former is lower and the latter higher in poor sleepers (Hargens, Kaleth, Edwards, & Butner, Reference Hargens, Kaleth, Edwards and Butner2013; Tan et al., Reference Tan, Alen, Cheng, Mikkola, Tenhunen, Lyytikainen and Cheng2015), or circadian rhythm. In this paper, we explore the relationship between activity, BMI, and circadian rhythm disturbance with cognition in the same cohort of BD patients and controls in which we explored sleep and cognition (Bradley et al., Reference Bradley, Anderson, Gallagher and McAllister-Williams2019). We specifically explored the cognitive domains of attention and processing speed that we found to be associated with sleep abnormalities. We hypothesised that reduced physical activity, high BMI, and circadian rhythm disruption predicts impaired performance on cognitive tasks in BD.
Methods
Data collection
The methods of recruitment and assessment of patients with BD and controls included in the current analysis has previously been described (Bradley et al., Reference Bradley, Webb-Mitchell, Hazu, Slater, Middleton, Gallagher and Anderson2017; Bradley et al., Reference Bradley, Anderson, Gallagher and McAllister-Williams2019). An opportunistic sample of 46 patients with BD (16 BD I and 30 BD II) and 42 controls completed the study, although some participants did not complete all the cognitive tasks. BD patients were excluded if they scored 5 or above on the Young Mania Rating Scale [YMRS; (Young, Biggs, Ziegler, & Meyer, Reference Young, Biggs, Ziegler and Meyer1978)], however, patients were not excluded on the basis of depressive symptoms.
Sleep and circadian rhythms were assessed using both subjective and objective measures. Participants were asked to keep a 21-day sleep diary and to complete the Pittsburgh Sleep Quality Index (PSQI), Epworth Sleepiness Scale (ESS), and the Biological Rhythms Interview of Assessment in Neuropsychiatry (BRIAN).
Sleep was objectively assessed using a triaxial accelerometer worn on the non-dominant wrist (GENEActiv; Activinsights Ltd) for 21 days. Data were analysed using the R-package GGIR (van Hees et al., Reference van Hees, Fang, Zhao, Heywood, Mirkes, Sabia and Migueles2019), an open-source tool developed for use with raw accelerometer data collected from this device. The data took the form of numerical estimates of sleep variables but were also visually displayed on an actogram, which allowed visual inspection of the sleep/wake cycle to identify specific patterns and circadian rhythm disturbance. The sleep diary was used to assist with classifying activity periods as either sleep or wake.
Participants were assessed for the presence of OSA with a portable home partial polysomnography device, the Embleta Gold Polygraphy System (Embla Systems, Bloomfield, USA) worn for one night. Respiratory events were scored according to the standard criteria of the American Association of Sleep Medicine (AASM) (Kushida et al., Reference Kushida, Littner, Morgenthaler, Alessi, Bailey, Coleman and Wise2005) and the apnoea hypopnoea index (AHI) derived. An AHI of >5/h was considered abnormal and indicative of OSA. BMI was calculated using measurements obtained from participants at baseline.
Normal sleep was defined as 6–10 h mean nocturnal sleepover 24 h with a regular sleep-wake cycle, and a negative test for OSA. Abnormal sleepers were defined as short nocturnal sleepers (<6 h mean nocturnal sleep), long nocturnal sleepers (>10 h mean nocturnal sleep), long 24 h sleepers (>10 h nocturnal sleep and daytime sleep), circadian rhythm disturbance (patterns of sleep characteristic of circadian rhythm sleep disorders as defined in the International Classification of Sleep Disorder – 3rd Edition; American Academy of Sleep Medicine, 2014), and participants identified with OSA.
The triaxial accelerometer also collected data on physical activity. Data were analysed using the R-package GGIR (van Hees et al., Reference van Hees, Fang, Zhao, Heywood, Mirkes, Sabia and Migueles2019), an open-source tool developed for use with raw accelerometer data collected from this device. The intensity of physical activity was assessed by calculating the amount of time individuals engaged in ‘Moderate to Vigorous Physical Activity’ (MVPA) as defined in the World Health Organisation exercise guidance which recommends that adults age 18–65 engage in 75–150 min of MVPA per week (WHO, 2011). Acceleration was recorded and corrected for calibration error and averaged over 5 s epochs. MVPA was defined as occurring if 80% of the 5 s epochs in a 5-min period were above an average acceleration of 100 millig, to remove arm movement unrelated to MVPA.
The relative amplitude (RA) of the circadian rhythm was calculated by the R-package GGIR using the data collected from the accelerometers, identifying the 10 h of most activity (‘M10’) and the 5 h of the least activity (‘L5’) over 24-h periods. The RA is calculated as (M10 − L5)/(M10 + L5), and produces a score between 0 and 1. A higher score indicates a larger difference between the amount of activity during the day and the night.
Functioning was measured using the 24-item Functional Assessment Short Test [FAST; (Rosa et al., Reference Rosa, Sánchez-Moreno, Martínez-Aran, Salamero, Torrent, Reinares and Ayuso-Mateos2007)] which has been validated in BD patients, with a higher score indicating a lower level of functioning. Quality of Life was measured using the Quality of Life in BD Questionnaire, which contains 48 core questions and 8 optional questions [QoL.BD; (Michalak, Murray, & BD, Reference Michalak and Murray2010)]; lower scores indicate lower quality of life.
Cognitive assessment
A battery of tasks was administered to assess neuropsychological function. Abnormalities in sustained attention and processing speed have been found both in BD and sleep abnormalities, and were specifically investigated using the following tasks:
The Psychomotor Vigilance Task (PVT; Dinges & Powell, Reference Dinges and Powell1985) is a simple computerised reaction time task in which the participant must respond in the shortest possible time to a stimulus (a digital counter) that appears on the computer screen.
The Attention Network Test (ANT; Fan, McCandliss, Sommer, Raz, and Posner, Reference Fan, McCandliss, Sommer, Raz and Posner2002) is a computerised task that uses participant reaction times to calculate the processing efficiency of three uncorrelated attentional networks (alerting, orienting, and executive attention).
The Digit Symbol Substitution Test (DSST) is derived from the Wechsler Adult Intelligence Scale-Revised (WAIS-R) (Wechsler & De Lemos, Reference Wechsler and De Lemos1981) and assesses graphomotor speed, perceptual speed, and visual scanning efficiency with variable contributions of executive functions depending on age group (Joy, Kaplan, & Fein, Reference Joy, Kaplan and Fein2003). The participant must match as many symbols as possible to a corresponding number using a key. The outcome measure is the number of symbols correctly copied in 90 s.
Statistical analysis
As in Bradley et al. (Reference Bradley, Anderson, Gallagher and McAllister-Williams2019), intra-individual variability of the reaction time distributions of both the PVT and ANT were examined using ex-Gaussian analysis to calculate the τ of the exponential component of the distribution.
Additional statistical analyses were performed using IBM SPSS versions 22–24. The neurocognitive variables were winsorized to remove extreme outliers, and Kolmogorov–Smirnov tests were applied to the complete data set to test normality. Independent samples χ2 and Mann–Whitney U tests were conducted to examine differences between control and BD groups in physical activity, BMI, and circadian rhythm. Separate Pearson's correlational analyses were conducted for patients and controls, to explore potential differences in associations between demographic, independent, and dependent variables in each group. Separate hierarchical regression analyses (using the Enter method) were then conducted on the dependent variables PVT τ, ANT τ, and DSST score. Control variables of age, NART IQ, and HAMD score (Porter, Robinson, Malhi, & Gallagher, Reference Porter, Robinson, Malhi and Gallagher2015; Robbins et al., Reference Robbins, James, Owen, Sahakian, McInnes and Rabbitt1994) were entered as an initial block before examining the variables of interest. In the next step, the variables of MVPA, BMI, and RA were entered as sequential steps. Groups were then entered as sequential steps into the analysis to determine whether there was a difference between BD patients and controls, between those with sleep abnormalities and those without, and between patients with OSA and those without (to explore whether any effect of sleep abnormality could be driven by cognitive changes in those with this specific diagnosis).
Results
Participant characteristics
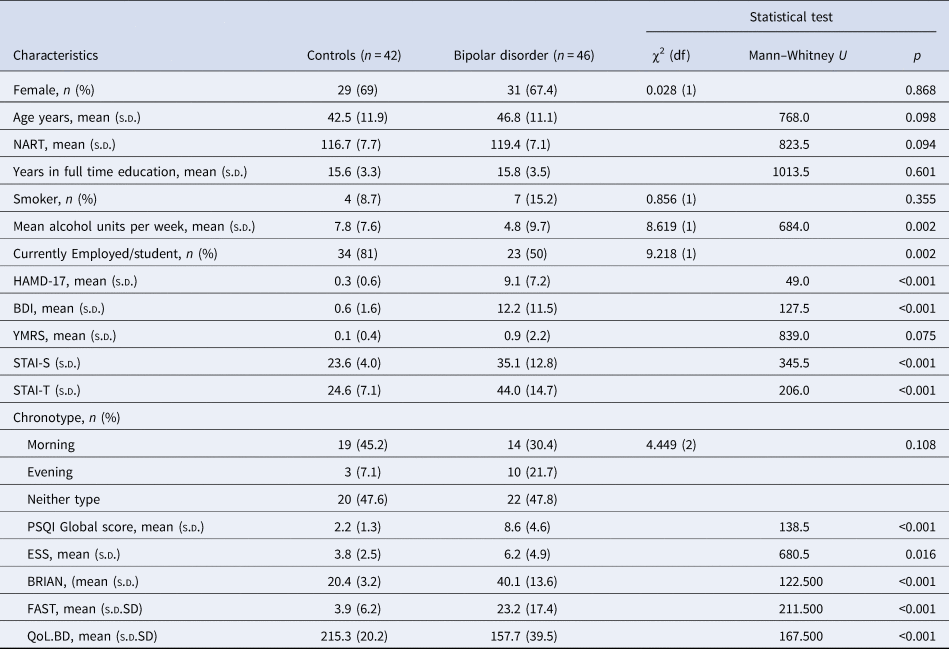
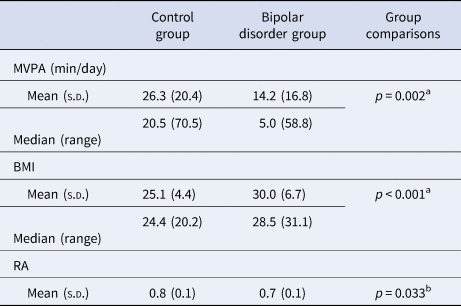
The general characteristics of the study participants are reported in Table 1. Of the patients with BD, 16 had objectively assessed normal sleep and 28 had abnormal sleep. Twelve BD patients and four controls had OSA as defined by an AHI of >5/h. The groups were not significantly different in terms of gender, age, NART IQ score, years in full-time education, or number of smokers. The group with BD had significantly higher depression scores, consumed fewer units of alcohol per week, and fewer were in education or employed than controls. The control group had a significantly higher mean MVPA and RA (Table 2) and the BD group significantly higher BMI.
Characteristics of study participants

NART, National Adult Reading Test; BMI, body mass index; HAMD-17, 17-item Hamilton Depression Rating Scale; BDI, Beck Depression Inventory; YMRS, Young Mania Rating Scale; STAI-S/T, State and Trait Anxiety Inventory – State/Trait; PSQI, Pittsburgh Sleep Quality Index; ESS, Epworth Sleepiness Scale; BRIAN, Biological Rhythms Interview of Assessment in Neuropsychiatry; FAST, Functional Assessment Short Test; QoL.BD, Quality of Life in Bipolar Disorder Questionnaire; morning and evening chronotypes including both definite and moderate subtypes.
Differences between control and bipolar disorder groups in physical activity, BMI, and circadian rhythm
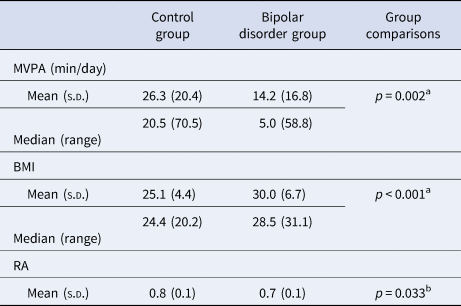
MVPA, Moderate to Vigorous Physical Activity; BMI, body mass index; RA, relative amplitude.
a Independent samples Mann–Whitney U test
b Independent samples t Test
Correlation analyses (Tables 3 and 4)
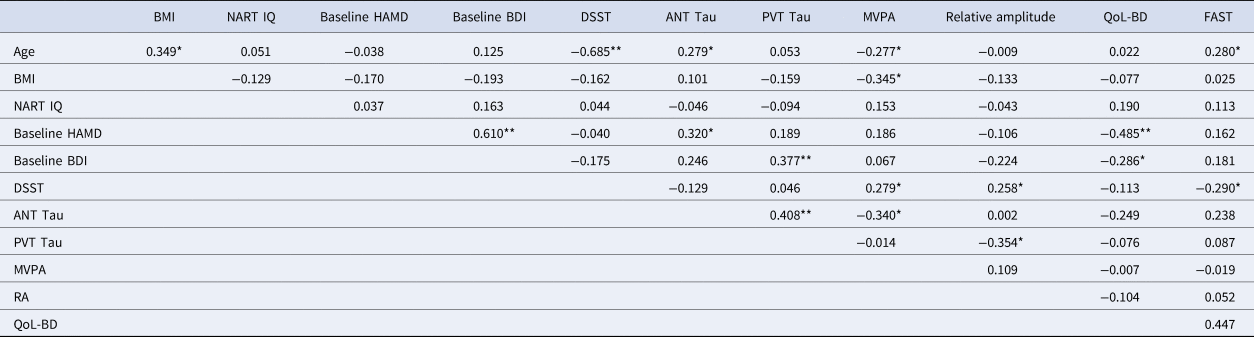
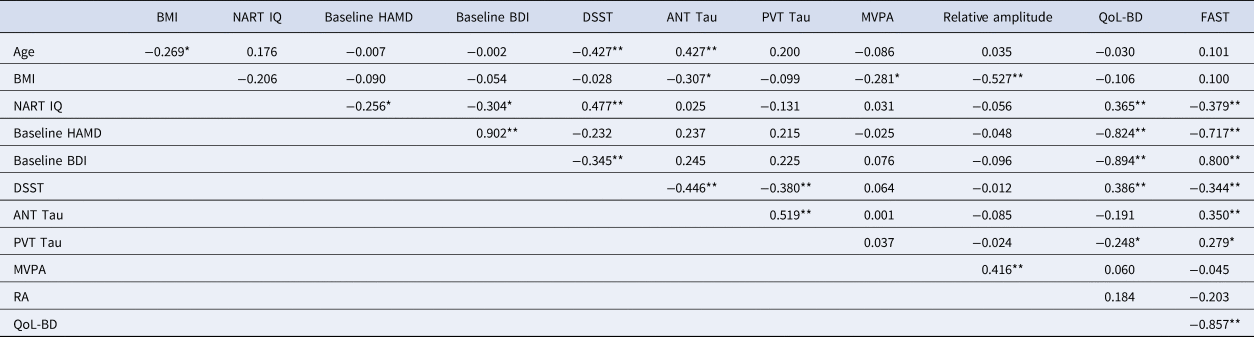
In the control group, MVPA was significantly positively correlated with performance on the DSST and significantly negatively correlated with ANT τ. However, there was no significant correlation with PVT τ. In the BD group, MVPA was not significantly correlated with the cognitive variables.
Control group
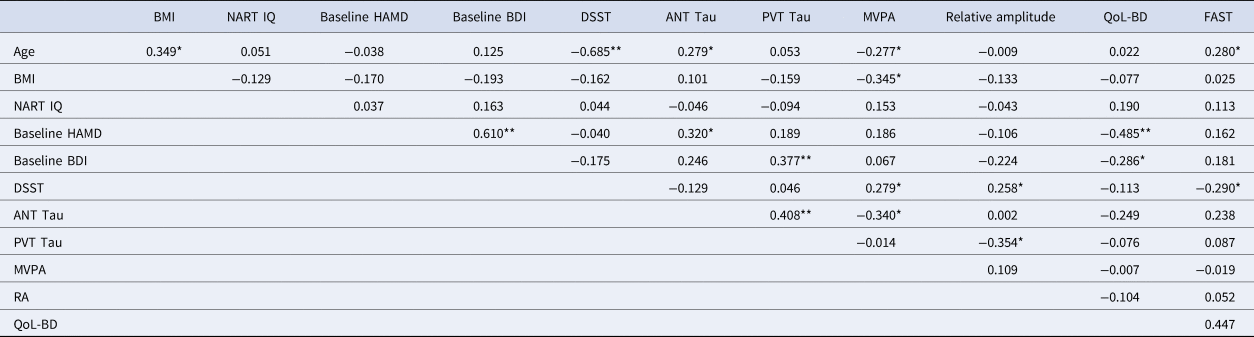
NART, National Adult Reading Test; BMI, body mass index; HAMD, Hamilton Depression Rating Scale; BDI, Beck Depression Inventory; MVPA, Moderate to Vigorous Physical Activity; RA, relative amplitude; DSST, Digit Symbol Substitution Test; ANT, Attention Network Test; PVT, Psychomotor Vigilance Task; QoL.BD, Quality of Life in Bipolar Disorder Questionnaire.
* Correlation is significant at the 0.05 level (1-tailed).
** Correlation is significant at the 0.01 level (1-tailed).
Bipolar disorder group
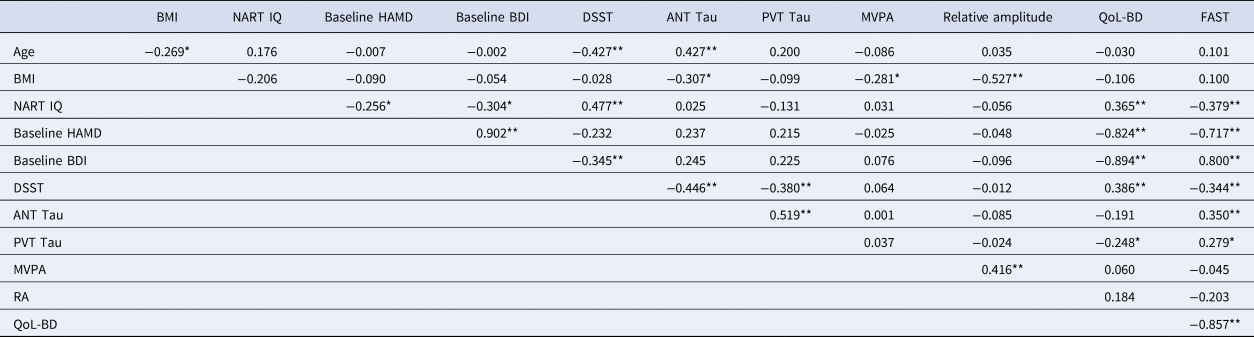
NART, National Adult Reading Test; BMI, body mass index; HAMD, Hamilton Depression Rating Scale; BDI, Beck Depression Inventory; MVPA, Moderate to Vigorous Physical Activity; RA, relative amplitude; DSST, Digit Symbol Substitution Test; ANT, Attention Network Test; PVT, Psychomotor Vigilance Task; QoL.BD, Quality of Life in Bipolar Disorder Questionnaire.
* Correlation is significant at the 0.05 level (1-tailed).
** Correlation is significant at the 0.01 level (1-tailed).
BMI was not significantly correlated with any cognitive variables in the control group but was significantly negatively correlated with ANT τ in the BD group. In both groups, BMI was significantly negatively correlated with MVPA. BMI was also significantly negatively associated with RA in the BD group.
RA was significantly positively correlated with DSST performance, significantly negatively correlated with PVT τ but not correlated with ANT τ. However, in the BD group, RA was not correlated with the cognitive variables. RA was not correlated with MVPA in the control group, but it was significantly positively correlated with MVPA in the BD group.
In the control group age was significantly negatively correlated with MVPA, but not in the BD group. In both groups, age was significantly negatively correlated with DSST score, and significantly positively correlated with ANT τ. Higher baseline scores on measures of depression were associated with decreased performance on some tasks: HAMD score was significantly positively correlated with ANT τ in the control group, and Baseline BDI score was significantly negatively correlated with DSST score in the BD group. No demographic variables were significantly correlated with RA in either group.
In the control group, HAMD was significantly negatively associated with the QoL.BD and the BDI. Age was significantly positively correlated with the FAST, and the DSST was significantly negatively correlated. In the BD group, NART IQ was significantly positively associated with the QoL.BD. QoL.BD score was significantly negatively associated with the HAMD and the BDI. QoL.BD was significantly positively correlated with DSST score and negatively with PVT τ. FAST score was significantly negatively associated with NART IQ, HAMD, and positively associated with BDI. FAST score was also significantly associated with the three measures of cognition: DSST, ANT τ, and PVT τ.
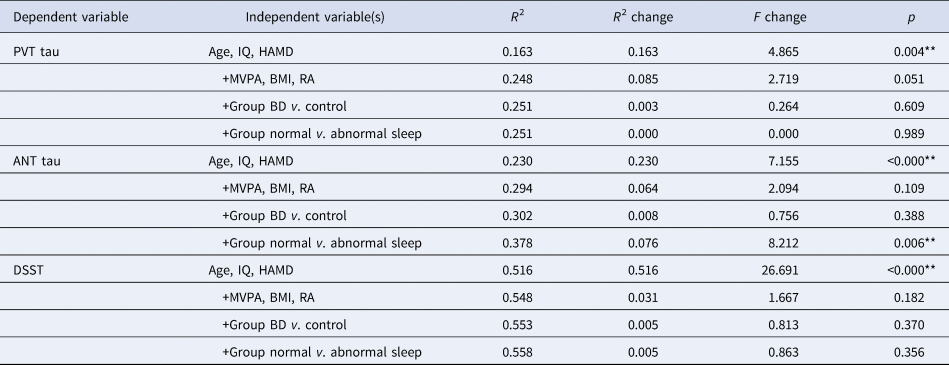
Hierarchical regression analyses (Table 5)
For each dependent variable, demographic variables (age, IQ, and HAMD) were first entered together in the model. These factors explained a significant portion of the variance in the outcome measure for each of the three cognitive outcome measures (p < 0.01) across the whole sample: R 2 change for PVT τ was 16.3%, for ANT τ 23.0%, and for DSST 51.6%. Each variable of interest (MVPA, BMI, and RA) was initially examined in the model independently, however none added significant variance to the models therefore these were added together in one step. Diagnosis of BD did not add any significant variance to any of the models. For ANT τ, the addition of normal v. abnormal sleep group only predicted a significant part of the variance (R 2 change 7.6%, p = 0.006), and for PVT τ only the addition of OSA v. no OSA group predicted a significant part of the variance (R 2 change 5.5%, p = 0.023). The presence of abnormal sleep or OSA specifically did not add to the model for DSST score. Values obtained for tolerance and Variance Inflation Factor indicated that multicollinearity was unlikely to be a problem.
Results of multiple regression analysis examining predictors of cognitive function
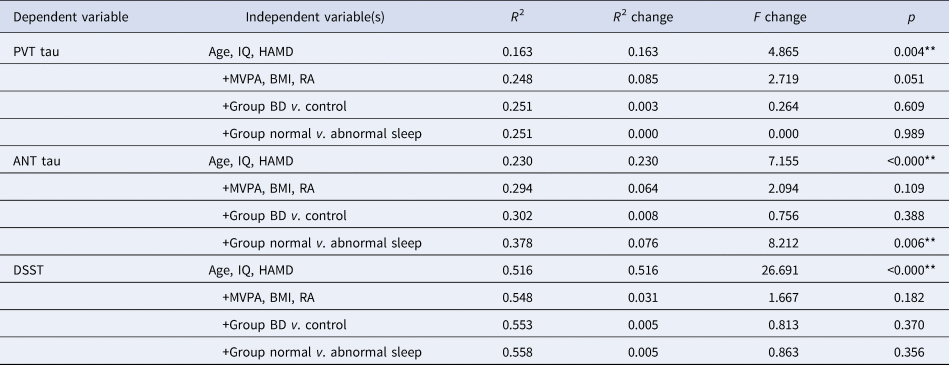
BMI, body mass index; HAMD, Hamilton Depression Rating Scale; MVPA, Moderate to Vigorous Physical Activity; RA, relative amplitude; DSST, Digit Symbol Substitution Test; ANT, Attention Network Test; PVT, Psychomotor Vigilance Task; BD, bipolar disorder.
Each independent variable was sequentially added to the model.
* Correlation is significant at the 0.05 level (1-tailed).
** Correlation is significant at the 0.01 level (1-tailed).
Discussion
Bradley et al. (Reference Bradley, Anderson, Gallagher and McAllister-Williams2019) found that the ability to sustain attention was lower in patients with BD compared with controls and that these differences were associated with sleep abnormalities. This current analysis sought to explore the contribution of physical activity, BMI, and circadian rhythm to performance on cognitive tasks.
Participants with BD engaged in significantly less physical activity had significantly higher BMIs and had significantly lower RA than the control group. While there were significant correlations between physical activity and RA and cognitive variables in the control group, these were not present in the BD group. BMI was not significantly correlated with any cognitive variables in the control group, but in the BD group, a higher BMI was significantly correlated with lower intra-individual variability (τ) on the ANT (i.e. opposite to the direction of relationship hypothesised). Cognitive dysfunction as indicated by DSST score, ANT τ, and PVT τ was associated with poor functioning in the bipolar group. Better quality of life was associated with a lower PVT τ and a higher DSST score. There was no relationship between activity, BMI, and circadian rhythm with quality of life and functioning, which may reflect the lack of relationship between these three variables and cognition.
Using multiple regression, neither levels of physical activity, BMI or circadian rhythm were found to significantly predict cognitive test scores across the whole sample. Most of the variance in the three cognitive test scores was predicted by demographic variables, with the proportion of explained variance increasing with the number and complexity of cognitive domains recruited by the task. As in Bradley et al. (Reference Bradley, Anderson, Gallagher and McAllister-Williams2019), sleep abnormalities significantly predicted intra-individual variability on the ANT. In addition, OSA (but not abnormal sleep) significantly predicted intra-individual variability on the PVT, a finding consistent with previous research (Devita et al., Reference Devita, Montemurro, Zangrossi, Ramponi, Marvisi, Villani and Mondini2017).
The relationship between BMI and ANT τ in the BD group was not as expected. While Cournot et al. (Reference Cournot, Marquie, Ansiau, Martinaud, Fonds, Ferrieres and Ruidavets2006) found an association between BMI and word-list learning and DSST scores in a sample of healthy subjects, the direction of the association was for a higher BMI to be associated with worse, not better, performance. Not all studies of the relationship between BMI and measures of executive function, processing speed, and memory find an association. For example, Bolzenius (Reference Bolzenius2014) did not find any relationship in a sample of 62 adults over the age of 50. However, a recent systematic review found that patients with BD who were also overweight or obese performed worse on tests of executive function and processing speed than patients with BD who were normal weight, though there were no differences on tests of attention or memory (Bora, McIntyre, & Ozerdem, Reference Bora, McIntyre and Ozerdem2018). In addition, a prospective study has found the opposite relationship, with better cognition predicting increases in BMI (Bond et al., Reference Bond, Torres, Lee, Kozicky, Silveira, Dhanoa and Yatham2017). This finding is more in line with our study but it remains possible that, given our relatively small sample size, the relationship between BMI and cognition that we found is spurious.
In the control group, greater physical activity level was significantly associated with better performance on the DSST and lower τ on the ANT, however not on the PVT. The PVT is a very simple reaction time task lasting for 10 min, whereas the ANT utilises different attentional networks for 30 min. This may result in a more pronounced intra-individual variability in reaction times on the ANT compared with the PVT. There was no relationship between physical activity levels and cognition in patients with BD. Few studies examining the relationship between physical activity and cognition in BD have been published. Jerome et al. (Reference Jerome, Young, Dalcin, Charleston, Anthony, Hayes and Daumit2009) did not find an association between MVPA (as measured by accelerometer) and average score on a short cognitive test battery in a small pilot study of just 15 patients. Similarly, Metcalfe et al. (Reference Metcalfe, MacIntosh, Scavone, Ou, Korczak and Goldstein2016) found no effect on accuracy or reaction time on a sustained attention and inhibition tasks in a small sample of adolescents with BD who underwent a 27-min bout of vigorous aerobic exercise. Fellendorf et al. (Reference Fellendorf, Kainzbauer, Platzer, Dalkner, Bengesser, Birner and Pilz2017) conducted a much larger study and analysed the relationship between physical activity and cognition in 120 euthymic adults with BD and found a difference by sex: in males lower levels of physical activity was associated with worse performance on the Trail Making Test-A only, a task thought to reflect processing speed. In females, lower levels of physical activity were associated with poorer performance in almost all domains of executive function. In addition to using different cognitive tasks, importantly Fellendorf et al. only assessed activity subjectively using a questionnaire categorising participants as engaging in low, moderate, and vigorous weekly physical activity. Our study had the advantage of objective assessment of activity, minimising recall bias. However, our sample size was smaller and not sufficient to examine sex differences.
There have been no studies that specifically examine whether co-morbid circadian rhythm abnormalities affect cognition in BD. Thomas et al. (Reference Thomas, He, Mazumdar, Wood, Bhatia, Gur and Deshpande2018) found no association between circadian rhythm disturbance and cognitive variables in a mixed sample of individuals with schizophrenia and BD Type 1. However, objectively measured poor rhythmicity was a predictor of impaired verbal memory in another mixed sample of adolescents and young adults with BD and depression (Robillard et al., Reference Robillard, Hermens, Lee, Jones, Carpenter, White and Scott2016). This is a clear area warranting further research.
Previous research into the cognitive effects of physical activity and BMI in working-age adults has not considered the potential confounding effect of sleep abnormalities. The relationship between these factors may be hierarchical: sleep difficulties may negate the ordinarily significant contribution of physical activity and BMI on cognitive function. Reciprocal interactions make the study of these effects a complex task, and research findings have been contradictory. Sleep abnormalities have previously been associated with high BMI and lower physical activity levels (Hargens et al., Reference Hargens, Kaleth, Edwards and Butner2013; Tan et al., Reference Tan, Alen, Cheng, Mikkola, Tenhunen, Lyytikainen and Cheng2015). However. in a large epidemiological survey, Loprinzi and Cardinal (Reference Loprinzi and Cardinal2011) did not find an association between sleep abnormalities and physical activity measured by actigraph. High BMI is both a cause and consequence of inactivity (Pietiläinen et al., Reference Pietiläinen, Kaprio, Borg, Plasqui, Yki-Järvinen, Kujala and Rissanen2008) and is a risk factor for developing OSA, which causes daytime sleepiness and reduced aerobic capacity. This may limit physical activity and further increase BMI, which exacerbates fatigue and sleep disruption (Chennaoui, Arnal, Sauvet, & Léger, Reference Chennaoui, Arnal, Sauvet and Léger2015). A meta-analysis of 66 studies found that acute and regular exercise had small to moderate benefits on several different aspects of sleep (Kredlow, Capozzoli, Hearon, Calkins, & Otto, Reference Kredlow, Capozzoli, Hearon, Calkins and Otto2015), though this might not apply to those with severe mental illness. In a review of the correlates of physical activity in BD, Vancampfort et al. (Reference Vancampfort, Correll, Probst, Sienaert, Wyckaert, De Herdt and De Hert2013) found that higher BMI and medical co-morbidity were the biological factors most consistently associated with lower physical activity. It is notable that in our study, the actigraph recorded a median of only 5 min of moderate-to-vigorous physical activity per day in the BD group. This may be multiple explanations for this including unemployment and low mood, as well as comorbid sleep abnormalities.
Our data (Bradley et al., Reference Bradley, Anderson, Gallagher and McAllister-Williams2019) most strongly points to an association between sleep abnormalities and cognition in BD with little or no relationship with physical activity, BMI, and circadian rhythm. Research in this area, and such observations, are of critical importance to the group of patients with BD who have significant cognitive dysfunction. In particular, the question is whether modifying any of the factors associated with poor cognition in BD leads to improvements in cognition. Strategies to improve sleep in BD patients with sleep abnormalities seems an obvious target, and in a small study of inter-episode BD patients with insomnia, Kanady et al. (Reference Kanady, Soehner, Klein and Harvey2017) demonstrated an improvement in working memory and verbal learning after a course of Cognitive Behavioural Therapy for Insomnia (adapted for BD). Additionally, despite our negative findings regarding the relationship between activity and BMI with cognition in BD, these may also be potential therapeutic targets. Our negative findings could simply be down to our sample size and the complexity of the interactions between factors. A causal relationship between levels of activity and BMI with cognition would perhaps most robustly be tested by examining the effect of interventions aimed at increasing activity and decreasing BMI. At the very least they would be of generic health benefit to the patients.
In summary, in this analysis, we found that physical activity, BMI and circadian rhythm disruption did not predict performance on specific cognitive tasks in individuals with BD. This is in contrast to our previous findings of a strong relationship between cognition and sleep in BD (Bradley et al., Reference Bradley, Anderson, Gallagher and McAllister-Williams2019). Research into how we might improve cognition in BD may usefully focus on therapeutic interventions for sleep disturbance. The major limitation of this study is that it was exploratory, not powered to detect small effects, and given the number of analyses conducted there is a risk of false-positive findings. The relationship between these factors is complex and requires further research in patient populations with larger sample sizes. Understanding the factors associated with poor cognition in BD opens up options for interventions to enhance cognition and ultimately the function and quality of lives of patients.