


Introduction
Association of ice-shelf dynamics with sea-level rise
Of all the glaciological components comprising the Antarctic ice sheet, ice shelves are the most vulnerable to climate change. This is because ice shelves are in contact with the most dynamic changeable parts of the ocean and atmosphere and because they are the parts of the glaciological system that respond most quickly to changes in mass, energy and stress balances (e.g. Reference Scambos, Hulbe, Fahnestock and BohlanderScambos and others, 2000, Reference Scambos2009).
The sudden catastrophic break-up of several ice shelves along the Antarctic Peninsula has clearly demonstrated that the contribution of Antarctica to global sea-level rise might increase over the next century (Reference Vaughan, Cook, Marshall and PritchardVaughan and others, 2009). Collapse of the Larsen B ice shelf in early March 2002 resulted in the speed-up and thinning of glaciers previously buttressed by this ice shelf (Reference Rignot, Casassa, Gogineni, Krabill, Rivera and ThomasRignot and others, 2004; Reference Scambos, Bohlander, Shuman and SkvarcaScambos and others, 2004). In contrast, neighboring glaciers (Pequod, Stubb and Melville) that experienced roughly the same environmental conditions, but no removal of a buttressing ice shelf, were unchanged over the same time period. These observations constitute the strongest most reliable evidence to date of the critical importance of buttressing ice shelves in the stabilization of ice drainage from the interior of Antarctica and have motivated global attention to ice-shelf dynamics in efforts to anticipate changes in the rate of sea-level rise.
Studies modeling ice-shelf break-up (e.g. Reference ScambosScambos and others, 2009) suggest that increased fracturing, associated with the progressive decrease in ice-shelf integrity, likely occurred during the months and years preceding the collapse events as the shelf weakened. Although glaciological stresses are very important, this study focuses on stresses associated with gravity-wave impacts, which could significantly affect rift propagation and crevasse expansion. Infragravity (IG) and other ocean gravity-wave-induced signals could have a profound effect on existing fractures, and the effect of IG wave impacts in particular may be amplified at rift tips. However, excitation of existing fractures, not the creation of fractures or strain weakening in unfractured shelf plates, is likely the dominant effect of gravity-wave impacts.
Ice-shelf interaction with ocean gravity waves
Despite early observations of the prominent influence of sea swell on vibratory ice-shelf motions (Reference Holdsworth and GlynnHoldsworth and Glynn, 1978; Reference Williams and RobinsonWilliams and Robinson, 1979), neither systematic field measurements nor theoretical studies of swell effects on the ice shelves were undertaken until very recently. In the past few years, Reference Okal and MacAyealOkal and MacAyeal (2006), Reference Cathles, Okal and MacAyealCathles and others (2009), Reference Bromirski, Sergienko and MacAyealBromirski and others (2010) and Reference SergienkoSergienko (2010) among others have shown that ice shelves and ice-shelf fragments are appreciably (and constantly) flexed, rocked, rolled, pitched, elongated and compressed by various components of ocean waves. Recent theory and observations (Reference SergienkoSergienko, 2010) indicate that a better understanding of ice-shelf/wave interactions can lead to a better prediction of ice-shelf response to a changing environment (Reference ScambosScambos and others, 2009), which includes increased storminess and related ocean-wave effects (Reference Bromirski, Cayan and FlickBromirski and others, 2005a).
At IG wave frequencies (0.004–0.020 Hz), the ice shelf vibrates primarily in response to gravity-wave forcing, although teleseismic Rayleigh waves and P-waves are observed from large earthquakes (Reference Okal and MacAyealOkal and MacAyeal, 2006). Compliance analyses suggest that the ice sheet simply floats on the sea surface and oscillates at the amplitude and period of the IG waves. A more detailed analysis of the ice-shelf response, including the effects of the rigidity of the ice and its buoyancy, has been presented by Reference SergienkoSergienko (2010). At high frequencies, above the microseism peak near 0.3 Hz, the ice shelf vibrates in response to its elastic properties (characterized by seismic waves and sound propagation through the ice–water–sea-floor system). At intermediate frequencies (e.g. the swell band (0.03–0.30 Hz)), the ice vibrates in response to a combination of buoyancy and elastic effects.
In addition to thermodynamic interactions, ice shelves are subject to mechanical interactions with the ocean environment, particularly with the spatio-temporal spectrum of gravity-wave fluctuations, spanning local wind seas (at periods <10 s), sea swell (in the 10–30 s period band) and IG wave periods (from about 50 to 350 s). The links between mechanical interactions of ice-shelf fragments and the dynamical ocean forcing were described by Reference MartinMartin and others (2010), who showed that the effects of tidal currents and coastal mean flow on giant tabular iceberg B15A resulted in interactions with bedrock, which may have been compounded by swell impacts, and which had a role in the iceberg’s catastrophic fragmentation.
Although the stress perturbation amplitudes of IG waves and swell are small in the present gravity-wave climate (Reference BassisBassis and others, 2007; Reference Bromirski, Sergienko and MacAyealBromirski and others, 2010), their incessant nature may substantially influence rift propagation, icequake seismicity and ultimately potential fragmentation of the ice shelf. Nonuniform spatial effects are likely as both the ice-shelf structure and gravity-wave forcing are heterogeneous because: (1) wave-induced stresses have a complex spatial pattern from varying gravity-wave amplitudes along the front; (2) localized IG wave amplification resulting from refraction and focusing by bottom topography causes some regions along the ice front to experience larger IG forcing; and (3) nonuniform water depth below the ice shelf (channels) likely results in differential penetration of IG wave energy beneath the ice shelf.
Simulations of gravity-wave-induced elastic signal propagation through the ice shelf can be used to model the elastic and mechanical properties of the ice shelf and aid interpretation of seismic data. Time-domain finite-difference (TDFD) modeling can be used to understand the elastic properties of the ice shelf by modeling the propagation of signals from icequakes and swell impacts on the shelf edge. The strength of the TDFD method is that it can be applied to laterally varying problems such as an irregular basal interface and volume heterogeneities (e.g. crevasses, rifts, thickening (Reference StephenStephen, 1988, Reference Stephen1990; Reference Stephen and SwiftStephen and Swift, 1994a; Reference Swift and StephenSwift and Stephen, 1994)). There is considerable uncertainty in Young’s modulus, E, of ice shelves (e.g. Reference VaughanVaughan, 1995; Reference Scambos, Sergienko, Sargent, MacAyeal and FastookScambos and others, 2005), an important elastic parameter in modeling the response of ice shelves (Reference SergienkoSergienko, 2010). TDFD modeling of signals recorded on the Ross Ice Shelf (RIS) allows estimation of E and its spatial variability.
This study describes the response of the RIS to the forcing of ocean gravity waves having periods less than ~350 s. Spectral comparisons with signals recorded at tabular iceberg B15A (near 76.90˚ S, 168.70˚ E on 15 February 2005) and relatively nearby land-based seismic stations at Scott Base on Ross Island (SBA; 77.85˚ S, 166.76˚ E) and near Lake Vanda in the Dry Valleys (VNDA; 77.52˚ S, 161.85˚ E) allow identification of the signals observed at the Ross Ice Shelf ‘Nascent Iceberg’ seismic stations (RIS1, RIS2; 78.13˚ S, 178.50˚W; Reference MacAyealMacAyeal and others, 2006) (see Fig. 1 for locations) that are RIS-specific and can thus give insights into the response of the RIS to gravity-wave forcing.
Locations of seismometer stations on and near the Ross Ice Shelf: (1) the Nascent site (RIS), the location of both RIS1 and RIS2 during 2004–06; (2) Scott Base on Ross Island (SBA); (3) near Lake Vanda in the Dry Valleys (VNDA); and (4) on generally free-floating tabular iceberg B15A (approximate location on 15 February 2005).

Gravity-Wave Forcing
Ocean swell
The response of the RIS to gravity-wave forcing depends on both wave amplitude and wave period, which determines the wavelength using the depth-dependent gravity-wave dispersion relation. The water depth at the RIS front near the Nascent station is ~600 m, while the wavelength of 30 s period swell is ~1 km. The exponential decay of gravity-wave pressure signals with depth depends on wavenumber (having associated wavelengths), with little swell energy at the base of the ice front. Consequently, little swell energy penetrates the sub-ice-shelf cavity. The consequence is that most of the energy of high-amplitude (up to several meters) local-to-regional swell energy that is transferred to the RIS generates mechanical vibrations at impact.
The location of the source area for incident wave energy can be estimated from the dispersion (arrival time versus frequency) observed on ocean buoys or land-based seismometers (Reference Snodgrass, Groves, Hasselmann, Miller, Munk and PowersSnodgrass and others, 1966). The wave-generated response near the RIS edge was measured by a single seismic station (a vertical and two orthogonal horizontal broadband seismometers) deployed ~3 km north seaward of a major rift tip at Nascent Iceberg (a yet-to-calve tabular ice-shelf fragment along the ice front) during the austral summers of 2004–06 (RIS1, RIS2, respectively; RIS in Fig. 1). The spectral response indicates that ocean swell is continuously impacting the RIS when sea ice is absent during austral summer months January–March (e.g. Reference MacAyealMacAyeal and others, 2006; Fig. 2a). Using dispersion trends, Reference Cathles, Okal and MacAyealCathles and others (2009) demonstrated that motion of the ice shelf is induced by swell generated by storms located throughout the Pacific and Southern Oceans, and most notably from distant sources in the North Pacific. The relative amplitudes of swell-induced signals on the RIS were discovered to vary appreciably with the seasonal advance and retreat of sea ice (Reference MacAyealMacAyeal and others, 2006; Reference Cathles, Okal and MacAyealCathles and others, 2009).
(a) Vertical displacement spectral levels at the RIS front ‘Nascent Iceberg’ RIS2 station location, with the highest-amplitude RIS response for incident swell arrivals indicated (black circle). A North Pacific wave generation region is indicated by the slope of this dispersion trend. Vertical stripes indicate local-to-regional swell arrivals. Damping of swell by sea ice (white circle) reduces the forcing and subsequent response of the RIS. (b) Difference spectral levels formed by removing the mean spectrum over the time period shown from all spectra. Note that the slopes of many of the dispersion trends in the IG band at frequencies below 0.03 Hz are very similar to the dispersion of the extreme swell event identified in (a) which is also pronounced here indicating North Pacific IG wave generation regions are dominant in the IG band. (c, d) Coherence between the vertical and (c) north–south (N–S) and (d) east–west (E–W) components at RIS2.

The highest-amplitude signal at RIS2 during November 2005–May 2006 in the swell band (Fig. 2a, black circle) resulted from North Pacific swell that likely had wavefronts approximately parallel to the front of the RIS (Reference Bromirski, Sergienko and MacAyealBromirski and others, 2010). This long-period swell had very low amplitude on the order of centimeters (MacAyeal and others, 2006). Because other similar long-period North Pacific and higher-amplitude regional swell also impacted the RIS during this time period but produced a smaller response, this suggests that swell angle is important in the response of the RIS, i.e. the length of the RIS front nearly simultaneously illuminated by incident long-period swell affects the RIS response, with the area factor having an impact similar to that observed for the generation of microseism energy (Reference Bromirski, Duennebier and StephenBromirski and others, 2005b). This also suggests that obliquely arriving swell propagating along the shelf front may excite portions of the front differentially, potentially allowing identification of more responsive shelf segments that may indicate zones of weakness.
Infragravity waves
IG waves are generated by the nonlinear transformation of long-period ocean swell in shallow coastal waters (Reference Herbers, Elgar and GuzaHerbers and others, 1995; Reference WebbWebb, 2008; Reference Bromirski and GerstoftBromirski and Gerstoft, 2009) to much longer coastally trapped edge waves, with a portion of the IG wave energy leaking off continental shelves and becoming freely propagating long waves that radiate from these coasts. Reference Bromirski and GerstoftBromirski and Gerstoft (2009) determined that the Pacific coast of North America is an important IG wave generation region. The Patagonian coast is also likely a significant IG wave source area (Reference Webb, Zhang and CrawfordWebb and others, 1991) and IG waves originating there may have played an integral role in triggering the collapse of the Wilkins Ice Shelf (Reference Bromirski, Sergienko and MacAyealBromirski and others, 2010). Refraction of IG wave energy from the Pacific coast of South America to the RIS may be an important factor, especially in the austral winter when wave activity in the Southern Ocean is heightened and the Patagonian coast is subjected to extreme waves.
In contrast to swell, IG waves have much longer wavelengths (>15 km), resulting in a proportionately greater percentage of the lower-amplitude (several centimeters at most compared with several meters for swell) IG wave energy penetrating the sub-shelf water cavity. Modeling suggests that IG waves generate flexural stresses, the amplitude of which decays away from the ice-front edge, with scale lengths varying from tens of kilometers for ocean swell to hundreds of kilometers for IG waves (Reference Bromirski, Sergienko and MacAyealBromirski and others, 2010; Reference SergienkoSergienko, 2010). Consistent with modeling studies, gravimeter data indicate that IG-wave-induced signals are detected near the grounding line (Reference Williams and RobinsonWilliams and Robinson, 1979), indicating that either IG-wave-induced flexural stresses propagate from the ice front or are generated nearby by IG wave energy penetrating the sub-ice-shelf water cavity, or both.
The response of the RIS to IG wave arrivals during austral summer (Fig. 2a and b; November 2005–May 2006) at Nascent was readily identified in characteristic vertical component seismic spectra (Reference Bromirski, Sergienko and MacAyealBromirski and others, 2010). The consistency of the dispersion trend slopes in the IG waveband at frequencies less than 0.02 Hz (Fig. 2b) indicates that most of the IG wave energy reaching the RIS has a common generation region along the Pacific coast of North America, north of Cape Mendocino (Reference Bromirski and GerstoftBromirski and Gerstoft, 2009; Reference Bromirski, Sergienko and MacAyealBromirski and others, 2010). IG-wave-induced RIS spectral amplitudes are much less affected by sea-ice damping, indicated by no substantial change in mean spectral levels below ~0.02 Hz during April (Fig. 2a). During the austral summer when sea ice is at a minimum, spectral amplitudes of IG-wave-induced signals are about a factor of 3 greater than swell, but that ratio increases to about 15 or higher during periods when sea ice is present (Fig. 2a, white oval), which preferentially damps swell energy.
Coherence variability and implications
Because rifts, crevasses and cracks are preferentially oriented parallel to the ice front (Reference Peters, Blankenship, Smith, Holt and KempfPeters and others, 2007), significant anisotropic strength at long length scales is likely. Although crevasse orientation at shear margins can vary, changes in anisotropic ice-shelf response associated with the dominant fracture orientation may be a useful proxy to monitor changes in ice-shelf integrity and can be investigated by coherence analysis between vertical and horizontal seismometer channels. Signal coherence between two time series is analogous to the conventional correlation coefficient and is determined from the square of the cross spectrum normalized by the product of their auto-spectra. Reasonably well-defined bands of high coherence between the vertical and horizontal N–S channels are continuously observed for IG waves (<0.03 Hz), long-period swell (0.04– 0.07 Hz) and near 0.1 Hz. The 0.1 Hz coherence bands occur when sea ice has retreated, and may result from ice-shelf resonances associated with the structure of the ice-shelf/sub-ice-shelf system in response to long-period swell impacts. Of note is the consistently strong coherence in the IG waveband at frequencies less than 0.03 Hz throughout the data period (Fig. 2c), consistent with minimal sea-ice damping of IG waves.
A lower-coherence band spanning 0.03–0.04 Hz demarcates the transition from long-period swell to IG wave forcing. A more pronounced difference in coherence between vertical and N–S and E–W components, respectively, is observed in the long-period swell band (about 0.040–0.065 Hz) compared with the IG waveband. This difference is consistent with swell impacts along the ice front at relatively nearby locations producing dominant N–S motions propagating away from the front, while the much longer wavelengths associated with IG waves produce signals that are less directional. Another possibility is that E–W motions of the largely detached Nascent Iceberg produce a greater contribution to the response in the IG band than in the long-period swell band. However, Reference Kirchner and BentleyKirchner and Bentley (1979) have shown that anisotropy appears to be a common characteristic of elastic signal propagation across much of the RIS, indirectly suggesting that the nearby rift does not make a major contribution to the observed anisotropy. Multiple stations would be needed to determine the distribution of gravity-wave-induced signal levels across the RIS and their propagation characteristics.
Analysis of the Nascent Iceberg seismic data shows higher coherence between the vertical and N–S horizontal components compared with the vertical and E–W components (Fig. 2c and d). This coherence difference strongly suggests an anisotropic response, which is consistent with azimuthal differences in compressional and shear wave velocities determined from seismic refraction data collected on the RIS (Reference Kirchner and BentleyKirchner and Bentley, 1979). Tilt contamination was not considered in this analysis, but similar spectral amplitudes and variability of the E–W and N–S horizontal responses (not shown) suggest that tilt effects are not that significant and that most of the differences in coherence observed result from the characteristics of the dominant forcing originating along the ice front.
RIS Spectral Response Characteristics
Comparative spectra
The relative impact of gravity waves on the RIS response can be estimated by comparison of the seismic data collected at RIS2 with nearby Antarctic land-based seismic stations (Figs 3–5), with mean spectral levels at tabular iceberg B15A providing further comparisons. SBA, the permanent seismic station at Scott Base on Ross Island (Fig. 1), provides a long-term reference with which to compare RIS-collected seismic data and to establish the relationship between IG-wave-forced RIS signals and associated signals at SBA. VNDA, located relatively nearby but situated near Lake Vanda in the Dry Valleys, is thus removed from ‘direct’ contact with the RIS, unlike SBA.
Comparison of mean vertical component particle acceleration austral summer (January–February) 2006 spectral levels at SBA (red), VNDA (green) and RIS2 (dark blue). Also shown are austral winter (August–September) 2006 mean spectra at SBA (magenta) and VNDA (black). Mean spectral levels at tabular iceberg B15A (cyan) during January–February 2005 are similar to those at RIS2, in contrast to those at land-based seismic stations SBA and VNDA. Resonance spectral peaks at RIS2 centered near 0.5, 1.0 and 1.75 Hz (blue arrows) correspond to those shown in Figure 5, with similar peaks at B15A but at lower frequencies

(a, b) Vertical component acceleration spectral levels during the time period spanning the Sendai–Tohoku (Japan) earthquake, during March 2011, (a) at Scott Base Station (SBA) on Ross Island and (b) near Lake Vanda in the Dry Valleys (VNDA) about 100 km inland from SBA. The high-amplitude broadband signals are the earthquake seismic surface wave arrivals, with the tsunami-induced signals in the IG waveband (circles) indicating that the signal amplitudes at SBA are significantly greater than those observed at VNDA. (c, d) Percentile spectral levels at (c) SBA and (d) VNDA for the time period 1 March to 15 April 2011. The IG waveband and a reference spectral level common in (c) and (d) (brown lines) show that IG waveband quantile levels at SBA are ~10 dB higher than at VNDA.

(a) Vertical acceleration response of the RIS front at RIS2, showing a prominent resonance response centered near 0.5 Hz that persists even after swell forcing is mostly damped by sea ice during April. Other resonance bands are visible near 1.0 and 1.75 Hz. Note the broadband transient responses associated with local-to-regional high-amplitude swell arrivals that extend to frequencies well above the typical upper bound of the gravity-wave forcing band (about 0.3 Hz; Reference Bromirski, Flick and GrahamBromirski and others, 1999), similar to those identified by Reference MartinMartin and others (2010) as fragmentation fracture signals, suggesting that these signals may result from icequakes forced by gravity-wave impacts. (b, d) Percentile spectra during the February and April time periods shown in (a). Percentile levels give an indication of the seasonal persistence of respective resonance bands. There is about a 30 dB drop from February to April levels in both the swell (red arrows) and apparently swell-enhanced 0.5 Hz (black arrows) resonance bands. In contrast, the levels in the IG waveband remain largely unchanged, indicating that IG waves are not appreciably damped by sea ice. Note the appearance in (d) of the 10 Hz peak during April (blue arrow). (c) Coherence between the vertical and N–S seismometer components at RIS2. Note the significant change in coherence when sea-ice damping advances during April, with enhancement of coherence near 10 Hz that is consistent with the appearance of the 10 Hz peak in (d).

The swell spectrum is centered near 0.065 Hz for all stations, including B15A, indicating that these stations receive similar seasonally averaged gravity-wave forcing (Fig. 3). The austral winter and summer mean single-frequency (primary) microseism levels centered near 0.065 Hz have very similar amplitudes at both SBA and VNDA (Fig. 3 and 4, swell). This indicates that both stations have a comparable response to seismic surface wave signals. However, RIS2 levels are about 8 and 5 orders of magnitude greater than VNDA at about 100 s (0.01 Hz) and at 17 s (0.065 Hz) periods, respectively. Only small differences are observed between mean winter and summer spectral levels at SBA in the IG waveband (Fig. 3), confirming that the much longer-period IG-wave-generated signals on ice shelves are not greatly damped by sea ice and that IG waves excite a mechanical response of the RIS throughout the year.
The elevated signal levels in the IG band at SBA (compared with VNDA) are analogous to those observed at RIS2. The proximity of SBA to the RIS allows a portion of the RIS IG-wave-generated signals to reach SBA, evident from the difference between SBA and VNDA. The IG waveband and the seismic ‘hum’ band overlap at periods from about 35 to 500 s (frequencies 2–35 mHz). The amplitudes at SBA are typically >10 dB higher than at VNDA in the IG waveband (Fig. 3 and 4). Because seismic hum signals propagate thousands of kilometers (Reference WebbWebb, 2008; Reference Bromirski and GerstoftBromirski and Gerstoft, 2009) and the signals in the IG waveband at SBA are not observed at VNDA (Fig. 3 and 4), this indicates that they are not seismic hum but are specific to SBA and the RIS and suggests that the observed differences between SBA and VNDA in the IG waveband levels result from ice-shelf-generated signals that do not reach VNDA. Thus the difference between RIS2 and VNDA gives an estimate of the ice-shelf response.
A strong relatively broad spectral peak is observed near 0.5 Hz at RIS2, with lesser peaks near 1.0 and 1.75 Hz (Fig. 3, blue arrows). Similar peaks are observed at B15A but at slightly lower frequencies (Fig. 3, cyan curve). Because comparatively little gravity-wave energy occurs above 0.3 Hz (Reference Bromirski, Flick and GrahamBromirski and others, 1999) and because these are not double-frequency microseisms at twice the swell peak, this peak is apparently a significant RIS response frequency that is likely related to ice-shelf structure. Two possible explanations are as follows. (1) The persistence of this 0.5 Hz peak suggests that this may be an eigenfrequency of the RIS. The peak at RIS2 may result from flexural stresses excited through nonlinear processes by swell energy penetrating the sub-ice-shelf cavity. Broadening of this band (Fig. 5a) may be caused by longer-period more energetic swell. (2) Similar resonance peaks appear in ocean bottom seismometer data and have been interpreted as shear wave resonances in the sea-floor sediments (Reference Godin and ChapmanGodin and Chapman, 1999; Reference Bromirski, Stephen and DuennebierBromirski and others, 2006). At 0.5 Hz the acoustic water wavelength is 3 km, so it is not unreasonable that the ice shelf, about 300 m thick over 600 m of water at the front, could be vibrating in response to resonances in the sub-sea-floor. An apparent shift in this peak to ~0.35 Hz at B15A may be related to different thickness, being free-floating and/or different water depth.
The other lesser spectral peaks (Fig. 3) may be related to semi-regular crevasse orientation and spacing, causing concentrations of energy associated with ‘band gaps’ in the RIS response spectra (Reference Freed-Brown, Amundson, MacAyeal and ZhangFreed-Brown and others, 2012). Similar lesser peaks are observed at B15A near 0.7 and 1.5 Hz, suggestive of either resonance phenomena controlled by different vertical ice structure than that for RIS2 and/or a different band gap response associated with somewhat different crevasse geometry. Elevated levels at B15A at frequencies below 0.007 Hz may result from ‘rocking’ of the free-floating tabular iceberg (Reference Goodman, Wadhams and SquireGoodman and others, 1980; Reference MacAyeal, Okal, Aster and BassisMacAyeal and others, 2009).
Because sea ice strongly damps ocean swell and double-frequency microseism signals observed on land are generated in coastal regions (Reference Bromirski and DuennebierBromirski and Duennebier, 2002; Reference Bromirski, Duennebier and StephenBromirski and others, 2005b), during the deep winter (August–September) double-frequency (secondary) microseism peaks centered near 0.12 and 0.22 Hz at SBA and VNDA (Fig. 3) must be generated remotely by wave–wave interactions at sea-ice-free coastlines. The source of these signals may be the Antarctic Peninsula, the Patagonian coast or the southern coast of Australia.
Tsunami-induced response
Similar to IG waveband signals, while the 11 March 2011 Sendai–Tohoku (Mw 9.0) tsunami signal was well recorded at SBA, it was absent at VNDA (Fig. 4a and b, circles). The tsunami-induced response of the RIS recorded at SBA is about 10 dB higher than corresponding spectral levels at VNDA (Fig. 4c and d), similar to the difference observed between SBA and VNDA for IG waves (Fig. 3). Signal characteristics at SBA further suggest that they are associated with ice-shelf resonances in the IG wave spectral band. Note that the amplitude of the resonances in the IG waveband at SBA for the tsunami is only a few dB larger than for the summer or winter mean levels (Fig. 3), suggesting that the response of the RIS to the tsunami was not much greater than for typical incident IG waves. The stresses induced by the tsunami arrival evidently caused a calving event (Reference Brunt, Okal and MacAyealBrunt and others, 2011), suggesting that IG wave arrivals may also have a similar impact.
Seasonal variability
Gravity-wave impacts elicit a much stronger response of the RIS during austral summer when swell is not damped by sea ice (Fig. 5a, at frequencies above those shown in Fig. 2a). Different resonance bands are excited at Nascent by gravity-wave impacts, notably near 0.5 Hz (Fig. 5a and b, black arrow; Fig. 3) even though little gravity-wave energy is present at these frequencies (e.g. Reference Bromirski, Cayan and FlickBromirski and others, 2005a). Stronger swell elicits a broader-band response centered near 0.5 Hz. A relatively strong swell event at the beginning of December 2005 shows the typical RIS response near the ice front to strong regional swell forcing. As the strong broader-band 0.5 Hz-centered response occurs only from long-period high-amplitude regional swell events, swell energy penetrating the sub-ice-shelf cavity may be inducing a flexural stress wave response. Associated icequake activity is inferred from the broadband energy that extends to frequencies well above the gravity waveband.
The 0.5 Hz excitation persists even in the apparent absence of swell impacts during April (Fig. 5a and d, black arrows), when swell is appreciably damped. This suggests that this strong spectral peak is likely structure-related, which may be due to local structure associated with the nearby rift or other intra-shelf structural discontinuities (Reference Kirchner and BentleyKirchner and Bentley, 1979). As most sea-swell energy is damped in April, the forcing of this response in the absence of swell may be either IG waves or tides. Whether this spectral band persists throughout the austral winter is unknown. Also note that the energy levels of the subdued spectral peak near 1 Hz drop by >20 dB from austral summer (Fig. 5b) to austral winter (Fig. 5d), respectively, effectively eliminating the associated coherence band in April (Fig. 5c).
Other less pronounced spectral peaks at Nascent are either structure-related or may result from other factors related to temperature changes that affect ice-shelf properties and associated signal propagation. Typical of these unexplained spectral peaks is the appearance of the 10 Hz peak in April (Fig. 5d, blue arrow) that is absent in February. Although surface melting and firn-layer seasonal variability seem unlikely to have a significant effect because of their shallow penetration depth (Reference Sergienko, MacAyeal and ThomSergienko and others, 2008), other factors, such as changes in the properties of the basal interface, could change signal propagation characteristics if their seasonal variability is significant.
Gravity-wave-induced fracture (icequake) signals
The generation of icequakes by incident swell impacts depends in part on swell amplitude, which in turn depends on storm intensity and the proximity of the swell generation region to the RIS. Icequakes are characterized by relatively broadband signals that are associated with the impact of high-amplitude long-period swell at the RIS front (Fig. 5a) and extend to frequencies well above 3 Hz (not shown). Their absence during April indicates that these broadband signals are swell-induced and likely result from icequakes. Because tilt effects are less significant at higher frequencies, both these broadband transients and higher-frequency coherence patterns (Fig. 5c) are likely not tilt artifacts. The spectral character of these signals (duration, energy distribution) is similar to signals observed prior to the fragmentation of B15A (Reference MartinMartin and others, 2010). Although obscured by the strong 0.5 Hz resonance peak, icequake energy may be significant at or below 0.5 Hz. Elastic waves produced by gravity-wave impacts and icequakes may experience appreciable intrinsic attenuation, depending on the peak frequency of the event. But recent iceberg seismographic deployments demonstrate that even small events should be detectable at ranges of several tens of kilometers (Reference BassisBassis and others, 2007; Reference MacAyeal, Okal, Aster and BassisMacAyeal and others, 2008a, Reference MacAyeal, Okal, Thom, Brunt, Kim and Blissb; Reference MartinMartin and others, 2010). Unfortunately, these broadband signals were not clearly detected at SBA, suggesting that either they attenuate relatively quickly or these signals are not well coupled to the solid earth.
Time-Domain Finite-Difference Modeling
In order to gain insight into the elastic wave behavior of ice shelves in shallow water, we apply the TDFD method to solve the elastic wave equation (Reference StephenStephen, 1988, Reference Stephen1990; Reference Stephen and SwiftStephen and Swift, 1994a; Reference Swift and StephenSwift and Stephen, 1994). The TDFD method computes the full elastic wave solution for a two-dimensional slice in the sagittal plane and allows volume heterogeneities and interface roughness on the scale of seismic wavelengths. Interface waves, which are especially important to understand the ice-shelf response, include: (1) Rayleigh waves on the free surface of the ice; (2) Stoneley/Scholte waves at the liquid–solid interface on the bottom of the ice; and (3) Lamb waves in the thin ice plate. The TDFD method can be augmented to include the effects of attenuation (anelasticity) of elastic signals if necessary (Reference Stephen and SwiftStephen and Swift, 1994b).
It is customary to treat ocean gravity-wave forcing and elastic waves as uncoupled systems. A clear case is when the frequency bands differ. For example, ice-shelf observations (Fig. 5) suggest that IG waves induce stresses in the ice that cause fracturing (icequakes), which is a source of elastic waves in a much higher-frequency band (0.05–10Hz or more). But uncoupling gravity waves from elastic waves is also valid in some cases where the frequency bands do not change. For example, IG waves on the ocean in the band 0.004–0.020 Hz directly load the sea-floor in shallow water, exciting Rayleigh waves and normal modes in the same frequency band (Reference WebbWebb, 2008; Reference Bromirski and GerstoftBromirski and Gerstoft, 2009). Since the ocean gravity waves have much lower phase velocities than the elastic waves, when modeling this process, IG wave forcing is introduced as a stationary source term to the elastic wave equation. So although it is possible to include gravity effects and gravity waves in the TDFD formulation, it is not necessary for many problems.
The response of a preliminary ice-shelf model (Fig. 6) of an idealized icequake in the 2–15 Hz band in a 300 m thick sheet of ice floating on 100m of water and overlying a typical oceanic crustal structure (Fig. 6c) demonstrates the application of the TDFD method. Snapshots of the compressional and shear wave fields 1.725 s after the icequake is initiated (Fig. 6a and b) show a complex pattern. Since seismic wavelengths in this band range from 100m in the water to ~2 km in ice, elastic waves propagating across the ice shelf will be influenced by the sub-shelf water cavity and by sea-floor properties. The snapshots clearly show that there is considerable elastic energy in the water cavity and in the sub-sea-floor at these frequencies. There is also significant converted shear wave energy in the bottom that reflects and refracts back into the ice shelf, tunneling through the water as P-waves. Figure 6d shows the transfer functions for similar models with ice thicknesses of 300 and 150 m. Prominent resonances are observed near 6 and 11 Hz, respectively. These preliminary results suggest that the resonance band at 10 Hz in Figure 5 could be an elastic wave resonance in the ice–water–sea-floor system.
TDFD model results for an icequake in a floating ice shelf over a 100 m sub-shelf water cavity. The time series of the source in particle velocity, analogous to acoustic pressure, has a Gaussian spectrum with a peak frequency of 10 Hz. (a, b) TDFD model snapshots of the (a) compressional and (b) shear wave field at 1.725 s for an icequake at zero range and 150 m depth. Considerable energy interacts with the sea-floor. For long-range propagation, compressional and converted shear wave reflections and refractions from the sea-floor affect the vibration of the ice shelf. (c) The structure of the model. The dark blue bar in the upper left corner is the ice sheet, extending out to 4 km (with Vp = 3800ms–1, Vs = 2194ms–1 and density of 917 kgm–3). The water layer (light blue) has a typical sound speed gradient, with a free surface (air: thin white bar in top right-hand corner). The ice thickness is 300 m and the water thickness below the ice is 100 m. The sea-floor consists of 100m of soft sediment (brown), 2 km of basalt with a typical crustal gradient (red) and 4 km of gabbro with a typical crustal gradient (not shown). (d) Transfer functions for two ice models similar to the model in (a–c), one with a 300 m thick ice shelf and one with a 150m ice shelf. The transfer functions are computed from time series at the surface of the model and are normalized for the source spectrum. Prominent resonances are observed near 6 and 11 Hz. These preliminary results suggest that the resonance band at 10 Hz (Fig. 5) could be an elastic wave resonance in the ice–water–sea-floor system that is excited by icequakes forced by ocean gravity-wave impacts.
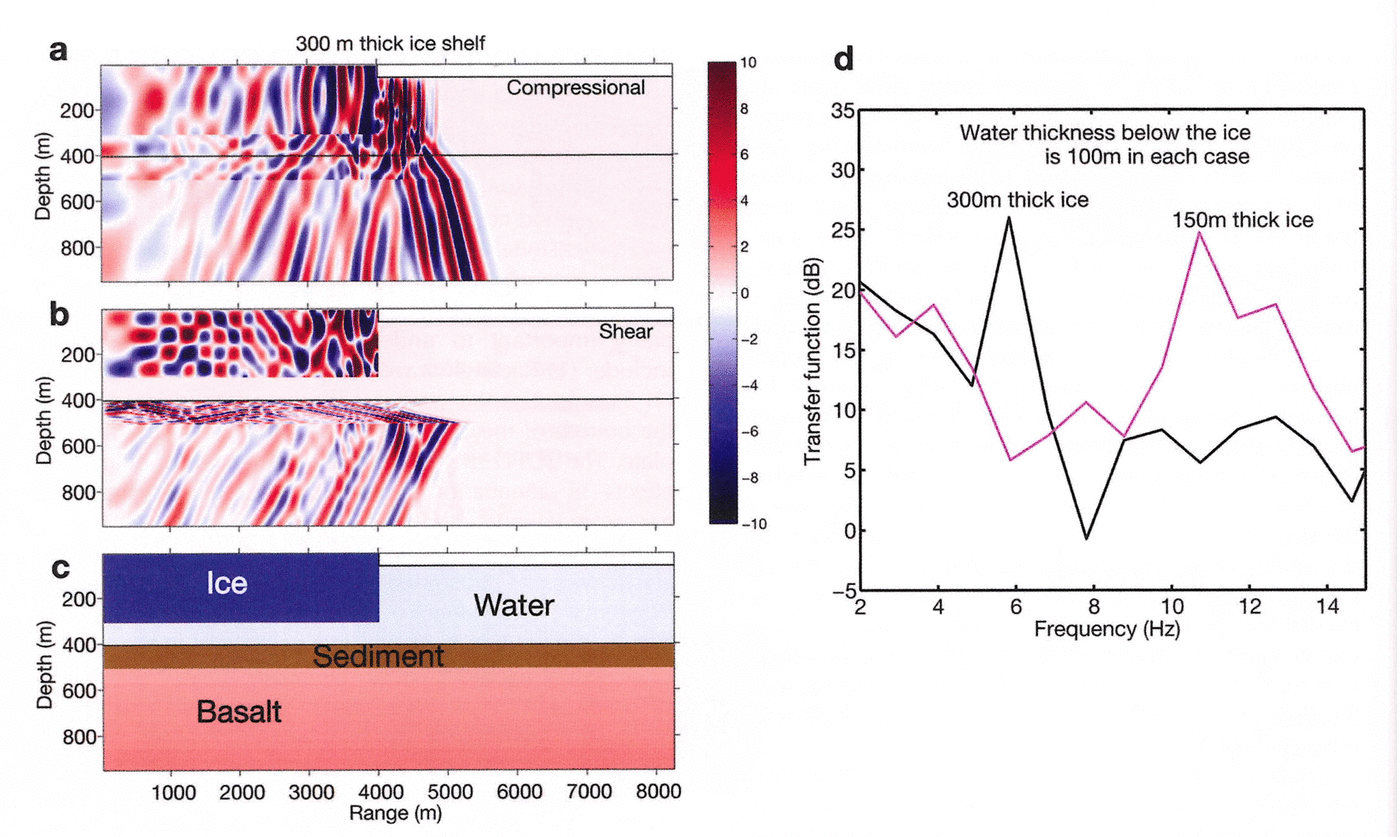
Young’s modulus and shear modulus are useful proxies for the strength of the ice shelf over short timescales. Through forward modeling of the complex system with TDFD methods, compressional and shear wave velocities of the ice can be inferred from the resonance frequencies and the moduli can be determined in turn from the usual relationships with the velocities and density (e.g. table 4 of Reference BirchBirch, 1961). For the model ice parameters in Figure 6a–c, Young’s modulus is 11GPa and the shear modulus is 4.4 GPa. This Young’s modulus is comparable to commonly accepted values for ice at –5˚C (Reference Scambos, Sergienko, Sargent, MacAyeal and FastookScambos and others, 2005), but is about an order of magnitude larger than values determined from some ice-shelf and laboratory studies (Reference VaughanVaughan, 1995). Analyzing and modeling multi-station seismic data would allow determination of the spatial variability of the RIS elastic moduli.
Discussion
Projections of increasing atmospheric storm intensity and frequency, ranging from extratropical cyclones to hurricanes (typhoons), suggest that ocean wave amplitudes may also increase as the global climate system warms (Reference Bromirski, Cayan and FlickBromirski and others, 2005a; Reference Bromirski and KossinBromirski and Kossin, 2008). At least two factors contribute to the hypothesized positive feedback loop between global warming, gravity-wave amplitudes and their impact on Antarctic ice shelves. First, because sea ice attenuates swell, continuation of the long-term trend of the reduction of sea ice surrounding Antarctica (e.g. Dela Mare, 1997; Reference Curran, Van Ommen, Morgan, Phillips and PalmerCurran and others, 2003) will result in increased gravity-wave energy impacting ice shelves for more of each year. Second, ocean waters free of sea ice are a prerequisite for swell generation by regional storms. As sea-ice cover diminishes, more swell energy from distant storms will impact the ice shelves and there will be more swell energy generated in regional storms. In essence, a significant consequence of global warming may be that both the seasonal duration and the magnitude of swell energy reaching the ice shelf will increase. Larger, more intense storms also generate more long-period gravity-wave energy, which more easily penetrates the RIS sea-ice buffer. In particular, larger more energetic North Pacific winter storms (Reference Bromirski, Cayan and FlickBromirski and others, 2005a) will generate more swell and IG wave energy that will reach the RIS during the austral summer when sea ice is absent (Reference MacAyealMacAyeal and others, 2006; Reference Bromirski, Sergienko and MacAyealBromirski and others, 2010).
The primary data sources for this study are the RIS1 and RIS2 seismometer data located relatively near the RIS front and close to a propagating rift system near the ‘hinge’ of the Nascent Iceberg. This geometry may be responsible for some of the anomalous signals observed, perhaps causing hinge effect resonances that appear as spectral and coherence peaks in the RIS2 response. However, because the ice structure of B15A is likely similar to that near the RIS seismic station, the similarity of the responses of B15A and RIS2 (Fig. 3) suggests that the measured responses are characteristic of free-floating tabular icebergs. Alternatively, the observation of IG-wave-forced ice-shelf-related signals at SBA (distant from RIS2) suggests that either these signals propagate to SBA from the front or they are excited more local to SBA and are not specific to the Nascent site. They may be the typical response of the RIS and shelf cavity system. This also suggests that the ice-shelf/water-cavity system structure is necessary to produce the response observed at SBA in the IG band and that SBA IG waveband variability could be used as a proxy or baseline station to assess changes in the response of the RIS to IG wave forcing. However, the single RIS2 station data are not sufficient to resolve this issue.
Peaks in the 50–350 s period band (0.02–0.004 Hz) (Fig. 3) at RIS2 may result from resonances associated with the structure of the ice-shelf/water-cavity system. The local response of the ice shelf to IG waveband energy may vary as IG waves penetrate further into the sub-ice-shelf cavity and the water depth shallows as the grounding line is approached (Reference SergienkoSergienko, 2010). Evidently, as Reference Brunt, Okal and MacAyealBrunt and others (2011) demonstrated, tsunami arrivals have sufficient energy to trigger calving events. Because tsunamis cause a similar response at SBA to that caused by IG waves in that band (Fig. 4c), this suggests that regular IG wave impacts could have a similar effect, as well as expanding existing crevasses.
Both thermodynamic changes and mechanical changes relevant to ice-shelf stability affect gravity-wave-induced strain and elastic wave signal propagation across ice shelves. Interpreting the propagation characteristics of mechanical strain through the ice-shelf/sub-shelf water cavity/basement system can be used to monitor changes in ice-shelf integrity (Reference MacAyealMacAyeal and others, 2006). Free water at the surface of an ice shelf (influenced primarily by the changing thermodynamic environment) is considered a key precondition required to reduce ice-shelf integrity leading to explosive collapse (Reference ScambosScambos and others, 2009). Although the RIS shows frequent surface melting during warmer summers (Reference Scambos, Hulbe, Fahnestock and BohlanderScambos and others, 2000), it is unlikely that there is sufficient free water to substantially affect signal propagation across the RIS. However, seasonally elevated spectral-level banding near 10 Hz is observed near the front of the RIS (Fig. 5). Since these variations are seasonal, it is reasonable to expect that they are temperature-related. However, instrument or installation problems are a potential explanation for any anomalous signals observed.
Basal changes are another possible cause for the observed seasonal increases in resonance band spectral levels near 10 Hz in the absence of swell. However, seasonal changes in the basal layer remain to be determined. Seismic data collected at the surface of the ice shelf may prove to be a means of monitoring such changes indirectly.
IG wave forcing may vary along the ice front as a result of focusing and defocusing of incident IG wave energy by continental shelf topography below the Ross Sea. This along-shelf response variability could be illuminated by data from a near-ice-front seismic array, allowing source localization by array beam-forming and other array-processing methodologies (e.g. Reference Gerstoft, Sabra, Roux, Kuperman and FehlerGerstoft and others, 2006), for both swell and IG waveband signals as well as for broadband icequakes. Accurate localization of RIS icequakes and their spectral characteristics during both summer and winter is important to infer ice-shelf properties and the evolution of shelf integrity from changes in their propagation characteristics.
Conclusions
The response of the RIS to IG wave and swell impacts in their respective bands is several orders of magnitude greater than that observed at nearby land-based seismic stations SBA and VNDA. The absence of ice-shelf-related signals in the IG waveband at VNDA that are observed at nearby SBA indicates that these are not seismic hum but are related to the response of the RIS to IG wave forcing. A spectral peak at near-ice-front seismic station RIS2 centered near 0.5 Hz is strongly enhanced by high-amplitude swell impacts, but also persists during April when swell is damped by sea ice, suggesting that this peak may be a dominant resonance frequency of the RIS. Other higher-frequency spectral peaks imply a complicated response of the RIS to gravity-wave forcing. High-amplitude swell events excite relatively broadband signals that are likely fracture events (icequakes). Changes in coherence between the RIS2 vertical and horizontal sensors in the 8–12 Hz band from February to April, combined with the appearance of a spectral peak near 10 Hz in April when sea ice damps swell, suggest that lower (higher) temperatures during austral winter (summer) months affect signal propagation characteristics and hence mechanical properties of the RIS. Additional seismic data are needed to characterize the mechanical properties of the RIS and its response to ocean forcing.
Acknowledgements
Support for this study for P.B. from the California Department of Boating and Waterways, US National Oceanic and Atmospheric Administration (NOAA) grant NA10OAR4310121 and US National Science Foundation grant OCE1030022 is gratefully acknowledged. Support for R.S. was provided by the Edward W. and Betty J. Scripps Chair for Excellence in Oceanography at Woods Hole Oceanographic Institution. We thank the Incorporated Research Institutions for Seismology (IRIS) Data Management Center (DMC) for archiving and distributing the seismic data from the IU, GT and XV networks used in this study. We thank Doug MacAyeal for his inspiration, guidance, comments and collection of the RIS Nascent data, without which this study would not have been possible. We also thank Olga Sergienko, Scientific Editor Ted Scambos and two anonymous reviewers for helpful comments. We appreciate Tom Bolmer’s help in preparing Figures 1 and 6.



