

Introduction
Faultline theory suggests that a team is likely to split into several subgroups if team members’ demographic attributes align, and the hypothesised lines that divide these subgroups are termed ‘team faultlines’ (Lau & Murnighan, Reference Lau and Murnighan1998). As originally proposed by Lau and Murnighan (Reference Lau and Murnighan1998) on the basis of the social categorisation process, faultlines are generally considered to have negative influences on team processes and outcomes (e.g., Lau & Murnighan, Reference Lau and Murnighan2005; Li & Hambrick, Reference Li and Hambrick2005). However, several scholars argue that team faultlines may also confer benefits because team members receive clear support within subgroups (Gibson & Vermeulen, Reference Gibson and Vermeulen2003) and form accurate expectations of other members based on their subgroup identities (Bezrukova, Jehn, Zanutto, & Thatcher, Reference Bezrukova, Jehn, Zanutto and Thatcher2009). However, the potentially positive side of team faultlines has rarely been captured, with most empirical evidence demonstrating their negative effects (Thatcher & Patel, Reference Thatcher and Patel2011).
Why are the benefits of team faultlines so difficult to capture? We propose in this study that the difficulty arises from the lack of a configurational perspective in previous research, that is, from the failure to regard a team split by faultlines as a configuration. In previous research, the faultline phenomenon has largely been described with only a single calculated index (i.e., faultline strength), which ignores the possibility that the subgroups within teams with faultlines may exhibit a variety of configurations. However, when a team splits into subgroups, in addition to faultline strength both the number and the balance of subgroups are important factors in team processes and outcomes (Carton & Cummings, Reference Carton and Cummings2013). Accordingly, split teams may feature complex configurations even when faultline strength remains constant. For instance, the interactions within a team containing two imbalanced subgroups will differ from those within a team containing three balanced subgroups (e.g., O’Leary & Mortensen, Reference O’Leary and Mortensen2010; Carton & Cummings, Reference Carton and Cummings2013). Hence, the subgroup configuration should be considered adequately in analysing the effects of faultline strength. We refer to the combination of faultline strength, number of subgroups, and balance of subgroups as ‘faultline configuration’, and further propose that whether faultline strength has positive influences on team outcomes depends on the other two properties of faultline configuration. Therefore, the effects of team faultlines cannot be explained clearly unless we regard the properties of faultline configuration as a whole and improve faultline theory using the configurational perspective.
Our aim in this study is thus to examine the relationship between team faultline configuration and the outcomes in the top management team (TMT) context (e.g., Cooper, Patel, & Thatcher, Reference Cooper, Patel and Thatcher2013). Drawing on upper echelons theory (Hambrick & Mason, Reference Hambrick and Mason1984), we choose firms’ short-term performance and innovation activities as our outcomes, as the influences of faultlines on performance and innovation may differ. Briefly, we propose that TMT faultline strength is positively related to a firm’s short-term performance when both the number and the balance of subgroups are high and that TMT faultline strength is positively related to a firm’s innovation activities when the number of subgroups is high and the balance of subgroups is low.
Moving beyond a solo explanation of faultline strength, we investigate multiple properties of faultline configuration from the configurational perspective to better understand the faultline phenomenon in its entirety. Further, because the positive aspects of team faultlines have been theoretically posited but not empirically supported (Thatcher & Patel, Reference Thatcher and Patel2011), we offer a solution to the controversy over whether team faultlines can truly be beneficial, as we clarify the positive effects of team faultlines through the dual routes (efficiency and innovation) of faultline mechanisms in the context of subgroup configurations. We conclude that the number and the balance of subgroups simultaneously serve as necessary conditions for faultline strength to exert benefits, thereby adding new knowledge to faultline theory.
In the remainder of this paper, we first review the controversy in faultline research regarding the beneficial effects of team faultlines, introduce the important role played by faultline configuration and elaborate upon the effects of TMT faultlines on firm outcomes. Our hypotheses are then tested using secondary data from the information technology (IT) industry, and the study’s results are explained. Finally, we discuss the contributions and limitations of the study and offer directions for future research.
Theory and Hypotheses
Team faultlines: overcoming the divergence between theoretical expectations and empirical findings from the configurational perspective
Subgroups commonly exist in work teams given the prevalence of project teams and cross-functional teams. Both management researchers and practitioners are therefore concerned about the consequences of faultlines in such teams. Lau and Murnighan (Reference Lau and Murnighan1998) originally proposed that team faultlines reflect a negative process of social categorisation that leads to in-group favouritism within subgroups, resulting in detrimental effects on team interactions and outcomes (e.g., Lau & Murnighan, Reference Lau and Murnighan2005; Li & Hambrick, Reference Li and Hambrick2005). Scholars drawing on the perspectives of social identity theory and self-categorisation theory expect strong faultlines to trigger inter-subgroup bias, cause destructive conflicts, disrupt team cooperation, and harm final performance (Lau & Murnighan, Reference Lau and Murnighan2005; Molleman, Reference Molleman2005; Choi & Sy, Reference Choi and Sy2010). Most studies of TMT faultlines also agree that strong faultlines exert a negative influence on TMT interaction and firm performance (e.g., Li & Hambrick, Reference Li and Hambrick2005; Barkema & Shvyrkov, Reference Barkema and Shvyrkov2007; Van Knippenberg, Dawson, West, & Homan, Reference Van Knippenberg, Dawson, West and Homan2011). The negative effects of team faultlines on team cohesion and performance have also been confirmed in meta-analysis carried out by Thatcher and Patel (Reference Thatcher and Patel2011).
However, optimal distinctiveness theory (Brewer, Reference Brewer1991) indicates that an individual must maintain a balance between the demands of assimilation and distinctiveness, both of which can be met in a team comprising subgroups with in-subgroup similarities and inter-subgroup differences. Thus, in theory, faultlines should have some positive effects for teams. For instance, team members may be supported by their fellow members within the same subgroup and thus feel safe in expressing opinions, which can in turn facilitate team learning (Gibson & Vermeulen, Reference Gibson and Vermeulen2003). Furthermore, a sense of mutual positive distinctiveness may emerge based on expectations derived from subgroup prototypes (Cramton & Hinds, Reference Cramton and Hinds2004; Bezrukova et al., Reference Bezrukova, Jehn, Zanutto and Thatcher2009). There is also some evidence of the positive effects of faultlines in TMTs (e.g., Cooper, Patel, & Thatcher, Reference Cooper, Patel and Thatcher2013). For example, weak faultlines can be beneficial for the expression and discussion of divergent ideas (Tuggle, Schnatterly, & Johnson, Reference Tuggle, Schnatterly and Johnson2010), and task-related faultlines may help to build a shared understanding of the expertise among members and stimulate the information elaboration process (Hutzschenreuter & Horstkotte, Reference Hutzschenreuter and Horstkotte2013).
From the perspectives of these two theoretical streams, team faultlines have opposing effects through different mechanisms, but the positive side of faultlines has not been sufficiently explored, with only minimal empirical evidence gathered thus far (Thatcher & Patel, Reference Thatcher and Patel2011). The divergence between theoretical expectations and empirical findings suggests that team faultlines are a subject worthy of further explanation. We suggest that this divergence partially stems from the fact that faultline strength, the only index studied in nearly all previous studies (e.g., Bezrukova, Thatcher, Jehn, & Spell, Reference Bezrukova, Thatcher, Jehn and Spell2012; Rico, Sánchez-Manzanares, Antino, & Lau, Reference Rico, Sánchez-Manzanares, Antino and Lau2012), cannot depict the whole picture of team faultlines; hence, we attempt to address this problem from the configurational perspective by investigating the multiple properties of faultline configuration in an integrative model.
Team faultlines derive from the combinations of team members’ demographic attributes (Lau & Murnighan, Reference Lau and Murnighan1998), which lead to complex configurations. In addition to varying levels of faultline strength, split teams also vary in their number and size of subgroups (O’Leary & Mortensen, Reference O’Leary and Mortensen2010; Carton & Cummings, Reference Carton and Cummings2013). Therefore, team faultlines are configurational phenomena that need to be described in full using multiple variables, of which faultline strength is but one.
The configurational perspective requires scholars to pay close attention to the differences among team members and to the structure that results from the distribution of those differences within a team (Klein & Kozlowski, Reference Klein and Kozlowski2000). In a faultline situation, there are significant distinctions between subgroups, with the members of each subgroup thinking and behaving differently with shifts in the subgroup number or balance (e.g., O’Leary & Mortensen, Reference O’Leary and Mortensen2010; Carton & Cummings, Reference Carton and Cummings2013; Meyer, Schermuly, & Kauffeld, Reference Meyer, Schermuly and Kauffeldin press). Hence, there are limitations in using the strength index to view faultlines as a description of the entire team. According to the configurational perspective, the subgroup configuration must also be considered.
That configuration has implications for team member interactions. Team members do not typically interact with one another as independent individuals; rather, they interact with the identities of the subgroups to which members belong based on their demographic attributes (Lau & Murnighan, Reference Lau and Murnighan1998; Cramton & Hinds, Reference Cramton and Hinds2004; Li & Hambrick, Reference Li and Hambrick2005). Hence, because the interaction between subgroups truly determines a team’s outcome, it is only by determining the patterns of subgroup interaction that we can fully understand how team structure affects team outcomes. Accordingly, we expect the effects of faultline strength to differ with different subgroup configurations. In other words, faultlines are expected to be beneficial only in specific contexts of subgroup configuration, as further explained below.
Uncovering the positive side of faultlines: the role of subgroup configuration
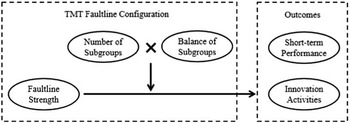
We build our hypotheses in the TMT context because the effects of faultlines in TMTs and boards have been of interest to scholars in recent years (e.g., Barkema & Shvyrkov, Reference Barkema and Shvyrkov2007; Tuggle, Schnatterly, & Johnson, Reference Tuggle, Schnatterly and Johnson2010; Van Knippenberg et al., Reference Van Knippenberg, Dawson, West and Homan2011; Kaczmarek, Kimino, & Pye, Reference Kaczmarek, Kimino and Pye2012; Cooper, Patel, & Thatcher, Reference Cooper, Patel and Thatcher2013; Hutzschenreuter & Horstkotte, Reference Hutzschenreuter and Horstkotte2013; Ndofor, Sirmon, & He, Reference Ndofor, Sirmon and Hein press; Veltrop, Hermes, Postma, & De Haan, Reference Veltrop, Hermes, Postma and De Haan2015). We expect that TMT faultlines affect team coordination and information processing through differing mechanisms, which should be analysed separately under various types of subgroup configuration. Thus, we investigate the interaction effects of three properties of TMT faultline configuration – faultline strength, number of subgroups and balance of subgroups – on two outcomes: firms’ short-term performance and innovation activities. The theoretical model guiding the study is displayed in Figure 1.
The theoretical model

The relationship between TMT faultlines and short-term performance: the efficiency-oriented route
Faultline strength represents the alignment of demographic attributes within each subgroup and the distinction between subgroups (Lau & Murnighan, Reference Lau and Murnighan1998; Carton & Cummings, Reference Carton and Cummings2013). Stronger faultlines are associated with more salient subgroup characteristics and with the greater ease of identifying such characteristics (Bezrukova et al., Reference Bezrukova, Jehn, Zanutto and Thatcher2009). In a team consisting of members with rich experience and strong cognitive abilities, such as a TMT, reaching consensus on mutual positive distinctiveness is highly likely (Cramton & Hinds, Reference Cramton and Hinds2004; Cooper, Patel, & Thatcher, Reference Cooper, Patel and Thatcher2013). Because people tend to link others to the prototypes of the subgroups to which they belong (Hogg & Terry, Reference Hogg and Terry2000), salient subgroups can assist in forming accurate expectations of the behaviour of other team members (Webber & Donahue, Reference Webber and Donahue2001). In a TMT with strong faultlines owing to clear subgroup division, members can generate expectations of others with the assistance of subgroup prototypes, and then adjust their own behaviour to obtain a high level of coordination (Wittenbaum, Stasser, & Merry, Reference Wittenbaum, Stasser and Merry1996; Rico, Sánchez-Manzanares, Gil, & Gibson, Reference Rico, Sánchez-Manzanares, Gil and Gibson2008). Accurate expectations also prevent extreme behaviour caused by expectation violations (Phillips, Mannix, Neale, & Gruenfeld, Reference Phillips, Mannix, Neale and Gruenfeld2004), thereby yielding task fluency and efficiency improvements. Furthermore, because there are high levels of homogeneity within subgroups (Lau & Murnighan, Reference Lau and Murnighan1998), TMT coordination can be simplified from the individual level to the subgroup level, meaning that team members do not coordinate with one another individually but rather as subgroups. Team efficiency can thus be greatly improved as the complexity of team coordination is reduced.
However, the benefits of team faultlines cannot be realised in TMTs with certain types of subgroup configuration. More specifically, the positive mechanism of faultlines is likely to be blocked in team with a small number of subgroups or a low level of subgroup balance. A team with few subgroups always has a competitive atmosphere (Harrison & Klein, Reference Harrison and Klein2007; Carton & Cummings, Reference Carton and Cummings2012) in which members do not trust others with different subgroup identities (Polzer, Crisp, Jarvenpaa, & Kim, Reference Polzer, Crisp, Jarvenpaa and Kim2006) and are unwilling to cooperate. Consequently, in some teams, even if members could anticipate the behaviour of others, they would be unlikely to adjust their own behaviour to enhance coordination.
In a team with imbalanced subgroups, a larger subgroup may ignore a smaller subgroup in collaborative activities (De Jong, Van der Vegt, & Molleman, Reference De Jong, Van der Vegt and Molleman2007; Van der Vegt, De Jong, Bunderson, & Molleman, Reference Van der Vegt, De Jong, Bunderson and Molleman2010), thereby violating the sense of mutual positive distinctiveness. The members of the larger subgroup may have no expectations concerning the members of the smaller subgroups or may fail to adjust their behaviour, thereby damaging team coordination (Rico et al., Reference Rico, Sánchez-Manzanares, Gil and Gibson2008; O’Leary & Mortensen, Reference O’Leary and Mortensen2010).
In summary, strong faultlines in TMTs may increase the accuracy of behavioural expectations and decrease the difficulty of coordination, thus facilitating the efficiency of the entire team, but only in TMTs with a large number of subgroups and a high level of inter-subgroup balance. In these conditions, TMT faultlines can prove beneficial to the coordination of TMT members by ensuring that all departments cooperate smoothly and that all resources are appropriately allocated, thereby promoting the short-term performance of a firm (Carmeli & Schaubroeck, Reference Carmeli and Schaubroeck2006; Carmeli, Reference Carmeli2008).
Hypothesis 1: The effect of TMT faultline strength on a firm’s short-term performance is moderated by the combination of the number and the balance of subgroups: faultline strength positively influences short-term performance only when there is a large number of subgroups and a high level of inter-subgroup balance.
The relationship between TMT faultlines and innovation activities: the innovation-oriented route
The innovation activities of a firm depend primarily on the innovation of its TMT (West & Anderson, Reference West and Anderson1996). Because of concerns regarding interpersonal relationships, it is often difficult for an individual to express divergent opinions during team discussions (Edmondson, Reference Edmondson1999). Although TMT members typically have different insights on the issue under discussion because of their varying knowledge bases and business areas, those insights may be concealed and thus not utilised to boost team innovation (Connelly, Zweig, Webster, & Trougakos, Reference Connelly, Zweig, Webster and Trougakos2012). However, if faultlines clearly divide a TMT into several subgroups, then the team may benefit from the cohort effect, in which members may be supported by other members from the same subgroup when they express their views, and thus feel less stressed and safer when speaking out (Gibson & Vermeulen, Reference Gibson and Vermeulen2003). Moreover, views that are supported by others are less likely to be ignored because they tend to be repeated several times.
Similar to the case in Hypothesis 1, TMT faultline strength is not always positively linked to innovation. When the number of subgroups is low, team members perceive more threats to their subgroup identities (Polzer et al., Reference Polzer, Crisp, Jarvenpaa and Kim2006; Carton & Cummings, Reference Carton and Cummings2012). Accordingly, the task conflict that may be aroused by the presentation of diverse views is likely to be misattributed and to cause relationship conflicts, thus impeding team information processing (Simons & Peterson, Reference Simons and Peterson2000). When the number of subgroups is high, in contrast, the ‘enemy’ of each subgroup is ambiguous. Hence, members feel less threatened, and the diverse views arising from the cohort effect can be processed in a constructive manner, thereby stimulating team innovation.
Information sharing is only the first step in team innovation. Only by effectively integrating that information can a TMT propose a novel and practical innovation programme (Drach-Zahavy & Somech, Reference Drach-Zahavy and Somech2001; Phillips et al., Reference Phillips, Mannix, Neale and Gruenfeld2004; Gardner, Gino, & Staats, Reference Gardner, Gino and Staats2012; Xie, Wang, & Luan, Reference Xie, Wang and Luan2014). The integration process is also affected by the balance of subgroups. When subgroups are well balanced, they are evenly matched and exert equal influences on decision making, thus easily leading to deadlock (Phillips et al., Reference Phillips, Mannix, Neale and Gruenfeld2004; Carton & Cummings, Reference Carton and Cummings2012; Minichilli, Corbetta, & MacMillan, Reference Minichilli, Corbetta and MacMillan2010). In addition, in such a TMT, no one subgroup is sufficiently large to represent the entire team, meaning that no subgroup feels responsible for integrating. When subgroups are imbalanced, in contrast, the larger subgroup has a power advantage and thus seeks to push information processing forward and promote the integration of diverse views (Van der Vegt et al., Reference Van der Vegt, De Jong, Bunderson and Molleman2010; Bunderson & Reagans, Reference Bunderson and Reagans2011; Mell, Van Knippenberg, & Van Ginkel, Reference Mell, Van Knippenberg and Van Ginkel2014). Further, a more stable team power structure helps to temper the battle for power, enhance psychological safety and facilitate team learning (Bunderson & Boumgarden, Reference Bunderson and Boumgarden2010; Bresman & Zellmer-Bruhn, Reference Bresman and Zellmer-Bruhn2013). Therefore, a lack of inter-subgroup balance is a favourable factor for information integration and for subsequent team innovation.
In sum, strong TMT faultlines encourage the expression of diverse views, which can be elaborated upon and integrated into effective innovation only under the conditions of a large number of subgroups and a lack of balance among them. When there is a high level of innovation in a TMT, the firm is likely to engage in more innovation activities.
Hypothesis 2: The effect of TMT faultline strength on a firm’s innovation activities is moderated by the combination of the number and the balance of subgroups: faultline strength positively influences innovation activities only when there is a large number of subgroups and a low level of inter-subgroup balance.
Method
Sample
Our sample comprises publicly traded IT firms listed on the Shanghai and Shenzhen Stock Exchanges. We chose IT firms because firms in the IT industry typically need to simultaneously pursue short-term profits and invest regularly in research and development (R&D) (Davis & Eisenhardt, Reference Davis and Eisenhardt2011). China’s Growth Enterprise Market, which was established in 2009, changed the nature of competition in the country’s IT industry. Therefore, we collected data from 2009 to 2013, including data on the predictors from 2009 to 2012 and data on the criteria from 2010 to 2013. Using a firm’s industry code as a filter, we identified 521 observations. Firms in special treatment and those that did not disclose their R&D investments were excluded before. In accordance with the method adopted by Carton and Cummings (Reference Carton and Cummings2013), we omitted four observations with no subgroups and 164 observations with only one subgroup from our analyses, as the subgroup balance and faultlines were meaningless in these teams. Thus, our final sample comprised 353 teams from 153 firms. Demographic information on the sample firms’ top managers and data on their finance, operations and governance were collected from the China Stock Market & Accounting Research database and the annual reports of the firms.
Measures
Independent variables
TMT members were identified from the top manager lists in the firms’ annual reports. Our calculation of TMT faultline configuration was based on four demographic attributes: gender, age, education and tenure. Applying Meyer and Glenz’s (Reference Meyer and Glenz2013) algorithm and drawing on other related literature, we calculated faultline strength, number of subgroups and balance of subgroups for each TMT. Faultline strength was computed directly from the algorithm script; the original number of subgroups equalled the number of subsets containing two or more members; and balance of subgroups was obtained by computing the standard deviation of the subgroup sizes and then multiplying the result by −1 (O’Leary & Cummings, Reference O’Leary and Cummings2007; Carton & Cummings, Reference Carton and Cummings2013). With regard to the number of subgroups, the main differences in team interaction arise between situations with two subgroups and those with three or more subgroups (Carton & Cummings, Reference Carton and Cummings2013). Accordingly, we recoded the original number of subgroups into a dummy variable called number of subgroups, which was one of the independent variables used in the regressions, with a value of 0 (a small number of subgroups) representing two subgroups, and a value of 1 (a large number of subgroups) representing three or more subgroups.
Dependent variables
Firms’ short-term performance and innovation activities were measured by proxies of return on assets and the ratio of R&D investments to total assets as percentages, respectively, both of which are widely used in strategic management research (e.g., Hitt, Hoskisson, & Kim, Reference Hitt, Hoskisson and Kim1997; Cui & Mak, Reference Cui and Mak2002; Lin, Lee, & Hung, Reference Lin, Lee and Hung2006).
Control variables
The 10 following variables were chosen as control variables because of their potential effects on the dependent variables.
Diversities of gender, age, education and tenure
To find incremental explanations for faultlines beyond diversity, we controlled for these four demographic characteristics (e.g., Lau & Murnighan, Reference Lau and Murnighan2005). Gender diversity and education diversity were computed using Blau’s index, and age diversity and tenure diversity were represented by the standard deviations in the TMTs.
TMT size and firm size
We controlled for these two variables because they can influence team interaction patterns and firms’ strategic orientation (e.g., Cao, Simsek, & Zhang, Reference Cao, Simsek and Zhang2010). The original numbers of TMT members and firm employees were log-transformed to correct for skewness.
Chief executive officer duality
This variable showed whether the board chair and chief executive officer positions were held by the same person. As the leader of a TMT, a chief executive officer’s dominant logic may differ if he or she is also the board chair, thus affecting team interaction. Therefore, we controlled for this factor using a dummy variable that took a value of 1 if the individual in question was both the board chair and chief executive officer, and a value of 0 otherwise (e.g., Kor, Reference Kor2006).
Independent directors
Each TMT is supervised by a board. We thus controlled for the composition of the board (e.g., Kor, Reference Kor2006), namely, the ratio of independent directors to total directors on the board.
Growth strategy
This variable indicates whether a firm has a strategic orientation towards growing or downsizing (e.g., Richard, Reference Richard2000), and was proxied by the firm’s growth in total assets.
Financial slack
This variable represents idle resources that can be used for innovation activities (e.g., Kim, Kim, & Lee, Reference Kim, Kim and Lee2008), and was measured by the ratio of quick assets to liabilities.
Results
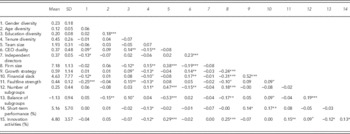
Descriptive statistics and correlations are displayed in Table 1. To test our hypotheses, we constructed panel data regression models of short-term performance (return on assets) and innovation activities (R&D/assets) using Stata 12.0 with the ‘xtreg’ package. This method is deemed suitable for our longitudinal data set, and is commonly used in analysing the influences of TMT characteristics on firm outcomes (e.g., Hutzschenreuter & Horstkotte, Reference Hutzschenreuter and Horstkotte2013; Ndofor, Sirmon, & He, Reference Ndofor, Sirmon and Hein press). The results of the Hausman test suggested that fixed-effects models were more appropriate than random-effects models for our data set (short-term performance: Model 4, χ2=46.95, p<.001; innovation activities: Model 4, χ2=35.83, p<.01). Following the principle of interaction effects testing (Baron & Kenny, Reference Baron and Kenny1986), we entered the control variables, independent variables, two-way interaction terms and three-way interaction term into Models 1–4 in stepwise fashion (with the control variables and independent variables centred if necessary).
Descriptive statistics and correlations

Notes.
N=353.
+ p<.1; *p<.05; **p<.01; ***p<.001.
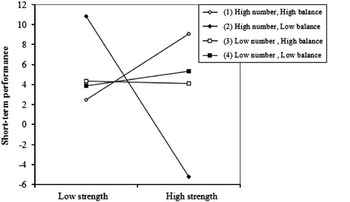
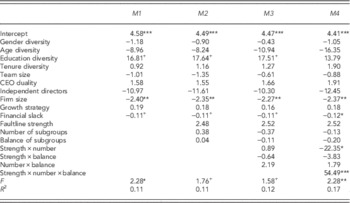
The results of the regression on short-term performance are displayed in Table 2. In Model 4, the coefficient of the three-way interaction term is significant (B=54.49, p<.001), thus providing initial support for Hypothesis 1. To analyse the interaction effect in greater detail, we drew the interaction effect (Aiken & West, Reference Aiken and West1991) displayed in Figure 2. A simple slope test revealed the slope of Line (1) to be positive and significant (β=27.68, p<.05), and none of the slopes of the other lines in Figure 2 was significantly positive, indicating that faultline strength is positively related to short-term performance only when the number and the balance of subgroups are both high. Thus, Hypothesis 1 is supported.
Three-way interaction effects on short-term performance

Regressions on short-term performance

Notes. N=353.
+ p<.1; *p<.05; **p<.01; ***p<.001.
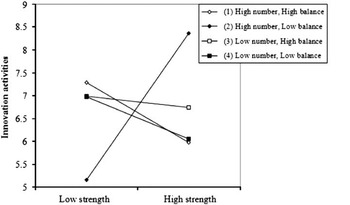
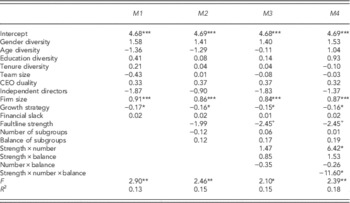
The results of the regression on innovation activities are displayed in Table 3. As shown in Model 4, the coefficient of the three-way interaction term is significant (B=−11.60, p<.05). Similarly, we drew the interaction effect in Figure 3. As is clearly shown, faultline strength is positively related to innovation activities only when the number of subgroups is high and the balance of subgroups is low. Furthermore, the result of a simple slope test of Line (2) was positive and significant (β=13.42, p<.05), whereas none of the slopes of the other lines in Figure 3 was significantly positive, as expected. Thus, Hypothesis 2 is also supported.
Three-way interaction effects on innovation activities

Regressions on innovation activities

Notes. N=353.
+ p<.1; *p<.05; **p<.01; ***p<.001.
Robustness checks
To check the robustness of our results, we conducted two additional analyses. First, we used alternative proxies to measure short-term performance and innovation activities. More specifically, return on equity and the ratio of R&D investments to total sales (e.g., Greve, Reference Greve2003; Lepak, Takeuchi, & Snell, Reference Lepak, Takeuchi and Snell2003) were respectively entered into each model in percentage form. Using the same model specification at that above with these alternative variables, we obtained results consistent with those previously reported. Second, we used random-effects panel regressions to estimate our models. Again, the results were consistent with those reported in Tables 2 and 3. The results of these additional tests confirm the robustness of our findings.
Discussion
The contingent effects of the three properties of TMT faultline configuration on firms’ short-term performance and innovation activities are discussed in this study, with particular attention paid to the positive influences of TMT faultline strength on firm outcomes through the dual routes of efficiency and innovation under specific subgroup number and balance conditions. The study makes several theoretical contributions to faultline theory. First, we analyse the faultline phenomenon from the configurational perspective, thereby enriching scholarly understanding of team faultlines. As most previous studies focus solely on faultline strength, which is only one facet of the faultline phenomenon, we regard a team with faultlines as a configuration and rely on three properties of faultline configuration to present a more comprehensive picture.
More importantly, we advance the debate between theoretical arguments and empirical evidence on the effects of team faultlines by revealing the positive influences of TMT faultlines on firm efficacy and innovation. Team faultlines are generally considered to exert destructive effects through a social categorisation process (e.g., Lau & Murnighan, Reference Lau and Murnighan2005; Li & Hambrick, Reference Li and Hambrick2005), but they may also be constructive in accordance with optimal distinctiveness theory. The disagreement in the field calls for further empirically based explanations, particularly with regard to the benefits of team faultlines. Although several studies have noted those benefits (e.g., Gibson & Vermeulen, Reference Gibson and Vermeulen2003; Bezrukova et al., Reference Bezrukova, Jehn, Zanutto and Thatcher2009), they have not been systematically framed nor fully supported by empirical results (Thatcher & Patel, Reference Thatcher and Patel2011). We believe that the divergence between theoretical expectations and empirical evidence may result from a lack of proper context, as the benefits of faultlines require specific conditions (e.g., Bezrukova et al., Reference Bezrukova, Jehn, Zanutto and Thatcher2009), and the endogenous properties concurrent with faultline strength (i.e., the number and the balance of subgroups) should be considered first. Previous studies may have found scant evidence for the positive effects of faultlines because they failed to account for other configurational properties. The empirical results of this study demonstrate that strong faultlines can confer benefits, but those benefits depend on the subgroup configuration. More specifically, the positive effect of faultline strength on efficacy relies on two conditions: that the subgroups within the team do not treat one another as competitors (when the number of subgroups is high) and that no large subgroup ignores small subgroups (when the balance of subgroups is high). The positive effect of faultline strength on innovation is also reliant on two conditions: that subgroups are not hostile to one another (when the number of subgroups is high) and that there is a large subgroup responsible for idea integration (when the balance of subgroups is low). Therefore, if in a real-life situation a team with faultlines does not fulfil these conditions, which is often the case, then the benefits of faultlines will be difficult to discern. The lack of these conditions in everyday practice may explain why the existing empirical evidence demonstrates largely negative effects for faultlines. Therefore, the theoretical debate on the effects of faultline strength to date has been largely superficial because those effects cannot be predicted properly without the full picture of team faultlines. In other words, the positive side of team faultlines has been concealed under the cover of subgroup configurations, which previous studies have largely neglected. In this study, we clarify the subgroup configurations that allow faultline strength to confer benefits in the areas of performance and innovation. Hence, this study takes a significant step towards explicating the benefits of team faultlines, and thus contributes to faultline theory.
In addition to these theoretical contributions, our results have several practical implications. First, because of the dissimilar effects of TMT faultline configuration on firms’ short-term performance and innovation activities, the fit between TMT faultline configuration and a firm’s strategic orientation should be considered in TMT formation. For example, owners who want to sustain their firm’s innovativeness in the long term should avoid having only two subgroups in the TMT or having subgroups that are balanced in size. Second, once the mechanism of team faultlines is understood, firm owners will be able to take appropriate actions, such as asking the larger subgroup to coordinate with their smaller counterparts or creating more subgroups in the TMT, to inhibit the detrimental effects of TMT faultlines while taking advantage of their beneficial effects. Finally, external stakeholders may use TMT faultline configuration to forecast a firm’s strategic orientation and growth prospects, both of which are valuable in making major decisions such as investment or acquisition decisions. For instance, when TMT members change, the firm’s strategic objectives may also change, and the faultline configuration of the TMT may help external stakeholders to predict those objectives.
Limitations and future research directions
This study has several limitations. First, TMT interaction is discussed only in theory because our secondary data lacked process variables pertaining to coordination or information processing. Second, the independent variables are all from within TMTs, whereas strategic choices are typically influenced by factors both internal and external to the firm. Thus, the study is limited by the omission of external factors from our theoretical model. Third, we regard TMTs as flat structures, thus neglecting the status differences within them. In particular, we do not consider the theoretical effect of TMT leader (although it is controlled in the regression models). Finally, the study sample comprises only listed Chinese IT firms. Hence, caution should be exercised when applying our results to other industries or countries.
Accordingly, we recommend several research directions to address these limitations. First, the dual routes, which are the mechanisms that we use to explain the effects of faultline configuration, should be tested with direct empirical evidence in future studies. Although difficult in TMTs, it would be feasible to collect data on member interactions in other types of teams such as frontline project teams. Second, upper echelons theory suggests that TMT characteristics affect firm strategy because different top managers interpret outside information in different ways (Hambrick & Mason, Reference Hambrick and Mason1984). Thus, future studies could build an integrative model that includes both faultline configuration and contextual factors outside the firm to define the boundaries of faultline theory. Finally, considering the reality that status differences will always exist among team members, future studies should adopt a hierarchical perspective and focus on the power structure within teams, particularly the status of individual subgroups, in constructing a theory of faultline configuration.
Acknowledgement
This research was supported by National Natural Science Foundation of China (71072115, 71372056 and 71072113). We are grateful to our anonymous reviewers and associate editor Timothy O’Shannassy for their insightful help during the review process.