


INTRODUCTION
The Greeks may have invented the word democracy, but the fundamental democratic practice whereby rulers must seek consent from a council arose independently in a broad number of human societies. Standard accounts by political scientists generally overlook this critical fact. Even as astute an observer as Robert Dahl (Reference Dahl1998) suggested that while some form of democracy may have been commonplace when humans were hunter gatherers, as people settled into agricultural communities, monarchy and despotism became the rule. We will suggest that Dahl was only right about a portion of human societies. There were many cases in settled societies where rulers were constrained by councils. We do not claim that council governance also implied the sort of very broad political participation that exists in many countries today; in many cases, it certainly did not. Even so, the core democratic practice of obtaining consent was widespread. Writing of peoples in Southern Africa, one observer said that while they did not select their leaders through elections, the fact that leaders had to rule jointly with councils and related bodies created a “peculiar type of democracy.”Footnote 1 Instead of calling this a “peculiar” kind of democracy, we will simply call it “early democracy” because it is a form of government that a great many human societies have practiced. By early democracy, we are not referring to a system of modern democracy with multiparty elections; we are instead using the insight from the original Greek word demokratia, which means simply that the people hold power.Footnote 2 Governance by council was one step toward making this a reality.
A number of recent authors have explored early state development and both its short-term and long-term consequences.Footnote 3 This work has generally limited itself to asking whether a centralized state developed or not.Footnote 4 We explore not only whether a state existed but also what type of state existed and in particular whether it was more autocratic or instead had collective governance via a council.Footnote 5
In an important contribution, Mayshar, Moav, and Neeman (Reference Mayshar, Moav and Neeman2017) have recently argued that in early societies where production was more transparent, a state was more likely to take on a coercive character. Starting from this same basic insight regarding transparency of production, we consider how actual institutions of governance might evolve to deal with information asymmetries. In the presence of information asymmetries, rulers were more likely to share power with a council whose members could provide information about local conditions.
To illustrate how council governance could emerge, we build a very simple theoretical model that motivates our empirical analysis and in particular the use of the variance in localized agricultural suitability as our core explanatory variable. In the model, a ruler attempts to extract revenue from a representative citizen whose income is stochastic, but the citizen can first send a costless message about his or her income. In this setting, it is possible to have an informative equilibrium in which a citizen communicates truthful information about income prior to the ruler’s choice of a tax rate. This is an illustration of a more general phenomenon explored by Aghion and Tirole (Reference Aghion and Tirole1997). Within an organization (in our case a state), patterns of “real” authority can differ from patterns of “formal” authority if those without formal authority have better information.
The informative equilibrium can exist as long as two conditions hold. First, there must be some commonality of interest between ruler and citizen over how revenues are used. Second, the ruler’s choice of tax policy must be constrained by the threat that a citizen will revolt or simply exit if the tax rate is set too high. This informative equilibrium, which we interpret as having a council exist, is Pareto superior to an equilibrium without communication. Also, the net utility benefit from the informative equilibrium is increasing in the variance of citizen income. For this reason, we think councils are more likely to emerge in societies with high variance in agricultural suitability from location to location.
For our empirical analysis, we make use of data from the Standard Cross Cultural Sample on the presence of council governance in a set of 186 societies covering all world regions. We discuss this evidence in detail in Section 2 while also drawing on material from other sources. It is clear that council governance has existed in a very broad set of human societies. We then make use of a measure of local agricultural suitability produced by Galor and Özak (Reference Galor and Ozak2015, Reference Galor and Özak2016), which measures the maximum number of calories that can be drawn from a 5′ × 5′ cell (roughly 10 km × 10 km). We will refer to this measure as caloric potential. The Galor and Özak measure is designed to capture exogenous features of the natural environment rather than factors that might depend on human intervention, such as if yields are improved by irrigation or adding inputs to the soil. For each of the 186 SCCS societies, we then construct a measure of caloric variability, which is the standard deviation of caloric potential across space. This is a useful empirical measure to the extent that a higher standard deviation in agricultural suitability from location to location implies greater information asymmetries for rulers, which seems very plausible.
Using the SCCS and Galor and Özak data, we provide evidence of a positive and statistically significant correlation between council governance and caloric variability. This correlation is robust to the inclusion of a number of different pretreatment covariates. This correlation is not driven by societies in only one or two world regions; it appears to be quite general. Further support for the theoretical interpretation we give to our result comes from the fact that the council and caloric variability correlation is stronger in societies where there is some evidence of formal taxation. We show also that the correlation between council presence and caloric variability does not appear to have been driven by alternative causal pathways involving the need to manage trade or risk, the presence of specific crops (or types of crops), the geographic area covered by a society, or by the degree of ethnolinguistic diversity. We also consider how features of the natural environment including ruggedness, rainfall, and ecological diversity are correlated with caloric variability. Finally, while the principal measure of caloric variability that we use captures spatial variation, we also report the results of a measure using temporal variation induced by the Columbian exchange subsequent to European conquest of the Americas. Using this temporal measure, we continue to see a correlation between council presence and caloric variability.
As part of our empirical analysis, we also show that the council and caloric variability correlation is not simply capturing something about the presence of a state in general. In recent work, a number of scholars have used an SCCS measure of political integration to capture early presence of a centralized state.Footnote 6 We show that while the presence of a centralized state is correlated with high caloric potential, it is not correlated with high caloric variability. Likewise, council governance is correlated with high caloric variability, but it is not correlated with caloric potential.
As a further step in our analysis, we also provide evidence to suggest that rulers could find other means of dealing with information asymmetries other than relying on a council. In particular, they could build a bureaucracy.Footnote 7 Using SCCS data on bureaucrats, we show that in the absence of full-time bureaucrats, there is a strong correlation between caloric variability and council presence. When a full-time bureaucracy is present, this correlation is essentially zero. This evidence is only suggestive because the presence or absence of bureaucrats is an endogenous development. However, it does suggest that in the presence of information asymmetries, rulers could pursue either a democratic or a non-democratic route to governance. We find an identical result when examining whether a society had access to writing, which is plausible because writing makes a bureaucracy more effective.
As a final step in our analysis (reported in Section B of the Online Appendix), we explore whether past council governance is correlated with constraints on executives today. We find that this is indeed the case. We do this because other relevant literature has investigated analogous questions.
The remainder of this paper is organized as follows. We first present our core empirical measures of council governance and variation in council presence across regions. We then provide a simple theoretical model to illustrate why caloric variability might make it more likely that rulers would share power with a council. This is followed by a presentation of our measure of caloric variability. We then present our empirical estimates.
COUNCIL GOVERNANCE WAS WIDESPREAD
That council governance has been widespread in human societies is not a new idea. In 1877, Lewis Henry Morgan, an early American anthropologist, suggested that “The council was the great feature of ancient society, Asiatic, European, and American.”Footnote 8 Even if Morgan sometimes stretched this idea too far, in this section we will show that council governance has been indeed widespread historically. To do this, we will make use of data from the Standard Cross Cultural Sample (SCCS), first proposed by Murdock and White (Reference Murdock and White1969). This covers a set of 186 societies, each thought to be representative and the best described society in a specific geographic area. The intent of this design was to allow for statistical analysis with greater confidence that individual observations are independent from each other since only one society is chosen from a geographic area. The SCCS societies were drawn from a broader set of 1,265 societies in Murdock’s (Reference Murdock1967) Ethnographic Atlas for which a more limited range of variables have been coded.Footnote 9 Subsequent coding of SCCS societies has resulted in a substantive set of measures, some of which pertain directly to political organization. Tuden and Marshall (Reference Tuden and Marshall1972) coded a number of political characteristics of those SCCS societies that had some sort of central political organization about the community level. This was the case in 85 societies. Murdock and Wilson (Reference Murdock and Wilson1972) coded features of political organization at the community level in all SCCS societies that had some form of political organization that extended beyond individual families. This was the case with 173 societies. In what follows, we will make use of evidence on councils at both the community level and the central state level.
As part of their effort, Tuden and Marshall (Reference Tuden and Marshall1972) coded whether supreme decision-making authority at the central state level was “concentrated in a single authoritative leader” or whether “authority is shared more or less equally by a single (or plural) executive and a deliberative body,” or finally whether “authority is vested, in a council, assembly, or other deliberative body with no single executive.”Footnote 10 Based on this coding, we generated a variable called central council that takes a value of 1 if either of the latter two conditions prevails and zero otherwise. Central council governance was present in 29 of the 85 societies that had some form of political organization above the community level. According to the data collected by Tuden and Marshall (Reference Tuden and Marshall1972), membership in a central council generally involved individuals with some elevated status, either heads of major class or ethnic components, or sometimes the equivalent of aristocrats. In a minority of cases, council members were elected.
In considering political organization at the community level, Murdock and Wilson (Reference Murdock and Wilson1972) also coded whether an individual leader shared power with a council. They distinguished between cases where the community has a single leader or headman (or plural leader or headman), as opposed to those instances where a ruler shares power with a “formal council or assembly” or where the community lacks a single leader and is governed collectively by a council.Footnote 11 Using this information, we have coded a variable local council that takes a value of 1 if either of the latter two conditions prevailed and zero otherwise. Local councils played a prominent governance role in 87 of the 159 communities where some local authority existed, and there was sufficient information for political characteristics to be coded. Ross (Reference Ross1983) shows that a substantial fraction of these councils involved broad participation.
The conclusion from the SCCS data that council governance was widespread in human societies fits with what we know from other sources. In Mesoamerica before the Spanish conquest, Aztec rulers governed without councils through a bureaucracy, but their neighbors in Tlaxcala had what many have called a republican form of government with executive power vested in a council of several hundred individuals.Footnote 12 In precolonial Africa, the Hausa kingdoms had an autocratic form of rule, but rulers in the Asante empire to the west and the Kuba kingdom to the south shared power with councils that placed substantial checks on their rule.Footnote 13 Likewise, in ancient Mesopotamia, it is recognized that autocratic states, such as Babylon under Hammurabi, existed, but so did other forms of rule where councils played a role in governance.Footnote 14 Similar examples can be provided for variations in governance patterns in North America, Oceania, and Ancient India.Footnote 15
The SCCS data suggest that when council governance existed it took three main forms. First, in the case of societies without central authority, a council could exist at the community level. Second, in societies with central authority, a council could exist at that level. In each of these two cases, it is straightforward to see how sharing rule with a council might help rulers to reduce asymmetries of information when it came to tax collection if council members had better information about production. However, there was also a third pattern of council governance that could have the same effect. In this case, there might be a central executive who relied on councils at the local level for information. This was a pattern evident in societies as diverse as early Anglo-Saxon England and Ancient Mesopotamia. In England, prior to the establishment of active central assemblies under Æthelstan (r.924–39) rulers relied principally on assemblies at the level of the Hundred and the Shire.Footnote 16 In Mesopotamia, the rulers of Mari relied similarly on the collective responsibility of local councils for raising taxes (Fleming Reference Fleming2004).
Given that any of the three above patterns of council governance could be used by rulers to deal with information asymmetries in tax collection, we created a variable any council that takes a value of 1 if a council shared power at either the central or the local level and zero otherwise. This will be the principal variable that we will use for our main analysis.
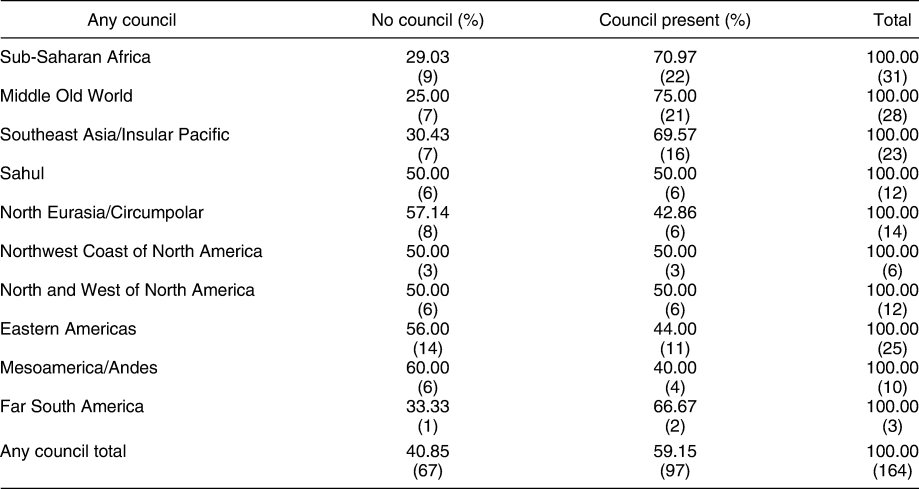
Table 1 shows the overall distribution of our any council variable for the overall SCCS sample as well as for specific regions. We can see that council governance was not specific to one or two regions. It was a widespread phenomenon. The associated map showing SCCS societies with and without council governance helps to reinforce this point.
Descriptive Statistics by Region

Note: Fraction of any council overall and by region. Frequencies shown in parentheses.
There are several further questions we should ask before accepting the idea that governance by council evolved independently in a broad number of human societies. The first of these involves the date of observation for the individual societies in the Standard Cross Cultural Sample. The goal of those who constructed the sample was to find the earliest available ethnographic accounts for each society. In some cases, this was quite early, 1520 for the Aztecs and 1634 for the Huron. In many other cases, though, this “pinpoint” date was quite late, even well into the twentieth century. The median pinpoint date in the sample is 1915. A supplemental reason for coding some societies at a later date was to obtain greater variation in cultural practices. This opens the possibility, for example, that SCCS societies coded at a later date might be more likely to have a council because of learning from others (and in particular Europeans) or because a council arrangement was imposed upon them.
A few simple tests suggest that this potential outside influence is not biasing our conclusions. While the fraction of societies with council governance (any council = 1) is indeed higher when the pinpoint date is after the median date of 1915 (65%), it is still quite high in those societies with pinpoint dates before the median (53%). It is also the case that SCCS societies that had already adopted words into their language from other (and in particular European) cultures were not more likely to have councils.Footnote 17 We can also consider the possibility of measurement error of the following form—European ethnographers with incomplete knowledge of local conditions may have been more likely to believe that councils existed when they did not. This would be based on the idea that they would infer back from their home experience. In fact, European ethnographers who did not know the language of the society in question were not more likely to report that a council was present.Footnote 18
A further question one might want to ask about council governance is how it related to the way in which executives were selected. Two recent papers by Giuliano and Nunn (Reference Giuliano and Nunn2013) and Bentzen, Hariri, and Robinson (Reference Bentzen, Hariri and Robinson2016) have used information from the related Ethnographic Atlas (Murdock Reference Murdock1967) to examine whether selection of community leaders by election in SCCS societies is correlated with measures of democracy in the same locations today. They find that this is indeed the case. The SCCS dataset also includes codes for how leaders (either central or local) are selected, and one thing that is immediately clear from these data is that if council governance was widespread, formal election of leaders was much less so. At the central level, leaders were formally elected in 26% of cases but in only 5% of cases prior to the median pinpoint date of 1915. At the local level, leaders were formally elected in only 12% of cases and in only 5% of cases prior to the median pinpoint date.Footnote 19 One reason for the dearth of formal elections in the sample is that it is clear from ethnographic accounts that there were many cases where those who were ruled still had significant informal influence on choosing or retaining a ruler.
HOW INCOME VARIANCE COULD DRIVE COUNCIL PRESENCE
In this section, we provide a simple theoretical model in which asymmetries of information over income prompt both rulers and those they rule to participate in a council form of governance. The existing literature on councils in the European context has mostly assumed that a council has veto power that prevents ex post opportunism by rulers.Footnote 20 How this veto power is sustained remains open to question. We develop this simple model to motivate our subsequent empirical analysis by establishing why we believe that income variance should be a determinant of council presence. While we emphasize that information revelation might be one reason that a council forms, we make no claim that this is the only reason why a ruler might call a council. Another important reason could be for council members to make intertemporal commitments with one another, as in Myerson (Reference Myerson2008).
It turns out that we do not need to assume veto power to understand how a council can emerge and make a difference for governance. We simply need to show that rulers and those they rule have incentives to exchange information. We do this in a context of a state as defined by North (Reference North1981), an entity that extracts revenue in exchange for protection. The fact that both ruler and ruled in this context can benefit from revenue creates an (imperfect) commonality of interest that makes council governance possible. In what follows, we will show this in a simple game setting where a ruler attempts to extract revenue from a representative citizen in a context where citizen income is stochastic. We will show that both ruler and citizen can often achieve higher utility in a game where the citizen can communicate about his or her income prior to tax policy being chosen, compared to a game with no communication. The net utility benefit from communication is increasing in the variance of the citizen’s income. If we think of the communication game as governance by council, then we have a theoretical result motivating our empirical analysis—council governance is more likely to be observed the higher the exogenous variance in citizen income.
Revenue Raising Without Communication
Consider the following one period environment where a ruler seeks to raise revenue g from a citizen. The reference to “revenues” here should be thought of in broad terms, ranging from a society where the ruler collects taxes in monetary form, to one where taxes in monetary form are absent, but the ruler still has some role in redistributing resources such as foodstuffs. The citizen receives exogenous income y that has a deterministic component y d = 1 and a stochastic component y s drawn from a Bernoulli distribution with Pr(y s = 1) = p. The ruler and citizen know y d and p. Only the citizen knows y s.
The ruler has utility  ${U^{\rm{r}}} = {g^{{1 \over 2}}}$. The citizen has a subsistence requirement of 1, with a utility loss f if this is not satisfied, and then derives utility
 ${U^{\rm{c}}} = {g^{{1 \over 2}}} + {\left( {y - g} \right)^{{1 \over 2}}}$ from income above subsistence.Footnote 21 The ruler’s preferred tax rate τ is 1. The citizen’s preferred τ is
 ${1 \over 4}$ when y s = 1 and 0 otherwise.
The order of play is as follows: (1) y s is realized, (2) the ruler chooses τ, and (3) the citizen chooses whether to revolt. A revolt succeeds with exogenous probability q that is common knowledge. If a revolt is successful the citizen chooses τ, and the ruler suffers an additional cost c. After a failed revolt, τ is set at 1.Footnote 22
If y s = 0, the citizen will revolt for all τ > 0 due to the subsistence requirement. If y s = 1, the citizen will revolt if the following inequality is satisfied (for cases where  $\tau \,\lt {1 \over 2}$).Footnote 23
 $$2q{\left( {{1 \over 2}} \right)^{{1 \over 2}}} - \left( {1 - q} \right)f > {\tau ^{{1 \over 2}}} + {\left( {1 - \tau } \right)^{{1 \over 2}}}.$$
Given the revolt constraint, the ruler’s expected utility is maximized by one of three policies. First, τ = 1 will be chosen if q is sufficiently low that maximum extraction is optimal. Second, τ = 0 will be chosen if q is sufficiently high that zero extraction is optimal. Finally, for intermediate values of q, the ruler will choose a tax rate τ* that just satisfies the revolt constraint. Excluding cases where τ = 1 is optimal, the ruler will choose τ* over τ = 0 when the following inequality is satisfied.
 $$p{\left( {2{\tau ^ * }} \right)^{{1 \over 2}}} + \left( {1 - p} \right)\left[ {\left( {1 - q} \right){2^{{1 \over 2}}} + q\left( {{{\left( {{1 \over 2}} \right)}^{{1 \over 2}}} - c} \right)} \right] > 0.$$
In the game without communication, unless τ = 1 is the equilibrium, there are instances where ex post the ruler and citizen would each prefer a different τ. Take the case where τ = 0 but y s = 1. Here, both ruler and citizen would prefer a higher tax rate. Take the case where τ* is chosen. Here, both ruler and citizen could prefer τ = 0 when y s = 0. This raises the question whether communication about citizen income could be sustained as part of an equilibrium.
Revenue Raising with Communication
Now consider a variant of the game in which the citizen can send a costless message m ∈ {0, 1} about y s. The timing is as follows: (1) y s is revealed to the citizen, (2) the citizen sends a message, (3) the ruler chooses a tax rate, and (4) the citizen decides whether to revolt.
Take a putative equilibrium with a truthful message strategy m = y s where the ruler chooses τ conditional on m. The key question is whether a citizen with y s = 1 will send a false message.Footnote 24 A citizen with y s = 1 would receive utility of 1 from sending a message m = 0 because that would prompt the ruler to choose τ = 0. If the high-income citizen instead sends a truthful message m = 1, then the ruler will choose a tax rate τ* that just satisfies the revolt constraint, as in (1) above.Footnote 25 We know the expected utility for a citizen when τ = τ* from (1). Given this, sending a truthful message is an equilibrium strategy for a citizen with y s = 1 as long as the following inequality holds.
 $$2q{\left( {{1 \over 2}} \right)^{{1 \over 2}}} - \left( {1 - q} \right)f > 1.$$
The above inequality holds for sufficiently low values of f and sufficiently high values of q. This is intuitive. As the citizen’s expected utility from revolt increases, a ruler will choose a lower equilibrium tax rate, creating less incentive for a high-income citizen to deviate and send a message m = 0.
Comparative Statics
The net expected utility benefit that the ruler and citizen each receive from the game with communication compared to the game without communication will depend on the difference in equilibrium tax rates when y s = 1 and y s = 0, which is a function of the exogenous parameters q, c, and f. The net expected utility benefit will also be increasing in the variance of y s, which is equal to p(1 − p). As p approaches  ${1 \over 2}$, if the equilibrium tax rate in the non-communication game is τ = 0 then there is a greater likelihood that both ruler and citizen would have preferred a higher tax rate, and if the equilibrium tax rate is τ*, then there is a greater likelihood that both ruler and citizen would have preferred τ = 0.
If the net utility benefit from an informative equilibrium in the game with communication is increasing in the variance of citizen income, then this equilibrium may be more likely to exist, precisely because it Pareto dominates an equilibrium without communication. An alternative way to generate the same prediction is to imagine that transmission of the message m from citizen to ruler involved a direct cost incurred at the outset of the game, such as that for travel. If at the outset of the communication game either the ruler or citizen, or both ruler and citizen in combination, had to commit to bearing a fixed cost of sending a message, and they were able to commit to this before y s is revealed, then the communication variant of the game would be more likely to occur in areas with higher income variance (as  $p \to {1 \over 2}$).
MEASURING CALORIC VARIABILITY
We argued above that any exogenous factor that makes it more difficult for rulers to know whether citizens have sufficient income to bear a given rate of taxation makes it more likely that both ruler and citizens will prefer a council form of governance. One such factor involves transparency of agricultural production, the principal source of both income and sustenance in the societies in our sample. The importance of transparency of production has been emphasized by Mayshar, Moav, and Neeman (Reference Mayshar, Moav and Neeman2017) who explore when and why more coercive labor arrangements prevail.Footnote 26 One important factor affecting transparency of production is the extent to which agricultural yields vary from location to location. If whoever is setting tax rates has incomplete knowledge of this variation, then they may face an incentive to consult with members of a council who do have such knowledge. In the case of a state that unites multiple communities, this could occur either by having representatives attend a central council or by having a ruler, or his or her agents, consult with local councils. In the case of a community that is not part of a larger state, the same dynamic could take place.
To measure geographic variation in agricultural potential, we will make use of a measure produced by Galor and Özak (Reference Galor and Ozak2015, Reference Galor and Özak2016). For each cell (with a cell defined as 5′ × 5′ or roughly 10 km × 10 km) on the Earth, Galor and Özak produce a measure of the maximum number of calories that can be extracted per year if an optimal mix of crops is grown. The underlying data for Galor and Özak’s measure derives from UN Food and Agriculture Organization data on agricultural potential and USDA data on caloric values for different crops. Galor and Özak produced estimates of caloric potential based on both those crops available prior to the Columbian exchange (circa 1500) and those after the Columbian exchange. We use the post-1500 measure since the pinpoint date for the large majority of the SCCS societies is well after 1500. However, for robustness in Online Appendix Table A.7, we also report results using the pre-1500 measure. In the rest of this paper, we will refer to the Galor and Özak maximum calorie measure as caloric potential. The Standard Cross Cultural Sample provides a geographic point location for each of the 186 societies in the dataset. Using this point, we were able to obtain a measure of caloric potential for each of the SCCS societies.
Using the Galor and Özak measure of caloric potential, we then constructed a measure of caloric variability for each of the SCCS societies. This measure is simply the standard deviation of caloric potential in a sample of nine 5′ × 5′ cells including the cell where the SCCS society is located and the eight surrounding cells. This fits well with the core comparative static from our theoretical model where the probability of observing council governance depends on localized variance in productive potential. For our empirical analysis, we then took the average of this localized caloric variability across a range of different areas. It is important to consider a range of different areas because of uncertainty about the area covered by each of the SCCS societies. For our core estimates, we will report results using a twenty-kilometer buffer for caloric variability, but in Online Appendix Table A.1 we consider alternative buffer sizes.Footnote 27
One feature of the Galor Özak caloric potential measure is that it is designed to be exogenous to human intervention. The underlying FAO data provide agricultural yields with four different levels of inputs. Galor and Özak used the lowest level of inputs. The FAO data also provide yields assuming different water sources. Galor and Özak assumed rain-fed agriculture. This helps rule out the possibility that council governance might have an effect on the caloric potential and caloric variability measure.
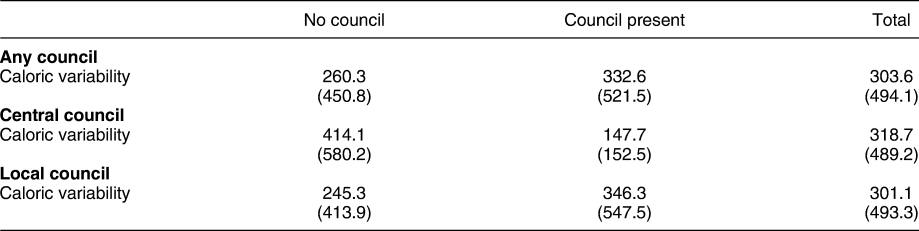
Table 2 provides summary measures of our caloric variability measure, providing evidence for our any council and local council variables of higher caloric variability in societies where council governance prevailed. We do not see the same pattern for the central council variable. All of these differences of course take no account of other factors that might simultaneously influence caloric variability and council presence.
Descriptive Statistics—Caloric Variability

Note: Mean of caloric variability for a 20 km buffer around Standard Cross Cultural Sample (SCCS) societies. Summary statistics are shown by any council, local council, and central council. Standard deviations in parentheses.
One question one might have about our use of caloric variability to proxy for uncertainty about production is that this measure varies only across space and not over time. This could lead to the following further question: Could rulers not use a council to learn about spatial variation in production and then simply disband the council once they have the information they need? To assess this theoretically, we would need to extend our model to a two-period setting and take into account citizen incentives to withhold information today for fear of future consequences. In this multi-period setting, an informative equilibrium could still exist as long as there was known to be sufficient variability in citizen income from one period to the next. The question for our empirical results is what risks are posed by the fact that we focus on a measure of spatial variation. The risks will be lower to the extent we can show that spatial variation in the number of calories one can pull from the ground can also serve as a proxy for temporal variation. One source that can be useful here is the medieval English grain yields dataset collected by Bruce Campbell.Footnote 28 This dataset reports yields for individual manors in eighteen English counties between 1211 and 1491. If we compare spatial and temporal variation in grain yields at the county level, we see that spatial variation is indeed a significant predictor of temporal variation. The pairwise correlation coefficient between spatial and temporal variance is 0.45, and it is statistically significant. So, there does appear to be reason to believe that our caloric variability measure may also proxy for temporal variability in production. In our estimates below, we will report the results from another measure of temporal variability induced by the Columbian exchange. It is also the case that our spatial measure of caloric variability and the temporal measure based on the Columbian exchange are highly correlated with a pairwise correlation coefficient of 0.76.
We can use two historical comparisons to illustrate the relevance of our caloric variability measure. The first is Cambodia before and during the Khmer Empire, which was located in an area where our caloric variability measure is about 1.2 standard deviations below the mean. The second is central Mexico prior to and during domination by the Aztecs, an area where our caloric variability measure is about 1.5 standard deviations above the mean. These cases first illustrate the core comparative static from our theoretical model—a society with higher natural caloric variability (pre-Aztec Mexico) relied more heavily on council governance, whereas a society with lower variability (Cambodia prior to and during Angkor) appears to have made no use of council governance. The Mexican case also illustrates a second (unmodeled) theoretical proposition that we will test in the sections to follow—a bureaucracy can be an alternative means to a council for rulers to learn about local production.
Consider first the case of the Khmer Empire. Even before the rise of the Khmer Empire (802 CE to 1431 CE) with its capital at Angkor, governance in Cambodia took on an autocratic form without council governance. Angkor was located in a low-lying and flat area that was ideal for wet rice cultivation. From a very early date, farmers shifted from a form of cultivation involving broadcasting seed over a wide area to more intensive cultivation of specific plots of land. The impression one is given is of an area where there would have been relatively little difference in agricultural suitability from location to location. Chinese records dating from 550 to 660 CE also point to the emergence of autocratic local leaders referred to as pon and in some later cases as fan. In these pre-Angkor texts, a pon is depicted as directly controlling surpluses of rice and also as having the right to command labor from community members. There does not appear to be any reference to a council or assembly, and the pon very clearly had much higher social status than anyone else.Footnote 29 Those larger kingdoms that formed prior to 802 CE would involve binding together these local autocracies led by the pon.Footnote 30 The same would be true under the Khmer Empire that followed. The Empire was ruled by a god-like king along with members of his household and others of his choosing.Footnote 31
Now, consider the case of central Mexico prior to the establishment of Aztec rule. The natural environment in the Valley of Mexico was considerably different than that around Angkor with more rugged terrain and less abundance of water. All of this fed into considerably greater variability in production from location to location. The valley of Mexico around about 1000 CE contained a large number of independent polities that historians and anthropologists have frequently referred to as city-states. In the local language, these would come to be known as altepetl.Footnote 32 Each altepetl had a preeminent ruler, referred to as a tlatoani, who was obliged to share power with a council of nobles. This was not democracy with mass participation, but it was considerably more collective than that which existed in Cambodia. A pon had considerably more unchecked authority than did a tlatoani. So, the story of the altepetl in this early period is consistent with the idea that a more variable natural environment helped produce a pattern of council governance in independent city-states. But there was one further development that illustrates a phenomenon we will explore in what follows—a bureaucracy can substitute for a council. Gradually, in the centuries before the Spanish conquest the Aztec Triple Alliance led by the cities of Tenochtitlan, Texcoco, and Tlacopan would conquer and subjugate virtually all the altepetl in the region. As part of this movement, local councils were replaced by a centralized bureaucracy that collected and assessed taxes on its own, backed by the threat of force. The most prominent exception to this was the territory of Tlaxcala that we have already referred to above and which retained its format of collective governance until the Spanish conquest.Footnote 33
EMPIRICAL STRATEGY AND PREVIEW OF RESULTS
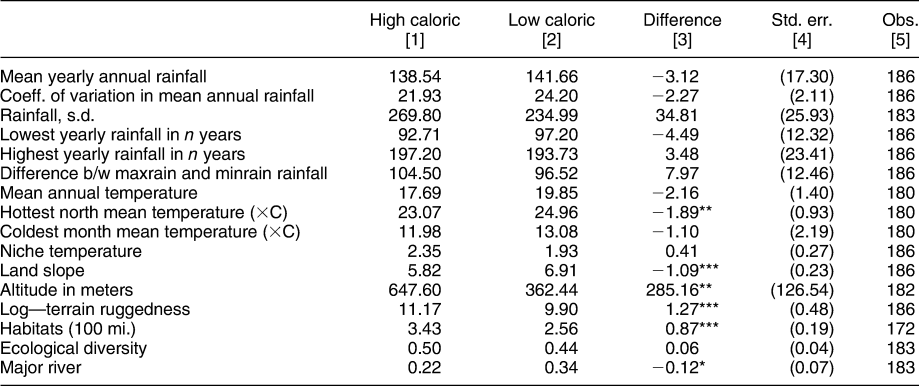
Our empirical strategy in the following sections will proceed as follows. We will first report balance tests to establish whether our caloric variability measured is correlated with other features of the natural environment that can be considered to be pretreatment. This will be reported in Table 3. We include unbalanced covariates for which we have sufficient information to provide an adequate sample for our analysis in subsequent regression specifications.
Comparing Societies with High- and Low-Caloric Variability

Note: Each cell reports a separate regression of the outcome of interest on a binary indicator equal to 1 if society i’s caloric variability is greater than or equal to the average for the sample and zero otherwise. Column [1] represents the mean of the outcome for societies with high-caloric variability. Column [2] represents the mean of the outcome for societies with low caloric variability (i.e., the ‘comparison’ group). Finally, column [3] shows the difference in means between high- and low-caloric variability across societies included in the sample. Robust standard errors are reported in parentheses in column [4], while column [5] gives the total number of observations. *** is significant at the 1% level, ** is significant at the 5% level and * is significant at the 10% level.
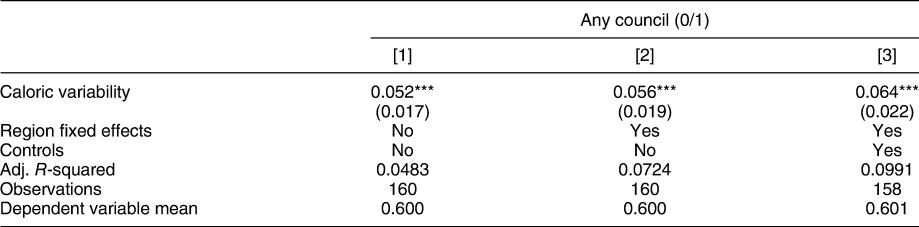
We will then present our main estimates of the partial correlation between caloric variability and council presence in Table 4. This will establish that there is a strong correlation between caloric variability and council presence. Recall that our council variable takes a value of 1 if a council existed either at the level of individual communities or at the higher levels of political integration. In this section, we will also report a number of robustness tests involving the presence of trade, food sharing to reduce risk, the area covered by a society, different types of crops, ethnolinguistic diversity, and different features of the natural environment that may be correlated with caloric variability. We will also show that the correlation between council presence and caloric variability continues to hold if we construct an alternative measure of caloric variability based on temporal variability induced by the Columbian exchange.
Caloric Variability and Council Presence

Note: Each cell reports a separate OLS regression of any council on caloric variability. Geographic controls include latitude, longitude, their product, rainfall, land gradient, and altitude. Robust standard errors are shown in parentheses. *** is significant at the 1% level, ** is significant at the 5% level, and * is significant at the 10% level.
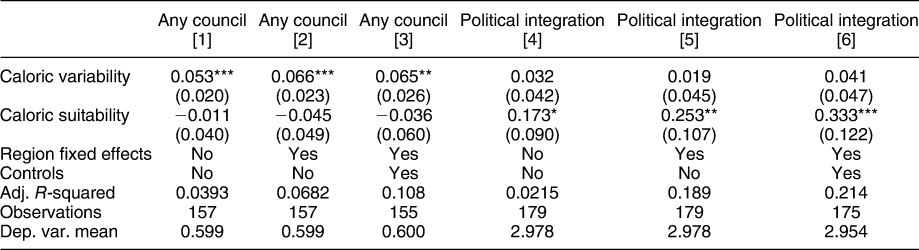
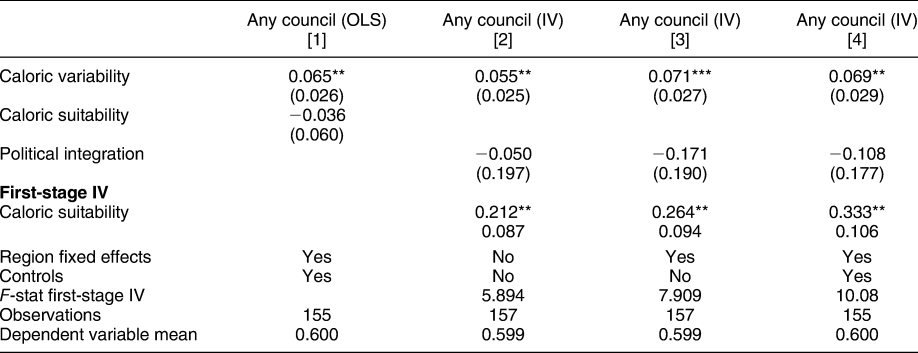
Our next step will be to consider whether our main results are simply capturing an effect whereby features of the agricultural environment are correlated with state formation in general, and not specifically with council presence. To do this, in Table 5 we will first add a measure of caloric suitability to our core regression specifications. Doing this, we will establish that caloric variability remains highly correlated with council presence, whereas caloric suitability is not correlated with council presence. We will then show that the reverse pattern holds for the presence for state development in general. Caloric suitability is a strong predictor of political integration above the level of the individual community existing. Caloric variability is not correlated with political integration. Said more colloquially, what this means is that the number of calories that one can pull out of the ground is an important predictor of state presence, whereas variability in the number of calories one can pull out of the ground determines what type of political authority exists with either a council or a more autocratic form of rule. As a final step, in Table 6 we report instrumental variables estimates where caloric suitability is used as an instrument for political integration in a regression where council presence is the dependent variable. In these estimates, we continue to observe a statistically significant correlation between caloric variability and council presence. It is possible, however, that we may suffer from a weak instruments problem here given that the F-statistic on the excluded instrument varies between six and ten.
Councils, Political Integration Hierarchy, and Caloric Conditions (OLS Estimates)

Note: Each cell reports a separate regression with either any council or political integration as the dependent variable. Both caloric variability and caloric suitability are inverse sine hyperbolic transformed. political integration is a five-point scale, as described in the text. Geographic controls include latitude, longitude, their product, rainfall, land gradient, and altitude. Robust standard errors are reported in parentheses. *** is significant at the 1% level, ** is significant at the 5% level, and * is significant at the 10% level.
Councils, Political Integration, and Caloric Conditions (IV-2SLS)

Note: Each cell reports a separate 2SLS regression where any council is the dependent variable. Geographic controls include latitude, longitude, their product, rainfall, land gradient, and altitude. Robust standard errors are reported in parentheses. Caloric suitability is the excluded instrument for political integration. *** is significant at the 1% level, ** is significant at the 5% level, and * is significant at the 10% level.
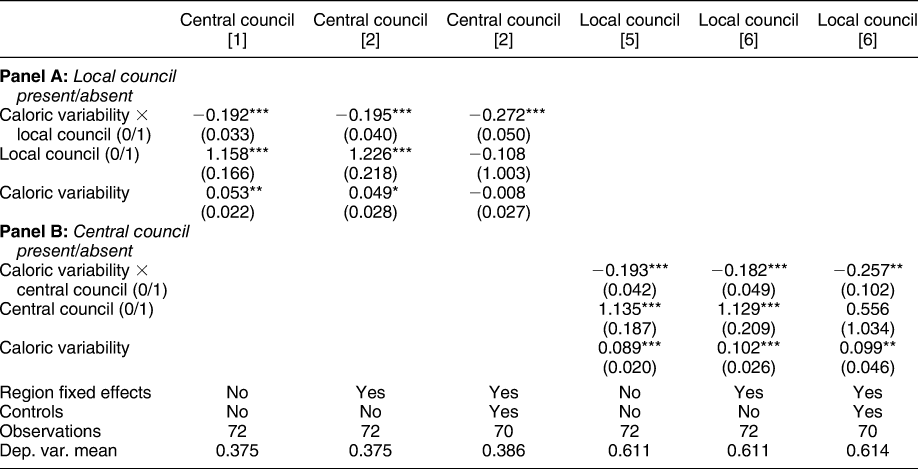
We will next turn to unpacking our core results while separating out councils at the level of individual communities and at higher levels of political integration. We have reason to believe that local and central councils may act as substitute mechanisms for providing information about production, and our results will reflect this. In Table 7, we will show that when a local council is absent, caloric variability is significantly correlated with presence of a central council, but this relationship disappears once a local council is present. The reverse relationship also holds. When a central council is absent, there is a statistically significant correlation between caloric variability and local council presence, but this relationship disappears when a central council is present.
Central and Local Council Substitutability

Note: Each cell reports a separate regression where either local council or central council is the dependent variable. Geographic controls include latitude, longitude, their product, rainfall, land gradient, and altitude. Where indicated, the geographic controls are interacted with a dummy for local/central council to flexibly control for any heterogeneous effects of geography that may be correlated with both caloric variability and council presence. Robust standard errors are reported in parentheses. *** is significant at the 1% level, ** is significant at the 5% level, and * is significant at the 10% level.
The penultimate step in our empirical analysis will be to investigate the possibility that a bureaucracy is an alternative means to a council for a ruler to obtain information about production. This is important to establish as an avenue for future inquiry, though we of course acknowledge that the presence of a bureaucracy is an endogenous development. If we do find such a relationship, then it helps increase the plausibility that our core result involving caloric variability and council presence actually reflects the informational mechanism that we have hypothesized.
BALANCE TESTS
In Table 3, we report balance tests to examine whether caloric variability is correlated with a range of different exogenous geographic covariates. There are indications in Table 3 of caloric variability being correlated with several characteristics associated with the natural environment. This is not surprising given that features such as climate, ruggedness, or altitude certainly could be expected to influence caloric variability. Since we might be worried that one or more these factors could have an independent effect on our outcome of interest, we include a set of covariates from Table 3 in our regression specifications, which are correlated with council presence and for which we do not find balance between high and low variability societies. The exception to this involves the measures for ruggedness and the number of different habitats within a one hundred mile radius. As these two variables may themselves be considered as alternative ways to measure uncertainty in agricultural production—instead of looking at caloric variability—we will consider them in a separate exercise presented in Online Appendix Table A.5.
MAIN RESULTS
In our core regression specification shown below, A is our any council variable for society i in region r and C is our caloric variability measure. In all analyses, we include caloric variability transformed using the inverse hyperbolic sine (IHS) transformation. Using this rather than a logarithmic transformation prevents exclusion of societies where the caloric variability is zero.Footnote 34 We control for region fixed effects as well as latitude, longitude, their product, and a vector of geographic controls for rainfall,Footnote 35 land gradient, and altitude, to help rule out the possibility that unobserved factors might be biasing our results.
 $$\eqalign{{\hskip-6pc A_{{\rm{ir}}}} = \alpha + \beta {C_{{\rm{ir}}}} + \gamma La{t_{{\rm{ir}}}} + \delta Lo{n_{{\rm{ir}}}} \cr\hskip12pt + \zeta Lat \,\times\, Lo{n_{{\rm{ir}}}} + {\bf{X}}{\prime _{{\rm{ir}}}}\rho + {\theta _{\rm{r}}} + {\varepsilon _{{\rm{ir}}}}.$$
The results of linear probability estimates of equation (1) are shown in Table 4. In each of the four cases, the coefficient on the measure of caloric variability is positive and statistically significant at least at the 1% level. The coefficient on caloric variability is also very stable across the different specifications. If we interpret this result causally, it would imply that a one–standard deviation increase in our caloric variability measure would be associated with an increase of between 0.08 and 0.11 in the probability of having a council. This is a sizable effect given that only a little over one-half of the societies in our sample have any kind of council present.Footnote 36
Our interpretation of the correlation between councils and caloric variability is that high variability poses challenges for rulers attempting to extract revenue. We should think of revenue in broad terms here. Whether rulers are attempting to extract and/or redistribute taxation in monetary form, taxation paid in labor, or taxation paid in terms of agricultural production, the same problem involving information asymmetries could arise. This could exist even in non-agricultural societies. Among the Kwakiutl of the Pacific Northwest, Franz Boas (Reference Boas1913) reported that chiefs regularly obliged those who hunted or fished to turn over up to one half of their catch.
In Table A.1 in the Online Appendix, we provide additional specification checks by reestimating the column three specification for five additional buffer sizes for caloric variability (0 km, 40 km, 60 km, 80 km, and 100 km). The coefficient and standard error for caloric variability remain very stable across these alternative buffer sizes. For each of these alternative buffer sizes, we also considered the possibility that the standard errors of our estimates are biased by spatial correlation of the residuals. This does not seem to be the case as standard errors estimated following the method proposed by Conley (Reference Conley1999) are very similar to the standard errors that do not take possible spatial correlation into account.Footnote 37 It is also worth noting that when we calculated Moran’s I for the residuals in our Table 4 estimates, we could not reject the null of spatial randomization.Footnote 38 We also examined whether the positive correlation between councils and caloric variability is driven by one particular world region and found that this is not the case (discussed and reported in Part C of the Online Appendix).
While the estimates in Table 4 provide strong evidence of a correlation between council governance and caloric variability, they also provide quite strong evidence that caloric variability was not all that mattered. In the first column in Table 4 that includes no controls, the r-squared is only 0.05. This low figure could be attributable to measurement error, but it could also most certainly be attributable to the fact that there are many other potential sources of information asymmetries between rulers and those they govern. We see the results in Table 4 as providing support for this general proposition rather than as evidence that geography is destiny.
In Table A.2 of the Online Appendix, we provide additional robustness checks to address endogeneity concerns related to crop-specific technologies, which may be correlated with both caloric variability and council presence. In columns 2 and 3, we include principal and staple crop fixed effects to control for (a) type of crops (roots, cereals, tree, or vine) and (b) major staple crops historically grown in each society (e.g., wheat, barley, maize, and millet), respectively. In column 4, we include both principal and staple crop fixed effects. Overall, our results remain unchanged. In Table A.10, we explore whether our results are sensitive to measuring caloric variability based on cereal crops or tuber crops, and we find no evidence that this is the case.
There are few variables in the Standard Cross Cultural Sample that refer directly to taxation. However, among those that do, there is a record of some explicit form of taxation (and not the tribute referred to by Boas) in two-thirds of societies. When repeating the estimates in Table 4 while restricting the sample only to societies where there is evidence of explicit forms of taxation, we actually see that the coefficient on caloric variability is larger in magnitude and remains statistically significant, as one would expect if our theoretical interpretation was correct.Footnote 39 We should caution, however, that the existence of taxes is endogenous, and so we prefer to refer mainly to our Table 4 results that will not suffer from post-treatment bias.
Though forms of taxation, tribute, and redistribution can occur in both agricultural and non-agricultural societies, our caloric variability variable should ultimately be a better proxy for information asymmetries in agricultural societies. When restricting our sample to SCCS societies practicing agriculture, we do indeed find that the coefficient on caloric variability remains statistically significant whereas this is not the case in a subsample of non-agricultural societies. However, the presence or absence of agriculture is clearly posttreatment, so we should be cautious in interpreting these results.
We also considered the possibility that caloric variability could affect council presence through alternative channels. The first of these was trade and commerce. Perhaps greater variability means greater opportunities for trade and a need for governance. It could have also meant a greater need for trade as a mechanism of insurance.Footnote 40 However, one would need to explain why trade necessarily needs to be governed by a council rather than an autocrat. Table A.4 in Online Appendix shows that, in fact, caloric variability is neither correlated with importance of trade for subsistence (relative to agriculture, fishing, hunting, gathering, and animal husbandry) nor does it significantly predict intercommunal trade as a food source. We next considered whether councils might emerge as a way of dealing with food scarcity by sharing food across non-kin groups. These results are reported in Table A.8. There is no indication here that controlling for scarcity or food sharing affected our caloric variability estimates. Nor is there any indication that the effect of caloric variability on council presence is conditioned by the presence of either food scarcity or food sharing. A potential reason for this is that an autocratic state can manage food sharing just as well as one governed by a council. Temple granaries in Ancient Sumeria would be one example here. It is also possible that our failure to find an effect of food scarcity or food sharing is attributable to the small sample size in Table A.8, and it is also the case that scarcity and sharing are each endogenous developments.
We considered further whether the geographic area covered by a society had an effect on the relationship between caloric variability and council presence. Using the same method as Fenske (Reference Fenske2013), we drew on several different sources to produce proxy measures for the geographic area covered by each SCCS society. We then examined whether including this measure as a control and interacting it with our caloric variability measure had an effect on our estimates, and it did not. This is shown in Table A.6.
Caloric variability might also influence council presence by increasing ethnolinguistic diversity. If the presence of multiple agricultural environments leads to the development of greater diversity of this sort, as shown by Michalopoulos (Reference Michalopoulos2012), then council governance might be necessary in order to mediate between different groups. To assess this, we used an SCCS measure that shows the number of societies within a 100 miles radius. This is indeed positively and significantly correlated with our caloric variability measure. However, when we interact this measure with caloric variability (Table A.5), we fail to see that greater ethnic diversity (proxied in this manner) is correlated with council governance, nor does its inclusion affect the correlation between caloric variability and council governance.Footnote 41
As a further consideration, we asked whether we could obtain similar results as those in Table 4 if we used a measure that would exhibit temporal variability. To do this, we constructed a second measure of caloric variability based on variation induced by the Columbian exchange whereby many new world plants spread to other regions and vice versa. We construct a measure of temporal caloric variability by taking the difference between caloric suitability before and after 1,500 for each grid cell. We then take the standard deviation in this difference across this cell and all adjacent grid cells. We then sum this over different buffer sizes between 20 km and 80 km and examine the correlation between this temporal variability measure and council presence. At any buffer size greater than 20 km, we see a positive and statistically significant relationship with council presence. This is shown in the bottom panel of Table A.7. For comparison, the top table of A7 reports results using pre-Columbian spatial measure of caloric variability and council presence.Footnote 42 In terms of standard deviations, the magnitude of the effects using either the temporal or the spatial variability measure is very similar because of greater cross-society variance for the former. Finally, it is also worth noting that we see a high correlation between temporal and spatial variability measures.
As a final consideration, we also explored four alternative measures to our caloric variability measure. The first is a proxy of ecological diversity used by Fenske (Reference Fenske2013, Reference Fenske2014). The second and third measures are variance in rainfall and the number of different habitats within a 100 miles radius. The fourth is a measure of ruggedness. Each of these alternatives is derived from the Standard Cross Cultural Sample. For rainfall, we should note that this is an overall measure of rainfall variance for a society, so it can capture the effect of common shocks over time but not localized rainfall shocks within a society’s territory. The existing rainfall databases based on tree ring data would allow us to construct such a measure only for a very small number of the SCCS societies. We believe that each of these four factors should influence caloric variability, but we also believe that caloric variability comes closest to proxying the relevant variable from our theoretical model—variance in income. In regressions reported in Table A.5, we see that each of the four alternative measures is correlated with caloric variability. We also see significant evidence that when entered into a regression on their own, they are correlated with council presence. However, when we regress council presence on any of these alternative measures together with caloric variability, we find that they no longer predict council presence while caloric variability still does.
CALORIC POTENTIAL AND POLITICAL INTEGRATION
In this section, we will expand the analysis to consider whether the correlation we have identified between councils and caloric variability is simply reflecting a more general correlation between state formation and aspects of the physical environment, and not the effect of information asymmetries that we have in mind. A longstanding idea suggests that a more favorable environment for agriculture led to the rise of early states.Footnote 43
Ideally, we would like to be able to control for other aspects of state formation in our regression specifications and in particular for the extent of political integration. The problem is that a measure of political integration would be post-treatment. We will instead rely on exogenous determinants of political integration. Our contribution will be to show that while the level of political integration is correlated with total caloric potential, it is not correlated with caloric variability.Footnote 44 For council governance, the exact opposite pattern holds. Our any council variable is correlated with caloric variability but uncorrelated with caloric potential.
To measure the degree of political integration, we will make use of a measure from the SCCS dataset that has also been used in a number of other recent studies.Footnote 45 The measure we will call political integration, which is reported in Murdock and Provost (Reference Murdock and Provost1973), is a five-point scale that takes a value of 1 if there is no political integration above the level of individual families, 2 if there is authority only at the community level, 3 if there is integration to one level above the community, 4 if there is integration to two levels, and 5 if there is integration to three or more levels above the community. There is a strong pairwise correlation (of 0.31) between our any council variable and this measure. However, we cannot simply add political integration to our existing specifications without inducing a risk of post-treatment bias.Footnote 46 To deal with this, we will instead exploit the fact that caloric potential is an exogenous determinant of political integration.
In Table 5, we first report a set of reduced form relationships, alternately regressing either any council or political integration on both caloric potential and caloric variability. Including caloric potential will capture any direct effect it has on council development while also controlling for any indirect effects it might have on council development via the development of political integration. As we suggested above, the results here are quite consistent across specifications, and they suggest that while council presence is driven by caloric variability, political integration is driven by caloric potential. As political integration is an ordered variable in Table A.12, we report ordered probit results for robustness.
In Table 6, we next adopt an instrumental variables strategy where we use caloric potential to instrument for political integration. We caution that the exclusion restriction for this strategy may or may not be satisfied. It is possible that caloric potential has a direct effect on council presence that we have not captured. It is also possible that caloric potential is correlated with other features that determine council presence. Those who doubt the validity of the exclusion restriction here should focus primarily on our reduced form results in Table 5. To the extent the exclusion restriction is satisfied, these estimates provide further support for the idea that the observed correlation between council governance and caloric variability is not biased by the failure to control for other aspects of state formation.
Taken together, the above results suggest that as has been suggested before, areas with a high level of agricultural suitability were more likely to develop political integration above the level of individual communities. But this seems to be a separate story from what determines whether governance occurs with or without a council. That appears to depend more on caloric variability, and this is consistent with a story where information asymmetries regarding local conditions create incentives for both rulers and ruled to participate in a council form of governance.
CENTRAL AND LOCAL COUNCILS AS SUBSTITUTES
So far, we have shown a robust correlation between caloric variability and council governance where council governance takes place either at the level of the community or at a higher level of political integration. We have not explored the question why council governance sometimes occurs primarily at one level and not the other. Exploring this question in full is a task that lies beyond the scope of this paper. We will limit ourselves in this section to showing that local and central councils may have served as alternative means of dealing with information asymmetries in local production.Footnote 47 We previously provided individual examples to suggest that this could be the case. In our empirical findings, we will show that when a local council is absent, there is a positive correlation between central council and caloric variability. When a central council is absent, there is a positive correlation between local councils and caloric variability. When a local (central) council is present, there is not a positive correlation between central council (local council) and caloric variability. In the regression specifications reported in Table 7, we investigate the correlation between separate types of council (local or central) and caloric variability while conditioning on whether the other type of council is also present. Our number of sample observations is reduced here because we must restrict ourselves to SCCS societies that had some form of central governance, that is to say, governance above the level of the individual community. Since the presence of the other type of council is, of course, an endogenous development, we should also add a (large) caveat about post-treatment bias here.
BUREAUCRATS AS AN ALTERNATIVE TO COUNCILS
So far, we have suggested that governance by council provides a means for rulers to overcome asymmetries of information that could impede tax collection. We have not considered alternative ways in which rulers could deal with these information asymmetries. The key alternative strategy would be for rulers to develop a bureaucracy that could accumulate localized knowledge about production. Instead of relying on council representatives to communicate about what level of taxation is feasible in a particular area, an appointed bureaucrat could be sent to the area to report the same information. In this section, we will explore whether the correlation between council governance and caloric variability depends on whether a bureaucracy is present. The presence or absence of a bureaucracy is most definitely an endogenous development, but it may still be useful to consider this possibility.
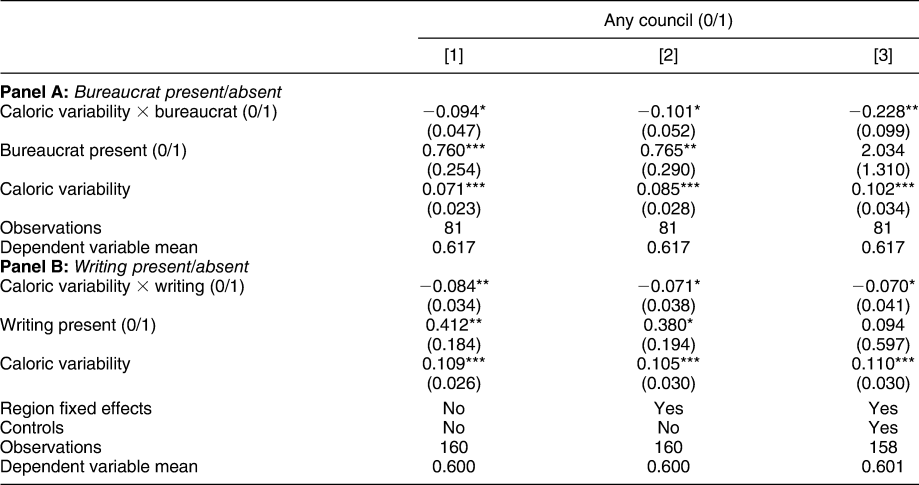
We make no claim here to be able to answer how, when, and why bureaucracies emerged in SCCS countries. What we will instead limit ourselves to doing is to showing that in the presence of a bureaucracy, there is no longer a correlation between caloric variability and council governance. Table 8 reports a series of estimates where we estimate the correlation between any council and caloric variability conditional on the presence of full-time bureaucrats who are no related to the government head. To assess the presence of bureaucrats, we use the variable coded by Martin Whyte (Reference Whyte1978), which is unfortunately available for only half of the SCCS societies. Consequently, the number of observations used here is significantly reduced.Footnote 48 We include this variable in the specifications while including an interaction term between caloric variability and the presence of bureaucrats. Once again, we acknowledge that the presence of bureaucrats is a post-treatment condition. It may still be useful to consider these results.
Council Presence across Societies with/without Bureaucracy and Writing

Note: Each cell reports a separate regression where any council is the dependent variable. Geographic controls include latitude, longitude, their product, rainfall, land gradient, and altitude. Where indicated, the geographic controls are interacted with the dummy variable for bureaucracy and writing, respectively, to flexibly control for any heterogeneous effects of geography that may be correlated with both caloric variability and council presence. Robust standard errors are reported in parentheses. *** is significant at the 1% level, ** is significant at the 5% level, and * is significant at the 10% level.
Across all three specifications in Table 8, we see a very clear result. In the absence of full-time bureaucrats, there is a strong, positive correlation between council governance and caloric variability. In the presence of bureaucrats, the negative coefficient on the interaction term nearly perfectly offsets the positive coefficient on the council variable, so the estimated effect of caloric variability is essentially zero. This is a striking result that provides some evidence that a bureaucracy and a council may be substitute ways of dealing with caloric variability. It is important to note that even though we can have substitute functions, there are also many societies in the SCCS dataset that have both a council and bureaucrats.Footnote 49
As a final step in this inquiry in Table 8, we distinguish between societies with and without writing. The logic here is that it is much easier for a bureaucracy to function with writing present. We see a very similar pattern of results as in Table 8. The correlation between caloric variability and council presences exists in the subsample of societies without writing but not in the subsample of societies with writing.
CONCLUSION
In this paper, we have provided evidence to suggest that early democracy via local or central councils arose independently in a broad set of human societies in numerous different regions. We have also provided evidence that early democracy was more frequent in societies where exogenous factors made local agricultural production more variable and thus less transparent. This finding is consistent with a theoretical framework in which those who rule and those who are ruled find it useful to hold a council to exchange information about taxation. We have also emphasized, however, that our empirical results do not support a claim that geography was destiny when it came to explaining the emergence of autocratic rule or the alternative of council governance. Though the effect of caloric variability that we have identified is sizable, it still explains only a small portion of the observed variance in our council measure between different societies. Our results should instead be taken as evidence of a more general phenomenon—when exogenous factors make it harder for rulers to know how much they can tax their citizens, we are more likely to observe early democracy. It is also possible, however, that rulers under such circumstances have an alternative route to dealing with information asymmetries. Building a bureaucracy presents an alternative route that avoids the need to govern by council.
SUPPLEMENTARY MATERIAL
To view supplementary material for this article, please visit https://doi.org/10.1017/S0003055419000741.
Replication materials can be found on Dataverse at: https://doi.org/10.7910/DVN/9OK6RH.






Comments
No Comments have been published for this article.