1. Introduction
The Straits of Malacca and Singapore (SoMS) are some of the most important strategic maritime passages in worldwide sea transport. It is a primary route for most vessels plying their trade among the Far East, the oil-rich states in the Middle East and Europe (Qu and Meng, Reference Qu and Meng2012). According to statistics, more than one-third of the world’s trade and half of its oil pass through this strait (Lam, Reference Lam2016; SIGTTO, 2015). Currently, the SoMS bears more than 100,000 vessel movements per year, including bulk carriers, container vessels, ferries, tankers, large crude carriers, barges, fishing vessels and so on. With the rapid development of the economy, it can be assumed that increasingly more large-sized ships and tonnages of goods have passed through this strait in recent years. The increasing number of ships, especially large-sized ships, sailing through SoMS means more risk and congestion, especially when such ships are concentrated at the bottlenecks or chokepoints of SoMS.
The traffic separation scheme of the SoMS is divided into nine sectors, with Sectors 1–6 lying in the Malacca Strait and Sectors 7–9 lying in the Singapore Strait. As Figure 1 shows, the Singapore Strait has the narrowest breadth of SoMS, which is approximately 1.96 nautical miles. Without appreciating maritime control and management, vessels sailing through these narrow sectors will easily get stuck at the chokepoints of the Singapore Strait, resulting in delayed ship operations (Rusli, Reference Rusli2020). Consequently, the capacity assessment of the Singapore Strait plays a significant role in the vessel traffic control and management of SoMS.
Traffic separation scheme of SoMS (SIGTTO, 2015).

Different from the port capacity and cargo throughput (Hui et al., Reference Hui, Ng, Xu and Yip2010; Luo et al., Reference Luo, Liu and Gao2012; Gao et al., Reference Gao, Luo and Zou2016; Zhang et al., Reference Zhang, Meng, Xiao and Fu2018), the traffic capacity of a waterway/strait is the maximum allowable traffic volume beyond which traffic flow stops (Fujii and Tanaka, Reference Fujii and Tanaka1971). The complexity of a maritime traffic system makes it difficult to assess its capacity to manage traffic vessels, which may stem from various characteristics of different vessel types, the strait infrastructure and operational regulations (Kang et al., Reference Kang, Meng, Zhou and Gao2019b). Moreover, the width and depth of a waterway play a significant role in the SoMS capacity, especially at three points (One Fathom Bank, Racon D/Raffles and Eastern Bank) and for deep water routes. In brief, the capacity of a strait heavily depends on the prevailing traffic patterns, which are summarised as follows.
-
1. The physical conditions of the strait, such as the width of the narrow points, the depth of the waterway and the presence of obstacles.
-
2. The characteristics of various cargo/vessel types (such as the average vessel speed, vessel size and vessel manoeuvrability) and their effects on the ship domain (e.g. the domain for very large crude oil carriers could be larger than those with the same sizes).
-
3. The traffic compositions and the management of strait traffic that have considerable effects on strait capacity.
-
4. Other environmental factors on the size of the ship domain, such as weather, sea conditions, visible range, tidal current, etc.
In short, these factors all have some direct or indirect effects on the estimation of strait capacity. Nowadays, increasingly more large-sized ships are passing through the Singapore Strait, so its traffic capacity will be inevitably affected. Additionally, in view of the randomness of external environmental or human factors, the assessment of capacity usually has a variance. Thus, with the increased number of large-sized ships, how to estimate the mean strait capacity and its variance has become an urgent problem for effective strait management.
2. Literature review
Unlike the vast studies of capacity estimation for land transportation systems, only a few on the waterway capacity can be found in the literature. Typically, approaches to assessing capacity can be divided into two categories: planning-level capacity and operational-level capacity. Specifically, the planning-level capacity refers to the theoretical maximum value for the traffic volume of a waterway based on the average speed of vessels (Fujii and Tanaka, Reference Fujii and Tanaka1971). However, the operation-level capacity can be considered as the maximum navigational throughput, which refers to the maximum number of ships passing through per unit of time with a tolerable navigational level (Kang et al., Reference Kang, Lu, Meng, Gao and Wang2019a). Technically, it can be derived from the planning-level capacity by allowing for some practical conditions and factors with the aid of computer simulators. In view of the importance of theoretical analysis before software simulations, the estimated strait capacity in this study refers to the planning-level capacity.
The planning-level capacity is proposed to ensure navigational safety. That is, when the throughput of a strait reaches its capacity at the planning level, all vessels should keep the minimum distance to collision (MDTC) to avoid the risk of ship collision (Endrina et al., Reference Endrina, Rasero and Konovessis2018). This definition is similar to that of highway capacity, where all vehicles should also keep the average minimum separation from others. Some studies mentioned the MDTC for the assessment of strait capacity. For instance, Fujii and Tanaka (Reference Fujii and Tanaka1971) estimated waterway capacity by making use of the effective ship domain. They proposed an ellipse-shaped ship domain, which contained the MDTC to avoid collisions (Toyoda and Fujii, Reference Toyoda and Fujii1971). Fan and Cao (Reference Fan and Cao2000) formulated the sea space as a direct network and developed the ‘capacity models for berthing areas, anchorage areas, fairways and their intersections as well as the entire sea space system’. Similar to the car-following theory, many parameters used in their domain model are difficult to derive in practice. Kadarsa et al. (Reference Kadarsa, Lubis, Sjafruddin and Frazila2017) studied the fairway traffic capacity in Indonesia, by deriving the MDTC among different vessel types. Moreover, Kang et al. (Reference Kang, Meng and Liu2018) made use of the ship traffic fundamental diagram to estimate the theoretical capacity of the Singapore Strait, by neglecting the effects of vessel types and compositions. Wang et al. (Reference Wang, Chang, Yuan, Shi and Bai2020) used the average space–time resource occupied by a single ship to estimate the capacity of the Yangtze Estuary Deepwater Channel and studied how to maintain safety with the increasing fairway capacity. In all of these capacity-based studies, the ship domain is always a useful parameter to derive the MDTC between two vessels.
Academically, many ship domain models with different shapes and sizes have been presented by statistical or intelligent microsimulation methods (Köse et al., Reference Köse, Başar, Demirci, Güneroǧlu and Erkebay2003; Ince and Topuz, Reference Ince and Topuz2004; Lu et al., Reference Lu, Kang, Gao and Meng2018). The typical ship domains can be roughly distinguished as the elliptical, circular and polygonal domains by their shape boundaries (Wang et al., Reference Wang, Chang, Yuan, Shi and Bai2020). First, the elliptical ship domain was identified with semi-major and semi-minor values. It is proposed by Fujii and Tanaka (Reference Fujii and Tanaka1971) from a mass of recoded ship data in Japanese waters, and similar domain results were carried out by many researchers with statistical methods (Coldwell, Reference Coldwell1983; Kijima and Furukawa, Reference Kijima and Furukawa2003; Zhang et al., Reference Zhang, Pedersen and Villavicencio2019; Namgung and Kim, Reference Namgung and Kim2021). Second, the circular ship domain was proposed with three sectors under three different radii by Goodwin (Reference Goodwin1975). Based on the Goodwin model, Davis et al. (Reference Davis, Dove and Stockel1980) further proposed and studied the modified circular ship domain. Third, the polygonal ship domain, which allows the determination of the dynamic dimension of domains, was presented (Śmierzchalski and Michalewicz, Reference Śmierzchalski and Michalewicz2000; Dinh and Im, Reference Dinh and Im2016; Zhang and Meng, Reference Zhang and Meng2019). However, these dynamic domains would make the assessment of a navigation situation difficult and were generally used in macroscopic ship traffic simulations. Among these ship domain-related studies, it is worth mentioning that the choice between using the above Fujii or Goodwin approaches should depend on the analysis purpose and water areas. Typically, the Fujii approach is appropriate when one considers the safe navigation and channel capacity as the main interest, while the Goodwin approach is more suitable to estimate some critical factors, especially for the open-water situations (Coldwell, Reference Coldwell1983). Hence, the Fujii approach is suitable for the capacity estimation of the Singapore Strait.
Based on the above literature, the derivation of MDTC from different ship domains is a useful method to estimate the planning-level capacity of the Singapore Strait. However, the MDTCs are inevitably affected by some external factors like hydrographical conditions, ship characteristics (e.g. speed, course, type, length) and traffic compositions (Li and Lam, Reference Li and Lam2017; Weng et al., Reference Weng, Liao, Wu and Yang2020). However, few studies have analysed the capacity of the Singapore Strait by considering the effects of these external factors on MDTC. To fill this research gap, this study aims to assess the planning-level ship traffic capacity of the Singapore Strait under mixed vessel compositions. In addition, the variances of this capacity will be further analysed by capturing the randomness of the MDTC among different vessel types.
The remainder of this study is organised as follows. In the next section, the estimation methodology of strait capacity is developed. Then, the collected data in the Singapore Strait are introduced. After that, based on the proposed methodology and collected data, the empirical results in the Singapore Strait are discussed. Finally, some conclusions are presented.
3. Methodology of capacity estimation
The traffic capacity of a strait is defined as the maximum number of vessels that can safely pass through a cross-section along the strait during a specific time interval
 $T$
under a given set of operation and environmental conditions. As mentioned above, capacity depends on the width and length of the fairway, the depth of the fairway, vessel compositions, vessel characteristics, and the safe distance required between successive vessels. This section will introduce the methodology for estimating the strait capacity and its variance, considering these factors. Before proceeding, the symbols used in the study are listed as follows:

3.1. Capacity definition
In practice, the shape of a fairway is usually not regular with different widths at different locations. To reflect the differences in capacities, it is necessary to divide a fairway into several sections according to different section widths and vessel speeds (Fan and Cao, Reference Fan and Cao2000). For instance, as is shown in Figure 2-I, the illustrated fairway is separated into three links because it has two links with different widths and two links with different speed regulations. Consequently, for each of these divided links, traffic capacities are different. It is worth emphasising that the narrowest sections of a waterway directly determine the strait capacity.
The link division and vessel separation in a strait fairway.

We first consider one simple link
 $n$
with width
 ${W_n}$
in the fairway. According to Fujii and Tanaka (Reference Fujii and Tanaka1971), when a waterway is so congested that overtaking is nearly impossible and vessels are almost at the same speed, it indicates that the traffic volume has reached the waterway capacity. As Figure 2-II shows, when the fairway reaches its planning-level capacity, all ships keep MDTC theoretically. Note that the MDTC between the centres of vessels must equal or exceed the size of the ship domain.
Suppose two vessel types with types
 $i \in {\bf{K}}$
and
 $j \in {\bf{K}}$
are travelling in this link at the same average speed
 ${V_n}$
. As illustrated in Figure 2-II, the required minimum spatial separation between the two vessels is denoted by
 ${S_{ij}}$
, which cannot be violated through the journey along with this link. Since the vessel percentage is independent, the probability of a vessel type
 $i$
following a vessel type
 $j$
is
 ${\rho _{ij}} = {\rho _i}{\rho _j},\forall i,j \in {\bf{K}}$
. Then, the average MDTC between two vessels sailing along this link is
 $${S_a} = \sum\limits_{i \in {\bf{K}}} {\sum\limits_{j \in {\bf{K}}} {{S_{ij}}{\rho _{ij}}} } $$
Next, the average width of the domain for vessel type
 $i$
is denoted by
 ${B_i}$
. Consequently, the average minimum width between two vessels sailing along link
 $n$
can be expressed by
 $${B_a} = \sum\limits_{i \in {\bf{K}}} {{B_i}{\rho _i}} $$
Finally, the maximum number of vessels that could pass through this fairway during the time interval
 $T$
, namely the strait capacity, is given by
 $${C_n} = 1.15T \cdot {{{V_n}} \over {{S_a}}} \cdot {{{W_n}} \over {{B_a}}}$$
where the parameter
 $1.15$
is the close packing ratio according to Fujii and Tanaka (Reference Fujii and Tanaka1971).
3.2. Random effects of the MDTC
Based on the above analysis, we will continuously add the randomness of MDTC and their effects on the estimation of waterway capacity. Typically, the MDTC between two vessel types is obtained as a constant, while ship domains of each vessel type are assumed to be some constant values based on empirical studies (Fan and Cao, Reference Fan and Cao2000; Kadarsa et al., Reference Kadarsa, Lubis, Sjafruddin and Frazila2017). However, in practice, ship domains are inevitably affected by some external factors, like hydrographical conditions, weather and tidal conditions. Given the heterogeneity of captains’ judgments, the ship domain for each vessel type may change with different captains, even under the same hydrographical condition. As a result, the MDTC will have some randomness and may follow specific distributions in many cases.
There is no doubt that the characteristics of ship domains have a direct effect on the randomness of the MDTC. To capture this randomness, we need to study the distributions of the ship domain. Since our main interest is the strait capacity with safe navigation, the Fujii approach will be appropriate because ‘it defines a spacing between ships with which the majority of navigators will feel comfortable’ (Coldwell, Reference Coldwell1983). According to Fujii and Tanaka (Reference Fujii and Tanaka1971), the ship domain of a vessel has an elliptical shape, with its major axis
 ${x_i}$
and minor axis
 ${y_i}$
for vessel type
 $i \in {\bf{K}}$
:
 $${x_i} = 7{L_i} \pm {L_i}$$
 $${y_i} = 3{L_i} \pm 0.5{L_i}$$
Here,
 ${L_i}$
denotes the vessel length for vessel type
 $i$
. Generally, the ship has a larger domain (with + in the above equations) when it is navigating in worse conditions (such as low visibility, high wind speed, narrow passage width, etc.), and vice versa. As shown in Figure 2-II, the MDTC between vessel types
 $i$
and
 $j$
cannot be less than the sum of their major semi-axes:
 $${S_{ij}} = 3.5({L_i} + {L_j}) \pm 0.5({L_i} + {L_j})$$
Based on the above analysis and Equations (1) and (2), the average MDTC can be expressed as follows:
 $${S_a} = \sum\limits_{i \in {\bf{K}}} {\sum\limits_{j \in {\bf{K}}} {\left[ {3.5({L_i} + {L_j}){\rho _{ij}} \pm 0.5({L_i} + {L_j}){\rho _{ij}}} \right]} } $$
and the average minimum width between two vessels can be calculated as follows:
 $${B_a} = \sum\limits_{i \in {\bf{K}}} {\left[ {3{L_i}{\rho _i} \pm 0.5{L_i}{\rho _i}} \right]} $$
Accordingly,
 ${S_a}$
may change in the closed interval
 $[{\underline S_a},{\bar S_a}]$
defined by Equation (7), while
 ${B_a}$
could vary in the interval
 $[{\underline B_a},{\bar B_a}]$
defined by Equation (8). For ease of expression, it defines
 $${L_a} = \sum\limits_{i \in {\bf{K}}} {{L_i}{\rho _i}} = \sum\limits_{i \in {\bf{K}}} {\sum\limits_{j \in {\bf{K}}} {0.5({L_i} + {L_j}){\rho _{ij}}} } $$
Next, to describe their randomness,
 ${S_a}$
and
 ${B_a}$
are assumed as two independent variables that follow the uniform distribution in their well-defined intervals. That is,
 $$f({S_a}) = {1 \over {{{S}_a} - {{\underline S}_a}}} = {1 \over {2{L_a}}}{\mkern 1mu} \quad f({B_a}) = {1 \over {{{\bar B}_a} - {{\underline B}_a}}} = {1 \over {{L_a}}}$$
Then, the expected value of the strait capacity,
 ${\rm{\mu}} ({C_n})$
, can be obtained as follows:
 $${\rm{\mu}} ({C_n}) = {\int}_{{{\underline S}_a}}^{{{\bar S}_a}} {\int_{{{\underline B}_a}}^{{{\bar B}_a}} {{C_n}} } f({B_a})f({S_a}){d_{{B_a}}}{d_{{S_a}}}$$
Note that the mean capacity indicates the number of vessels safely passing through this strait, where the probability of vessel type
 $i$
is
 ${\rho _i},i \in {\bf{K}}$
. To measure its dispersion or deviations, the variance of the strait capacity, denoted by
 ${\sigma ^2}({C_n})$
, is calculated as follows:
 $${{\rm{\sigma}} ^2}({C_n}) = \int_{{{\underline S}_a}}^{{{\bar S}_a}} {\int_{{{\underline B}_a}}^{{{\bar B}_a}} {{{\left[ {{C_n} - E({C_n})} \right]}^2}} } f({B_a})f({S_a}){d_{{B_a}}}{d_{{S_a}}}$$
That is, by allowing for the randomness of shop domain and MDTC, the values of expectation and variance,
 ${\rm{\mu}} $
and
 ${{\rm{\sigma}}^2}$
, measure the centre and variability of a probability distribution for the strait capacity. Taking the expressions of Equations (7)–(10) into Equations (11) and (12), we can get
 $\left[ {\rm{\mu}} ({C_n}),{{{\rm{\sigma}} ^2}({C_n})} \right] = \left[ {{{\left( {0.055658T{V_n}{W_n}} \right)} \mathord{\left/ {\vphantom {{\left( {0.055658T{V_n}{W_n}} \right)} {L_a^2}}} \right. } {L_a^2}},{{{{\left( {T{V_n}{W_n}} \right)}^2}} \mathord{\left/ {\vphantom {{{{\left( {T{V_n}{W_n}} \right)}^2}} {\left( {317.6L_a^4} \right)}}} \right.} {\left( {317.6L_a^4} \right)}} - {{\rm{\mu}} ^2}({C_n})} \right]$
The estimation of the ship domain plays an important role in the above analysis. Regarding the major and minor radii of Fujii’s elliptical ship domain, Zhang et al. (Reference Zhang, Meng and Fwa2019) pointed out that these ship domains should include a transverse navigation zone
 ${L_a}$
for two-way traffic without ship traffic separation. Namgung and Kim (Reference Namgung and Kim2021) theoretically added the velocity change into the calculation of major and minor radii, which can be used to estimate Fujii’s elliptical ship domain. In brief, different from these studies, this study further analyses the effects of the vessel composition and the randomness of MDTC on the estimation of the elliptical ship domain and the strait capacity.
4. Data collection
In this section, the relevant parameters used in the above capacity model will be collected from the Singapore Strait. It mainly includes two parts: (1) the physical conditions of the waterway layout in the Singapore Strait and (2) the vessel information and characteristics sailing along this strait.
4.1. Waterway layout of the Singapore Strait
The waterway layout describes the navigating boundaries of vessels in the Singapore Strait. To describe the different waterway characteristics in the Singapore Strait, SIGTTO (2015) further segmented the main strait into 15 legs of the voyage, where eight legs are eastbound and seven legs are westbound. There is a clear separation of eastbound and westbound lanes. The locations and boundaries of these legs are drawn in Figure 3.
Westbound and eastbound legs in the Singapore Strait.

As Figure 3 shows, the width of the 15 legs is not uniform. Along with the traffic separation scheme, the overall narrowest points of SoMS lie in Leg 12E and Leg 4W, i.e. the south of Saint John’s Island. Table 1 summarises the information on the two narrowest legs. Specifically, the geographical chokepoints measure approximately 1617 m eastbound, 530 m westbound and 2150 m overall for the main strait (MPA, 2019). According to government regulations, the maximum speeds of the two legs are both limited to 12 knots. Based on the AIS data, we obtain that the average speed of the main strait is approximately 12.13 knots eastbound and 10.75 knots westbound. However, we also find that the vessels commence reducing speed to 12 knots in Leg 8E and Leg 3W, and they are about to increase speed from 12 knots in Leg 13E and Leg 7W if navigating conditions are allowed (Qu et al., Reference Qu, Meng and Suyi2011). The data analysis also shows that the average speeds of 85% of cargo ships are 19.1 knots in Leg 4W and 17.5 knots in Leg 12E.
Summary of narrow sectors in the Singapore Strait

Note: Speed I and Speed II refer to Qu et al. (Reference Qu, Meng and Suyi2011).
4.2. Vessel classification and characteristics
The AIS data contain the vessel movement data and characteristics of 70,509 vessels sailing along the Singapore Strait, which is provided by the Maritime and Port Authority (MPA) of Singapore. According to the data, these vessels are classified into 11 main types, which include tug, bulk, general cargo, chemical carrier, container, combination, fishing, passenger, fleet and small boats, maintenance vessels, and others. This general classification method based on vessel characteristics has been adopted by many studies (Qu et al., Reference Qu, Meng and Suyi2011; Zhang et al., Reference Zhang, Meng and Fwa2019). However, vessel lengths of the same vessel type generally have considerable differences.
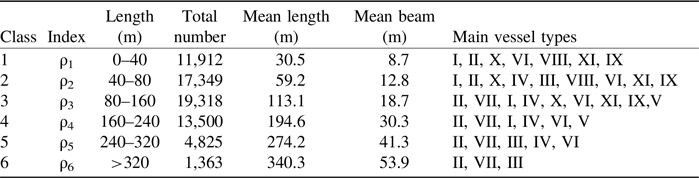
In contrast, our methodology analyses indicate that the vessel length plays a significant role in the estimation of the ship domain, so it is necessary to examine the ship classification in terms of ship length. Luckily, the AIS data of vessel characteristics include MMSI number, vessel type, length, beam, etc. Because the AIS data have some inevitable noise, we need to do a data-cleaning procedure first by adopting the procedure proposed by Qu et al. (Reference Qu, Meng and Suyi2011). After that, we get 68,267 vessels and their characteristics from this database. As a result, we can classify these vessels in terms of their lengths. Here, the filter standard of ‘Length intervals’ refers to the ‘Shipfinder’ website (Lu et al., Reference Lu, Kang, Gao and Meng2018; Shipfinder, 2019). As Table 2 shows, all of these collected 68,267 vessels in the AIS database are divided into six categories by their different lengths. Moreover, the mean length, mean beam and ship types are also summarised in this table. Typically, the large-sized ships, whose lengths are over 240 m, are sorted into Class 5 and Class 6. From the main vessel types of each class, it can be found that large-sized ships mainly include bulk carriers, oil tankers and container ships.
Length-based vessel classifications and characteristics

Note: I-General cargo, II-Bulk Carrier, III-Oil Tanker, IV-Liquefied natural gas, V-Roll-on/Roll-off, VI-Passenger ships and cruises, VII-Container ship, VIII-Fishing, and other small boats, IX-Unclassified, X-Maintenance, XI-Tug.
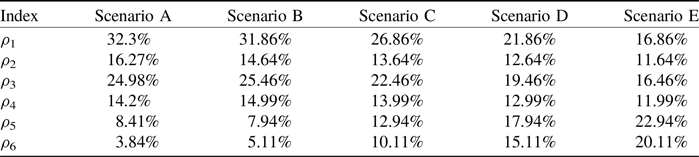
Based on the above length-based vessel classification, some realistic scenarios of traffic composition can be derived through the statistical analyses of the AIS data. To achieve the actual vessel composition, we adopt the vessel position data retrieved from the AIS data over the Singapore Strait from one week of a certain year. For example, the analysis result reveals that the AIS data in one hour of Day 1 includes 1,641 valid vessel data in average sailing along the whole strait, where Class 6 takes approximately 3.84% with 63 large-sized ships. In contrast, the result of Day 4 contains 1701 valid vessel data, with Class 6 accounting for a larger composition of 5.11%, representing 87 large-sized ships along this strait.
To reveal the effects of different vessel compositions, Table 3 summarises five typical scenarios of vessel compositions. Specifically, the representative Scenarios A and B are obtained from the statistical analysis of AIS data on Day 1 and Day 4, respectively. In addition, to reveal the effects of vessel composition on the strait capacity, Scenarios C, D and E are hypothetical scenarios that are designed by including different vessel compositions. The vessel composition is designed by increasing large-sized ships and reducing small ships.
Scenario design of vessel traffic compositions

Note: Scenario A comes from Day 1 and Scenario B comes from Day 4.
5. Results discussion
This section discusses the assessment results of traffic capacity in two chokepoints of the Singapore Strait, i.e. Leg 12E and Leg 4W, by adopting our proposed methodology and collected data. It first gives an introduction to the strait capacity and its variance for each vessel class defined in Table 2. Then, it examines the mean strait capacity and its variance under different vessel compositions. Finally, it compares our results with the other estimation methods.
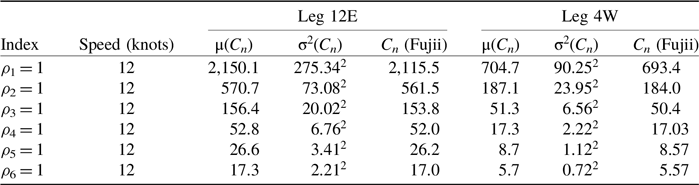
Table 4 summarises the planning-level capacity per hour and its variance based on our length-based vessel classification and the representative Fujii approach. These strait capacities are calculated at the regulated speed limitation (12 knots) in the Singapore Strait. These results could reveal some straightforward characteristics of strait capacity. First, with the increase in vessel length, the expected values and variances of capacity are reduced. For instance, 2,150.1 vessels of Class 1 or 17.3 vessels of Class 6 are expected to pass through Leg 12E per hour, while the standard variances are reduced from 275.34 vessels of Class 1 to 2.21 vessels of Class 6. Second, for each vessel class, these average values of strait capacity are almost consistent with the representative capacity calculated by Fujii and Tanaka (Reference Fujii and Tanaka1971). As Figure 4 illustrates, the strait capacities of Leg 12E estimated by the two methods are very close, just with a small percentage of differences. Third, the capacity is positively affected by the width of the narrow sections in the strait. Considering that the width of the eastbound chokepoint is larger than that of the westbound, the strait capacity of Leg 12E is larger than that of Leg 4W. Specifically, Table 4 shows that the capacity of Leg 12E is 570.7 for vessel Class 2, and it is much larger than that of Leg 4W (which is 187.1). In brief, this table confirms that the average lengths of vessels and the width of the strait play some prominent roles in the assessment of strait capacity.
Assessment of strait capacity based on vessel classifications

Strait capacities of Leg 12E for different vessel classes.

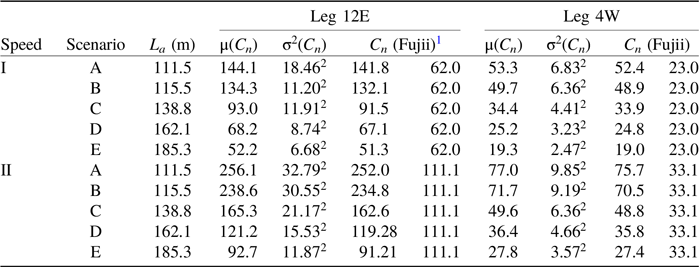
Table 5 examines the strait capacity under different vessel compositions of Scenarios A–E and with two pairs of average speeds (i.e. Speed I and Speed II). For instance, under Scenario A with Speed I, the expected strait capacity of Leg 12E is 144.1 vessels and its standard variance is 18.46 vessels. That is, approximately 144.1 vessels on average can safely pass through this strait when their average speed is 12.13 knots, while these vessels mainly include 32.3% vessels in Class 1, 16.27% vessels in Class 2, 24.98% vessels in Class 3, 14.2% vessels in Class 4, 8.41% in Class 5 and 3.84% vessels in Class 6. Also, it tabulates two values of strait capacity estimated by the Fujii approach. The first one calculates the ship domain by using Equations (6)–(9) and the second one directly adopts the root mean square value of the six average vessel lengths L’.
Assessment of strait capacity under Scenarios A–E

In essence, Table 5 shows that the vessel composition and vessel speed play important roles in the estimation of strait traffic capacity. First, with the increasing proportion of large-sized ships, the estimated values of strait capacity decrease accordingly. Apparently, the increase in large-sized ships leads to the growth of the average length of vessels
 ${L_a}$
, and then the derived value of strait capacity declines correspondingly. For instance, under Speed I, the traffic capacity of Leg 12E is reduced from 144.1 vessels in Scenario A to 52.2 vessels in Scenario E. Next, the increase in average speed directly improves the strait capacity. For example, the strait capacity of Scenario B is 134.3 vessels under Speed I, while it greatly increases to 238.6 vessels under Speed II. Furthermore, Table 5 shows some interesting results by comparing μ(C
n
) with C
n
. Specifically, when the Fuji approach takes the ship domain with the average length
 ${L_a}$
from Equation (9), the obtained capacities are close to our results, verifying the effectiveness of our methodology. When the Fuji approach takes the ship domain with L’, the same strait capacity under five different scenarios highlights the significance of vessel compositions.
To evaluate the effectiveness of our analysis, Figures 5 and 6 illustrate the strait capacity of Leg 12E under four ship-domain estimation methods, which are introduced as follows:
-
1. ‘Method Lu’ represents the capacity estimation methodology proposed by this study.
-
2. ‘Method Fu’ denotes the representative capacity estimation method proposed by Fujii and Tanaka (Reference Fujii and Tanaka1971), in which the average length is
 $L' = {L_a}$
.
-
3. ‘Method Zh’ calculates the capacity by using the ship-domain estimation method under ‘critical meeting situation for free navigation conditions without a ship traffic separation zone’ according to Zhang et al. (Reference Zhang, Meng and Fwa2019).
-
4. ‘Method Na’ estimates the long and short radii of the elliptical ship domain by adding the velocity change of vessels, referring to Namgung and Kim (Reference Namgung and Kim2021).

Comparison of strait capacity under different scenarios and estimation methods.

Illustration of strait capacity of Leg 12E under four estimation methods.

In brief, Figure 5 compares the capacity of Leg 12E under five scenarios based on four estimation methods. As a supplement, Figure 6 further chooses two representative scenarios (A and E) to show the specific traffic capacity. First, our estimated results align closely with the intermedia values obtained by the other three methods. Specifically, ‘Method Fu’ yields similar results to our capacity values. Conversely, ‘Method Zh’ presents a higher capacity by defining a narrow ship domain, while ‘Method Na’ derives a lower capacity by considering velocity changes and enlarging the ship domain. Second, our method calculates the variances of the strait capacity based on the randomness effects of MDTC. Figures 5 and 6 show that the calculated results of ‘Method Zh’ and ‘Method Na’ may exhibit significant differences under a given speed, resulting in varying intervals of strait capacity. However, the expected average value and standard variances of the strait capacity, represented by the shaded areas in Figure 5 and the variance ranges in ‘Method Lu’ of Figure 6, consistently fall within these intervals. This convergence towards our shaded areas can be seen as a superiority of our method. Third, under all four estimation methods, the traffic capacities display an obvious increase from Speed I to Speed II, while they show a direct decrease from Scenario A to Scenario E. For instance, with an increasing proportion of large-sized ships, the strait capacity in Scenario E is smaller than that in Scenario A, but the acceleration of vessel speed (i.e. Speed II) enlarges the strait capacity. These phenomena underscore the importance of vessel composition in capacity estimation, particularly when considering large-sized ships and different vessel speeds.
6. Conclusions
This study evaluated the planning-level traffic capacity of the Singapore Strait under the impacts of various vessel compositions, especially with increasing propositions of large-sized ships. An estimation method for the strait capacity and its variance was developed by using the distributions of MDTC from the ship domain of different vessel types. Then, the necessary parameters in the proposed capacity model were derived by the statistical analysis of AIS data collected from the Singapore Strait. Finally, through adopting our proposed methodology and collecting empirical data, the values of strait capacity and its variances were estimated in two chokepoints (i.e. Leg 12E and Leg 4E) of the Singapore Strait. It was found that the estimated values of strait capacity decreased with the increasing proportion of large-sized ships. Furthermore, by comparing with three other ship domain estimation methods, the empirical results confirmed the significant impacts of some parameters on the assessment of strait capacity, including the strait width, vessel size, vessel composition and vessel speed. In brief, this study offered a useful method to estimate the strait capacity under various vessel compositions.
The proposed ship domain-based capacity assessment problem is a meaningful research issue with practical significance. The contributions of this study can be further expressed in the following two aspects. First, a useful planning-level capacity assessment methodology is proposed by using the strait waterway division and MDTC between different vessel types. Second, under different propositions of large-sized ships, the values of strait capacity and their variances are estimated and discussed in two representative chokepoints of the Singapore Strait.
It is worth mentioning that this study estimates the strait capacity and its variance at the planning level, where all vessels should keep MDTC and have no violations of their safety domains. On the one hand, one purpose of the planning-level traffic capacity estimation is to control the traffic volume or to evaluate the traffic density situation in a specific sea area, in which the evaluation of the estimated results is an important work. Accordingly, one interesting future study is to evaluate the estimated traffic capacity whether it is adequate, overcrowded or idle. On the other hand, at the operational level, the vessels may have dynamic interactions and influences on each other. With the aid of computer simulators, this operational-level capacity could be obtained from the planning-level capacity by adding the effects of the frequency of bad weather, sea conditions, dynamic driving behaviours and some other safety factors. Thus, future work is to use ship traffic simulators to verify the performance of our proposed model and examine the effects of large-sized ships on the operational-level capacity.
Funding statement
This study is supported by the research project ‘Impact Analysis of Large Ships on Ship Traffic in the Straits of Malacca and Singapore’ funded by the Singapore Maritime Institute, the Fundamental Research Funds for the Central Universities (2682025GH011), the Sichuan Provincial Philosophy and Social Science Foundation of China (No. SCJJ24ND308, SCJJ23ND191), and the Talent Fund of Beijing Jiaotong University (2025XKRC007).