I. INTRODUCTION
Extensive investigations have been carried out upon polycrystalline materials with high strength. Reducing grain sizes is found to be an effective way of increasing material strength. However, when the grain sizes are reduced to the nanometer scale, certain exceptions could take place. Farkas, Reference Farkas1 for example, found that the fracture resistance decreased when the mean grain size increased from 5 to 8 nm. Meyers et al. Reference Meyers, Mishra and Benson2 and Zhu and Li Reference Zhu and Li3 also reported that the strength of polycrystalline metals increased but their ductility was reduced with the increasing grain size.
Grain size distribution is found to have a significant effect on the mechanical performance of nanocrystalline materials. Distinct from the low ductility of nanocrystals with uniform grain size, a bimodal grain size distribution can give the material both high strength and ductility. Reference Wang, Chen, Zhou and Ma4–Reference Ovid'Ko and Langdon6 In the tensile experiments of the distributed grain size specimens, up to 10 times higher yield strength and excellent tensile plasticity were achieved by coating the coarse-grained copper substrate with a gradient grain-size transition film, and cracks were found to initiate preferentially in the coarse-grained rather than the fine-grained regions. Reference Fang, Li, Tao and Lu7 The fatigue experiments indicated that grain refinement led to an increase in total life, but also had a deleterious effect on the resistance to fatigue crack growth. Reference Hanlon, Tabachnikova and Suresh8 This prompted our investigations into the internal mechanisms behind the behavior of nanocrystalline materials with grain size gradients.
During the synthesis process, it is generally difficult to keep materials free of defects such as pores and impurities. These defects degenerate the inherent mechanical properties of nanocrystalline materials and can lead to brittle fracture under tensile loading. To improve the fracture resistance, some potential toughening mechanisms, such as a high strain hardening rate, Reference Wang, Chen, Zhou and Ma4 plastic deformation induced by grain growth, Reference Fang, Li, Tao and Lu7 and twin boundaries, Reference Zhou and Qu9–Reference Ovid Ko and Skiba12 have been investigated experimentally and numerically. In addition, the effects of grain size Reference Farkas1,Reference Farkas, Van Swygenhoven and Derlet13,Reference Ovid Ko and Sheinerman14 and grain boundary impurities Reference Chen, Kalia, Kaxiras, Lu, Nakano, Nomura, van Duin, Vashishta and Yuan15 on fracture toughness were also evaluated. However, there have been relatively few studies on the effect of grain size gradient on fracture toughness, even though it can effectively optimize the internal structure of nanocrystals to improve performance.
In numerical investigations into the fracture behavior of nanostructured materials, the molecular dynamics (MD) method is a popular tool. Reference Cao and Wang16,Reference Xie, Wang and Yu17 In this study, the fracture behaviors of precracked nanocrystalline Ni with grain size gradients are simulated using the MD method to analyze the effect of grain size gradient on fracture behavior and the atom-level deformation and fracture mechanisms.
II. METHODS
A series of atomic models of quasi-three-dimensional face-centered-cubic (FCC) nanocrystalline Ni samples with an idealized
 $\left[ {1\bar 10} \right]$
texture and dimensions of 100 × 100 × 2 nm3 are created. The
 $\left[ {1\bar 10} \right]$
axis is treated as the Z direction.
Reference Zhou and Qu9,Reference Zhou, Qu and Yang10,Reference Yamakov, Wolf, Salazar, Phillpot and Gleiter18
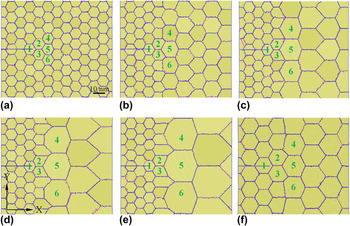
In these samples, Sample I has a uniform grain size of 10 nm, whereas Samples II, III, IV, and V have different grain size gradients from 10 nm on the left half to 15, 20, 25, and 30 nm on the right half, respectively. They are used for evaluating the effect of the grain size gradient on fracture behavior. Sample VI has the left grain size of 15 nm and the right grain size of 20 nm for excluding the effect of the mean grain size by comparison with Sample II.
The misorientation angle of the tilt grain boundary can considerably affect the grain boundary energy and cracking behavior. To exclude this influence, the crystallographic orientations (namely the smallest angles with respect to the X direction) of six grains (numbered 1–6) ahead of the precrack tip are fixed at −45, 90, 0, 0, −45, and 90°, respectively, as shown in Fig. 1. The remaining grains are oriented randomly. Grain shape is also a significant factor. To minimize this effect, all of the grains have a roughly hexagonal shape, constructed with the aid of the modified Voronoi method. Reference Yamakov, Wolf, Salazar, Phillpot and Gleiter18,Reference Chen19 The initial configurations from Samples I to VI are shown in Fig. 1.
Initial configurations of Samples I to VI: (a) Sample I with a uniform grain size of 10 nm, (b) Sample II with 10 nm grains on the left and 15 nm grains on the right, (c) Sample III with 10 nm grains on the left and 20 nm grains on the right, (d) Sample IV with 10 nm grains on the left and 25 nm grains on the right, (e) Sample V with 10 nm grains on the left and 30 nm grains on the right, and (f) Sample VI with 15 nm grains on the left and 20 nm grains on the right. The crystallographic orientations of Grains 1–6 in each sample are fixed at −45, 90, 0, 0, −45, and 90°, respectively.

The open source code LAMMPS Reference Plimpton20 is used for the simulations. The samples are modeled with the empirical embedded-atom method potential based on the first-principles calculation. Reference Mishin, Farkas, Mehl and Papaconstantopoulos21 Before loading, the samples are relaxed at 300 K to obtain equilibrium configurations and then slowly cooled to 10 K. To introduce an atomically sharp crack with a length of 29 nm, the pairwise interactions between two slabs of atoms are turned off by rejecting them from the neighbor list. Reference Plimpton20 The initial crack tips are located inside Grain 1 for all the samples, to avoid unstable crack propagation along a grain boundary at the initial stage of loading, as shown in Fig. 1. Both of the surface layers are fixed and have a thickness of 2 nm at the top and bottom. The tensile displacement loading with a constant rate of 2.5 × 10⁸ s−1 along the Y direction is applied. The canonical (NVT) ensemble is used for tracing the atomic trajectories. The MD integration step size is 1.0 fs.
The common neighbor analysis method Reference Faken and Jónsson22 is used to identify the crystalline structures during the visualization. Various colors are assigned to different atoms in atomic configuration figures, according to their profiles. The FCC atoms are marked yellow, the hexagonal close packed (HCP) atoms marked pink, and the rest marked blue. A single line of HCP atoms represents a twin boundary, two adjacent HCP lines represent an intrinsic stacking fault, and a FCC line between two HCP lines represents an extrinsic stacking fault. The 3D visualization software OVITO is used for visualizing the atomistic simulation data. Reference Stukowski23
III. RESULTS AND DISCUSSIONS
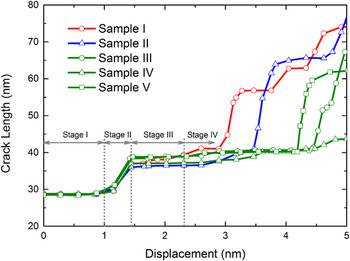
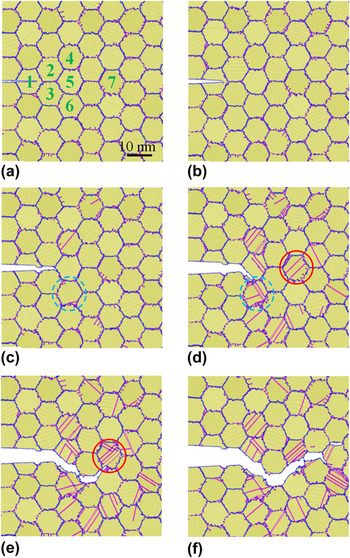
The crack length is defined as the horizontal distance from the crack mouth to tip. It is plotted as a function of the displacement in Fig. 2 for Samples I to V. The crack length versus displacement curves obviously have four stages and different shapes. For illustrative purposes, the crack propagation close-ups of Sample I at different loading displacements are given in Fig. 3, as an example. In Stage I, the curves are nearly horizontal before the displacement reaches 1 nm. Figures 3(a) and 3(b) show that the crack is arrested inside Grain 1, due to higher fracture resistance of grain interiors. In this stage, the five curves almost overlap, as the five samples have similar grain arrangements near their initial crack tips. In Stage II, the crack passes through Grain 1 and then propagates along the grain boundary between Grains 2 and 3, as shown in Fig. 3(c). The grain boundary between Grains 2 and 3 is almost parallel to the crack propagation direction. The crack length rapidly increases from about 29 to 38 nm, as shown in Fig. 2, because a grain boundary parallel to the crack propagation direction generally has a low fracture resistance. Different from Stage I, the curves begin to separate from each other due to their slightly different slopes. In Stage III, the crack is hindered by Grain 5, shown in Fig. 3(d), so that it propagates along the boundary between Grains 3 and 5. Different from the Mode I cracking in Stage II, this is a mixed cracking mode with a piece of flat crack length curve shown in Fig. 2. After the displacement exceeds 2.31 nm, the crack propagation enters into the rapidly or slowly ascent Stage IV. Sample I first starts a sharp cracking process along the boundary between Grains 5 and 6 at the displacement of about 2.89 nm, as shown in Fig. 3(e). Sample II follows it at the displacement of about 3.47 nm. Nevertheless, the other three samples keep their slow cracking paces before the displacement exceeds 4.19 nm. This indicates that a large grain size gradient can hinder crack propagation, which was also found in the tensile experiments, Reference Lu, Lu and Karihaloo24 and the arrested crack evolved into a hole with increasing displacement. In addition, the analogous phenomenon was observed in the nanoindentation tests. Reference Xu, Mao, Xie and Munroe25 It is revealed that the grain size gradient can serve as a barrier against crack propagation. Finally, the complete crack path of Sample I is shown in Fig. 3(f). Its “cup–cone” morphology is similar to the previous experimental observations. Reference Li and Ebrahimi26
Crack length versus displacement curves for Samples I to V.

Close-ups of the crack path for Sample I at displacements of (a) 0.02, (b) 1.11, (c) 1.54, (d) 2.84, (e) 3.37, and (f) 4.82 nm. Grain 6 is marked by a light green dashed-line circle and Grain 7 by a red solid-line circle in subfigures (c)–(e).

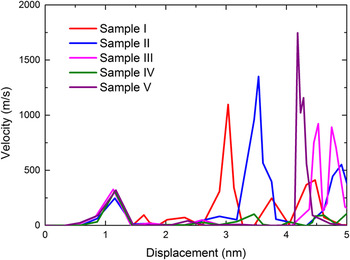
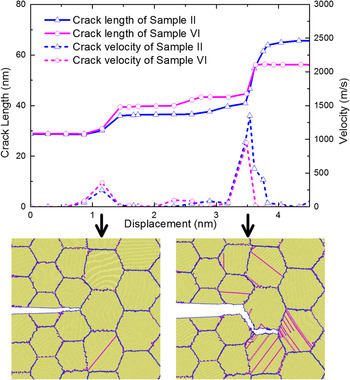
For clearer illustration, the crack propagation velocities are plotted as a function of the displacement in Fig. 4 for Samples I to V. Some tall pulses corresponding to high crack propagation velocities are found in these curves, and the tall pulses appear earlier for Samples I and II. However, it should be noticed that as the grain size gradient increases from Samples I to V, the mean grain size increases as well. So some of the effect observed could be caused by the increasing mean grain size. To evaluate the effect of the mean grain size, Sample VI is computed and compared with Sample II. They have a common grain size gradient but different mean grain sizes. Both their crack length and crack propagation velocity curves are plotted in Fig. 5. Their good agreements in the curve shape and trend indicate a slight effect of the mean grain size on fracture performance. The two observed pulses in the crack propagation velocity curves correspond to the crack configurations when the cracks meet with Grain 5 and another coarse grain, respectively.
Crack propagation velocity versus displacement curves for Samples I to V.

Crack length and crack propagation velocity curves for Samples II and VI, and the crack configurations of Sample VI corresponding to the pulses in the crack propagation velocity curves.

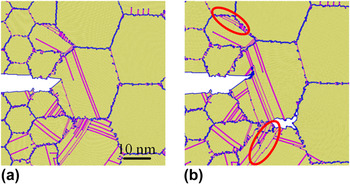
Grain size strongly affects the fracture mode. Fine-grained metals generally have high strength, but once a crack buds inside them it will easily bypass small grains to propagate rapidly. Reference Yamakov, Saether, Phillips and Glaessgen27 In this study, it is found that the intergranular fracture is kept in Samples I and II without or with small grain size gradients, but the fracture mode is transformed from intergranular to intragranular in Samples III, IV, and V with larger grain size gradients. As an example, Fig. 6 exhibits the crack path close-ups of Sample IV at displacements of 3.99 and 4.33 nm. Unlike pure intergranular crack propagation, when the crack initially encounters coarse Grain 5, it slightly penetrates the coarse grain, but is quickly halted due to the difficulty of intragranular crack propagation [see Fig. 6(a)]. A new crack is simultaneously produced in the grain boundary triple junction [see Fig. 6(b)] and soon connects with the primary crack. It is quite clear that a crack would initiate at the grain boundary when plastic strain between neighboring grains could not be accommodated by slip. The analogous phenomenon was also found in the experiments Reference Fang, Li, Tao and Lu7,Reference Ovid Ko28 and other MD simulations. Reference Zhang, Millett, Tonks and Biner29 Therefore, the cracking path becomes longer and more circuitous. As the fracture energy increases with the crack trajectory length, Reference Pozdnyakov and Glezer30 the fracture toughness is improved.
Close-ups of the crack path for Sample IV at displacements of (a) 3.99 and (b) 4.33 nm. Deformation twins are marked by red solid-line ellipses.

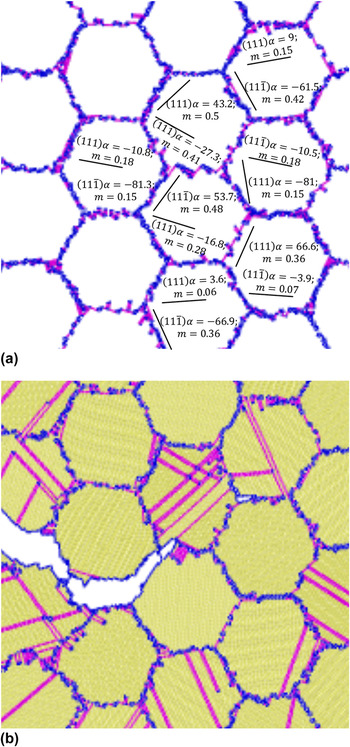
As a complex process, fracture of nanocrystalline Ni is always accompanied by formation and development of dislocations or deformation twins. Reference Kumar, Suresh, Chisholm, Horton and Wang31 In Sample I, before the crack encounters Grain 6 (marked by a light green dashed-line circle in Fig. 3) there are few dislocations, as shown in Figs. 3(a)–3(c). However, when it reaches Grain 6, numerous Shockley partial dislocations take place due to stress concentration, as shown in Fig. 3(d). These dislocations originate from the grain boundaries and glide into the grain interior. When the leading dislocations pass through the grains and again encounter the grain boundaries, they are absorbed but some stacking faults are left inside the grains. Subsequently, when the crack meets with Grain 7 (marked by a red solid-line circle in Fig. 3), the above process is repeated, as shown in Fig. 3(e).
It is also found from Fig. 3 that there are different numbers of active dislocations in different grains. The shear stress on the active slip system is responsible for dislocation nucleation, as seen in our previous simulations
Reference Zhou, Yang and Chen32
and the other researches.
Reference Yamakov, Wolf, Salazar, Phillpot and Gleiter18,Reference Cheng, Xu, Jian, Yuan, Tsai, Zhu, Zhang and Millett33
To explain it, the Schmid factors for the slip systems of
 $\left( {111} \right)[11\bar 2]$
and
 $\left( {11\bar 1} \right)[112]$
and the atomic configuration of the grains near the crack tip of Sample I at a displacement of 3.37 nm are plotted in Figs. 7(a) and 7(b), respectively. In Fig. 7(a), α is the angle between the slip plane and the X direction, and m represents the Schmid factor for the slip system with respect to the Y direction. It appears that dislocations nucleate and glide more easily in a slip system with a bigger Schmid factor. It is worth noting that deformation twins are formed in Sample IV. They are marked by red solid-line ellipses in Fig. 6. As an important deformation mechanism of polycrystalline materials,
Reference Wang, Sansoz, LaGrange, Ott, Marian, Barbee and Hamza34,Reference Zhu, Liao and Wu35
deformation twins are generally induced by the nucleation and glide of partial dislocations in the adjacent slip plane of an earlier-nucleated Shockley partial dislocation.
Reference Zhu, Li and Huang36
Dislocation nucleation on active slip systems: (a) the orientations and the Schmid factors for grain slip systems in the initial configuration of Sample I and (b) a snapshot of dislocation nucleation in Sample I at a displacement of 3.37 nm.

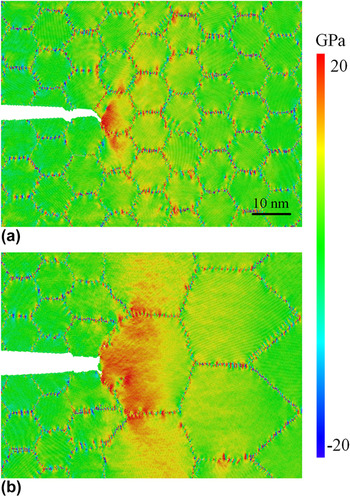
Crack opening is always driven by local stress concentration. Reference Ovid'Ko, Sheinerman and Aifantis37,Reference Ovid'Ko and Sheinerman38 To understand fracture mechanisms deeply, the distributions of the atom-level virial stress in the loading direction σ yy Reference Yang, Zhou and Chen39 are plotted in Fig. 8(a) for Sample I at a displacement of 2.17 nm and (b) for Sample IV at a displacement of 3.56 nm. Obviously, there are higher local stresses near the crack tips and in the grain boundaries, so the cracks are apt to initiate at the crack tips and propagate along the grain boundaries. It is also noticed that Sample IV has a much larger high stress region than Sample I, which reveals that a sample with a larger grain size gradient can mobilize more atoms to resist fracture, so it has a stronger fracture resistance. In addition, high local stress can promote deformation twins to initiate and grow, Reference Wang, Chen, Zhou and Ma4 so it can be seen in Fig. 6 that the samples with larger grain size gradients have more visible deformation twins.
Stress contours near the crack tip: (a) for Sample I at a displacement of 2.17 nm and (b) for Sample IV at a displacement of 3.56 nm.

Energy dissipation is associated with deformation mechanisms in the fracture process. An energy analysis is carried out by dividing the total energy into elastic and inelastic components. The elastic energy can be expressed as
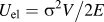 $U_{{\rm{el}}} = {{\sigma ^2 V} \mathord{\left/ {\vphantom {{\sigma ^2 V} {2E}}} \right. \kern-\nulldelimiterspace} {2E}}$
, where σ, V, and E are the stress, volume, and Young's modulus of the system, respectively. The inelastic energy U
inel is calculated by subtracting the elastic energy from the total energy of the system.
Reference Zhang and Ghosh40
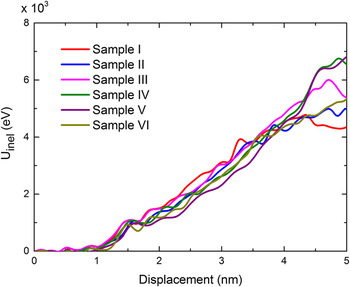
The inelastic energies are plotted as functions of the displacement for Samples I to VI in Fig. 9. Compared with the corresponding crack length curves in Fig. 2, it is clear that a rapid increase in the crack length is always accompanied by an abnormal increase in the inelastic energy. The inelastic energy can be further broken down into two components
Reference Zhang and Ghosh40
: the intragranular defect energy and the crack surface energy,
 ${U_{{\rm{inel}}}} = {U_{{\rm{def}}}} + 2{\gamma _{\rm{s}}}A$
, where U
def is the energy of intragranular defects including dislocations, twin boundaries, and stacking faults. 2γs
A is the crack surface energy term, γs is the surface energy per unit area, and A is the crack surface area. The intragranular defect energy is associated with the plastic region size. It is obvious that the plastic region size, as well as the crack surface area and the inelastic energy, increases quickly as the crack grows.
Inelastic energy versus loading displacement curves for Samples I to VI.

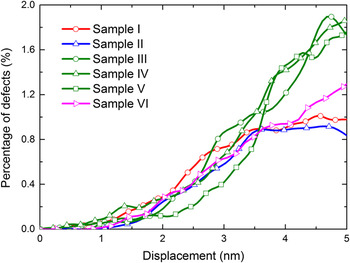
For all the above samples, their grains have initially perfect FCC structures, but dislocations and stacking faults give rise to large numbers of HCP atoms after the displacement loading is applied. The increase in the HCP atom number can be used as a measure for new defects occurring inside the grains. The percentage of HCP atoms is plotted as a function of the displacement in Fig. 10. Its monotonous increase with displacement is consistent with the variation of inelastic energy with displacement shown in Fig. 9. Obviously, for Samples I and II, the HCP atoms are saturated when the displacement reaches 3.5 nm, but for Samples III, IV, and V, the HCP atoms increase monotonously even when the displacement reaches 5 nm. It indicates that Samples III, IV, and V can accommodate more intragranular defects than Samples I and II. The HCP atom curve of Sample VI twines that of Sample II with the same grain size gradient but different mean grain sizes, which indicates the slight effect of mean grain size again. The resolved shear stress is the in-plane component τ xy of the atom stress tensor. Reference Shimokawa, Tanaka, Kinoshita and Higashida41 As an important factor responsible for dislocation nucleation, it is plotted in Fig. 11, for Sample II at displacements of (a) 3.02 and (b) 3.56 nm. It is clear that there exists high shear stress inside the grains around the crack tip, which induces intragranular defects. When the crack starts to propagate, the shear stress near the crack tip is relaxed so that the HCP atoms are saturated. For the samples with larger grain size gradients, most of the fracture energy is dissipated in initiation and evolution of intragranular defects, so they have higher resistance to crack propagation.
Defect atom percentage versus loading displacement curves for Samples I to VI.

Resolved shear stress contours near the crack tip for Sample II at displacements of (a) 3.02 and (b) 3.56 nm.

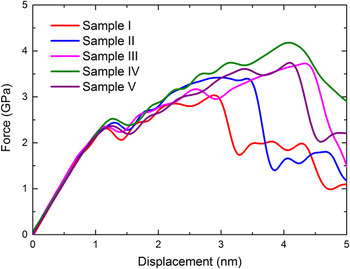
Although a large grain size gradient is beneficial for ductility, its effects on strength and fracture toughness are doubtful. Figure 12 shows that the ultimate strength increases monotonously from Samples I to II, III, and IV, but decreases from Samples IV to V. The critical stress intensity factor is calculated as
 ${K_{\rm{C}}} = F\sigma \sqrt {\pi a}$
, where F, σ, and a are the boundary correction factor, nominal stress, and critical crack length, respectively.
Reference Uhnakova, Pokluda, Machova and Hora42
The five samples have the critical stress intensity factors of 2.29, 2.55, 2.82, 3.13, and 2.80 MPa√m, respectively. Similar to the strength results, Sample IV obviously has the maximum critical stress intensity factor. It indicates that an inappropriate grain size gradient is harmful to both the strength and the fracture toughness. The grain size gradient should, therefore, be carefully designed to improve the fracture toughness of nanocrystals without any loss of strength.
Load versus displacement curves for Samples I to V.

IV. CONCLUSIONS
The fracture behavior of nanocrystalline Ni samples with different grain size gradients is simulated using the MD method. The following conclusions are given.
-
(1) A nanocrystal with a larger grain size gradient can mobilize more atoms to resist fracture, so it has higher fracture toughness. As a result, a large grain size gradient can serve as a barrier against crack propagation in nanocrystalline materials.
-
(2) Nanocrystals with uniform grain size or a small grain size gradient exhibit pure intergranular fracture, whereas in those with larger grain size gradients, the fracture mode is transformed from intergranular to intragranular when the crack is obstructed by a coarse grain.
-
(3) Inelastic energy is closely associated with intragranular defects and crack opening. The larger the grain size gradient, the greater the contribution of intragranular defects to fracture energy dissipation, and the higher the fracture toughness.
In addition, the effects of temperature and loading rate on the single-crystal deformation and fracture were investigated in recent years. Reference Zhu, Li, Samanta, Leach and Gall43–Reference Zhou, Zhang and Qu45 It could be inferred that both temperature and loading rate are also important influencing factors of the deformation and fracture behavior of nanocrystalline metals. Their effects will be carefully analyzed and evaluated in our future work.