Introduction
Modern democracies are characterized by regular and free elections, the legitimacy of which can suffer in the face of perceptions of unfairness and unequal treatment of voters (Reference NorrisNorris 2014). An election can fail to treat all voters equally if there are meaningful differences in vote tabulating technologies across an electorate (Reference Kimball and KropfKimball and Kropf 2008); if some voters must contend with registration hurdles that others do not (Reference Ansolabehere, Hersh, Burden and StewartAnsolabehere and Hersh 2014); if some voters face strict photo identification requirements and others no such requirements (Reference Bentele and O’BrienBentele and O’Brien 2013); and if some voters must travel longer distances than others to cast their ballots (Reference Amos, Smith and Ste. ClaireAmos, Smith, and Ste. Claire 2017; Reference Dyck and GimpelDyck and Gimpel 2005). More generally, when, in a given election, the cost of voting in the sense of Reference DownsDowns (1957) varies significantly by voter group—where group membership could be based on race/ethnicity or party affiliation, for example—the principle of equal treatment of voters is at risk.
There are two reasons that voting lines, whose lengths reflect interactions between in-person voter turnout at polling locations and administrative decisions about resource allocation (Reference Herron and SmithHerron and Smith 2016), are related to equal treatment. First, waiting in line to vote is a time tax (Reference MukherjeeMukherjee 2009). This tax can be negligible—for example, a voter waits a scant number of seconds prior to initiating her voting process—or imposing—some of the Florida voters we describe shortly waited several hours to vote in 2012. Associated with a voting line time tax are the distributional questions associated with all forms of taxation: is the burden of this tax spread equally across voters or concentrated on groups of them?
Second, waiting in line to vote may have “downstream” electoral effects in the sense of Reference PettigrewPettigrew (2017a). When an individual is compelled to pay a relatively high tax to participate in a political activity, a natural response might be to avoid the activity, or substitute for it, in the future. If voting lines operate in this fashion, then they will depress voter turnout. And if lines affect some voter groups more than others, then their associated depressive effect on turnout will not burden all voters equally. Potentially unequal burdens notwithstanding, given the relatively low rate of voter participation in American presidential elections—approximately 58 percent of the eligible population turned out in 2012 and 60 percent in 2016—any aspect of the voting experience that may have a depressive effect on turnout should be considered a matter worthy of study. Footnote 1
The time tax associated with voting lines and their possible downstream consequences are conceptually distinct. The former could be uniformly spread across voters, which might be normatively pleasing in the sense of not violating equal treatment, and yet there could be a significant effect of waiting in line on future electoral participation. Or, the time tax could be concentrated on certain voter groups, violating equal treatment regardless of whether there are downstream consequences of waiting to vote.
Given the relationship between voting lines and potential violations of equal treatment, one would expect a robust literature to have developed on this subject. However, beyond postelection surveys aimed at understanding voter experiences at the polls, little is known about the distribution of wait times among voters. This measurement problem remains an impediment to voting lines research.
With this as background, we turn to a relatively untapped source of electoral information: early voter check-in times from Florida counties in the 2012 and 2016 General Elections. We provide details shortly on check-in times, but for the moment, it suffices to note that a voter’s check-in time is when he or she officially begins the voting process. The check-in times of the almost three million registered voters that form the basis of our research design have two valuable features. One, they are automatically generated by machines installed in voting locations. And two, they are linkable to public records on voter demographics and previous voting history. Footnote 2
These advantages notwithstanding, check-in times by themselves cannot specify the lengths of the lines at the polls in which voters waited before checking in to vote. Rather, our analysis of lines is based on an identifying assumption that late-closing voting locations in Florida were disproportionately affected by voting lines. Our data support this assumption, but like any assumption, it cannot be completely verified. By dint of triangulation, we argue that the study of voting lines, much of which assumes that voters when surveyed can accurately recount how long they waited in line to vote, will be strengthened to the extent that it incorporates varied approaches, each with its own assumptions.
Regarding the time tax associated with waiting to vote, we find a disproportionate concentration of this tax on minority voters. The situation was worse in Florida in 2012 than in 2016; consistent with national, survey-based evidence on voting lines, our check-in times highlight fewer troubling issues in the latter presidential election. Footnote 3 Regarding the effect of waiting to vote in 2012, we find small yet negative consequences for turnout in the 2016 General Election. As a consistency check on this result, we find similar effects of waiting in line in 2012 on turnout in the 2014 Midterm Election. Although the consequences of excessive line waiting on turnout are not negligible, they are nonetheless small, in the vicinity of one to three percentage points, consistent with the findings of Reference PettigrewPettigrew (2017a). We also find that early voters in 2012 who waited in line to vote were less likely to vote early in 2016, ceteris paribus.
In what follows, we situate our study in the literature on voting lines and election administration. We then turn to early voting check-in times in Florida and explain how these times can be interpreted. Our empirical results on lines are divided into two sections: first, we describe the distribution of the voting time tax across our set of Florida voters, and second, we analyze the downstream effects of the tax. We conclude with observations about congestion at the polls and equal treatment of voters.
Voting Lines and Equal Treatment in American Elections
Voting is a fundamental right in the United States. Exercising this right entails costs, as discussed by Reference DownsDowns (1957) in his formulation of the calculus of voting, and an excessively high cost of voting can debase the right to vote. Per the United States Supreme Court in Reynolds v. Sims (1964), “[T]he right of suffrage can be denied by a debasement or dilution of the weight of a citizen’s vote just as effectively as by wholly prohibiting the free exercise of the franchise.” Footnote 4 In assessing the costs of voting that could operate in this way, the court has considered laws relating to redistricting (Shaw v. Reno 1993), literacy tests (Oregon v. Mitchell 1970), proof of citizenship (Arizona v. Inter Tribal Council of Arizona 2012), voter identification (Crawford v. Marion County Election Board 2008), and the purging of registered voters (Husted v. A. Philip Randolph Institute 2018). In various cases, the Court has been asked to balance state interests with the equal treatment of voters. Although there is ample evidence that long voting lines in Florida in the 2012 General Election disproportionately affected racial and ethnic minorities (Reference Herron and SmithHerron and Smith 2014), as of yet, the Supreme Court has not been asked to rule on whether Section 2 of the Voting Rights Act applies to excessively long wait times at the polls, which in principle could constitute “a denial or abridgement of the right of any citizen of the United States to vote on account of race or color” (52 U.S.C. § 10301(a)).
A lack of Court attention notwithstanding, voting lines have received considerable attention in the last several election cycles in the United States. “To me,” Cynthia Perez complained in March 2016 after seeing a line wending its way around an early voting center in Maricopa County, Arizona, with those in line reporting standing in line for more than three hours before checking in to vote, “this is not what democracy is about.” Footnote 5 Ahead of her state’s 2016 presidential primary, election administrators in Maricopa County (population over four million residents per the 2012–2016 American Community Survey) had cut the number of Election Day polling places by roughly 70 percent, increasing the strain on early voting centers. Voters in a handful of states also experienced long lines in the 2016 General Election, but their experiences were largely mild compared with what transpired four years prior in Florida. Footnote 6 In 2011, the Florida legislature curtailed the state’s early voting period, resulting in long lines for many electors who tried to vote in person during the truncated early voting period in the 2012 General Election (Reference Herron and SmithHerron and Smith 2014). Following the election and public anger over waits at the polls, then-President Barack Obama formed a Presidential Commission to address general election administrative issues in the United States. In doing so, he highlighted the plight of 102-year-old Desiline Victor, a Haitian American woman who, on October 27, 2012, waited in line for nearly four hours at Florida’s North Miami Public Library early voting center. Obama’s Presidential Commission devoted some of its January 2014 report to lines, concluding that “[A]s a general rule, no voter should have to wait more than half an hour to have an opportunity to vote”(Reference Bauer, Ginsberg, Britton, Echevarria, Grayson, Lomax, Mayes, McGeehan and ThomasBauer et al. 2014, p. 13). Footnote 7
Voting lines are potential issues wherever voters cast their ballots in person as opposed to voting remotely via mail. The vast majority—over 75 percent in 2016 and approximately 66 percent in 2012—of voters in the United States who cast ballots in presidential elections do so in person, either on an Election Day itself or during a corresponding early voting period whose duration depends on relevant local laws. Footnote 8 As of the writing of this article, there are only three states—Colorado, Oregon, and Washington—in which almost every ballot is cast via mail. Footnote 9
Survey-Based Research on Voting Lines
With few exceptions (e.g., Reference Herron and SmithHerron and Smith 2016; Reference PettigrewPettigrew 2017a; Reference Spencer and MarkovitsSpencer and Markovits 2010), much of what we know about voter wait times is derived from survey research. Most notably, Reference StewartStewart (2013b) and coauthors have conducted internet-based surveys in the United States following the last three general elections. These surveys query voters about their experiences at the polls and include items on wait times. Stewart III’s Survey of the Performance of American Elections (SPAE), which reaches 200 individuals in each state and Washington, D.C., and the Cooperative Congressional Election Study (CCES) both contain questions about voter wait times. According to Stewart III, wait times across the country vary considerably, but a state’s average wait tends to be consistent across elections. Floridians regularly report having to endure some of the longest wait times in the country; in 2012, in-person voters in Florida reported waiting 39 minutes on average prior to voting, three times the national average.
In other survey-based work on voting lines, Reference MukherjeeMukherjee (2009) draws on 2008 CCES data and finds that minority voters were disproportionately likely to pay a time tax when queuing to vote; Reference KimballKimball (2013), using the 2012 SPAE, reports that voters in urban areas faced longer lines than rural voters; Reference PettigrewPettigrew (2017b) estimates that typically nonwhite voting locations in the United States were associated with voter wait times approximately twice as long as those in white locations; and Reference StewartStewart (2013b) finds that, on average, African Americans voting in the 2012 General Election had to wait 23 minutes to vote compared with 12 minutes for whites and 19 for Hispanics. Reference StewartStewart III (2013b) concludes that these differences in wait times could be “due to factors associated with where minority voters live, rather than with minority voters as individuals” (pp. 457–58). Last, Reference Herron, Smith, Serra, Joseph, Sisco, Galdieri and LucasHerron et al. (2017) draw on exit polls conducted across Miami-Dade precincts, finding that those who waited longer in line in the 2014 Midterm Election had less confidence in electoral processes.
The utility of surveys in the study of voter wait times depends on a crucial assumption: voter self-reports of wait times are accurate. In light of literature on memory distortion, this assumption is not trivial. Memory confidence and memory accuracy can be negatively associated (Reference Hirst, Phelps, Buckner, Budson, Cuc, Gabrieli, Johnson, Lyle, Lustig, Mather, Meksin, Mitchell, Ochsner and SchacterHirst et al. 2009). Moreover, how an individual thinks about a given task can be related to the extent to which she thinks about the passage of time (Reference ContiConti 2008), and one’s enjoyment of a task can depend on feelings about time progression (Reference Sackett, Meyvis, Nelson, Converse and SackettSackett et al. 2010). In short, it is not obvious that scholars interested in wait times should be optimistic that voters in the aftermath of an election can accurately report how long they waited before voting. This point notwithstanding, overreporting of turnout is a known problem (Reference Ansolabehere and HershAnsolabehere and Hersh 2012), which can confound surveys on voter experiences.
An Alternative to Voter Line Surveys
In contrast to survey-based research, our design aimed at understanding the extent and consequences of voting lines draws on observed check-in times of voters in Florida who cast their ballots at early, in-person polling sites prior to the 2012 and 2016 General Elections. In 2016, more Florida voters—3.88 million—cast early in-person ballots than voters who mailed in their absentee ballots (2.76 million) or who voted in person at local Election Day precincts (2.96 million; Florida Department of State, Division of Elections 2017). The millions of individuals who cast early, in-person votes in Florida are not unique to this state. Across the United States, early voting is increasingly popular, as described in Reference Neeley and RichardsonNeeley and Richardson (2001), Reference Gronke, Galanes-Rosenbaum and GriffithGronke and Galanes-Rosenbaum (2008), Reference Gronke and ToffeyGronke and Toffey (2008), and Reference Burden, Canon, Mayer and MoynihanBurden et al. (2014).
Florida notwithstanding, there is broader reason to focus on wait times during early in-person voting. Michael McDonald, on his Election Project website, estimates that over 23 million voters cast early in-person ballots in “advance” of the November 8, 2016, General Election, some 17 percent of the 137 million votes cast. Footnote 10 If one were to be concerned that a focus on early voters in Florida limits our scope, these figures imply that our results are relevant for millions of Americans.
In terms of our use of Florida voting data, the state’s open records laws make it an excellent laboratory for the study of election administration. In addition to Reference Herron and SmithHerron and Smith (2015) and Reference Amos, Smith and Ste. ClaireAmos, Smith, and Ste. Claire (2017), who leverage Florida’s statewide voter registration to examine election administration changes on voting behavior, Reference Herron and SmithHerron and Smith (2013) trace the ebb and flow of new voter registrations after the state legislature placed restrictions on groups engaged in voter registration drives and Reference Shino and SmithShino and Smith (2018) demonstrate that individuals who register to vote immediately prior to a registration deadline are more likely to turn out in a proximate general election but not in subsequent elections.
While the state’s records laws facilitate election scholarship, Florida grants considerable privacy to voters. With the exception of those serving as candidate, political party, or ballot issue representatives, state law prohibits precinct observers from tracking voting processes inside polling places. This effectively precludes scholars who want to understand why lines form in front or inside Florida precincts from replicating observational studies of voter activities in the vein of Reference Spencer and MarkovitsSpencer and Markovits’s (2010) study of California and Reference Herron and SmithHerron and Smith’s (2016) research on New Hampshire.
Florida Early Voting Check-In Times
Election administration in Florida—registering voters, determining precinct sizes, staffing and locating polling places, and setting early voting days and hours—is largely controlled at the county level within a framework established by the Florida state legislature. Our early voting check-in times are thus gleaned from public records requests made to Florida counties.
An eligible Florida voter casting his or her ballot prior to Election Day may vote at any early voting polling location in the county in which he or she is registered. This is distinct from in-person, Election Day voting, during which a registered Floridian may vote only at his or her assigned precinct, and it necessitates that a county tracks its early voters. Rather than relying on traditional, paper-based pollbooks to track these individuals, the 67 county Supervisors of Elections in Florida use electronic pollbooks to check-in voters during the state’s early voting period. These pollbooks are for the most part known as Electronic Voter iDentification machines, or EViDs for short. Although there is variance across Florida counties in electronic pollbook implementation, for simplicity, we refer to all electronic pollbooks as EViD machines. Footnote 11
Florida’s EViD system facilitates synchronization across a county’s early voting centers as well as with the Florida statewide voter database. The state’s EViD machines record the check-in times for all early voters, thus providing us with timestamps specifying when a voter began his or her voting process. Using these timestamps, we can, for example, identify early voters who had not checked-in when polls closed at 7:00 p.m. on a given day of early voting but nonetheless cast ballots. Per Florida state law, any elector in line at 7:00 p.m. is allowed to cast a ballot.Footnote 12
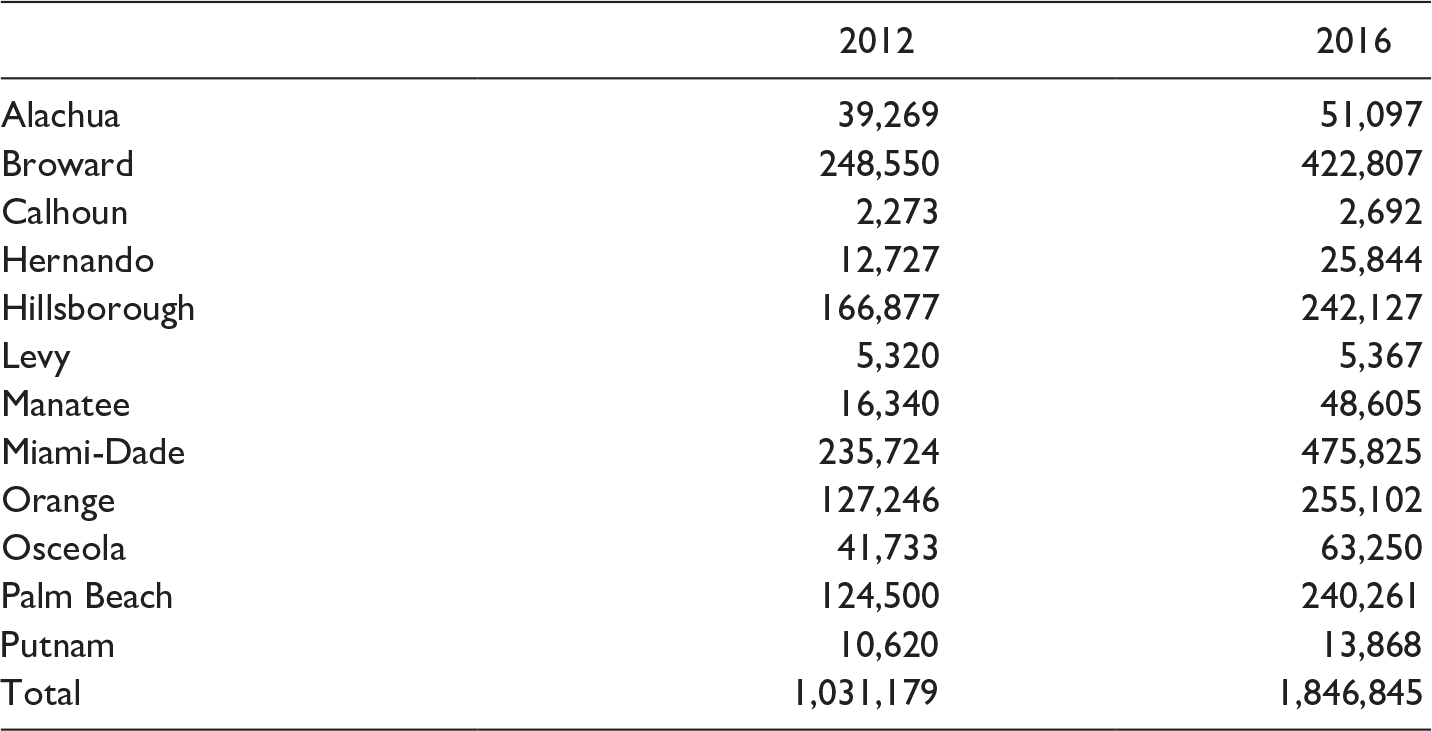
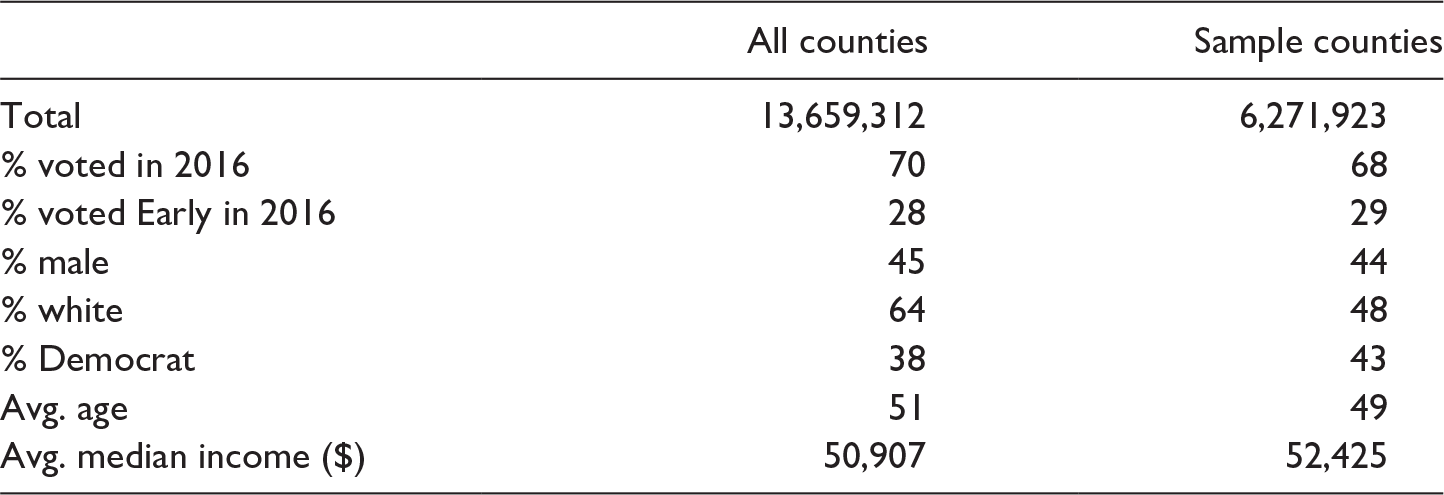
We obtained EViD check-in times from 12 Florida counties: Alachua, Broward, Calhoun, Hernando, Hillsborough, Levy, Miami-Dade, Manatee, Orange, Osceola, Palm Beach, and Putnam. Footnote 13 This group covers large and urban counties (Broward and Miami-Dade) as well as rural (Levy and Putnam) counties. The 12 counties combined contain approximately 46 percent of all registered voters in Florida and are representative of the state in terms of turnout rate, gender, and age within a two percentage point difference. However, the counties are slightly biased toward metropolitan areas, which tend to be less white and less Republican while earning a slightly higher salary (see Table A2 in the appendix).
Table 1 contains counts of early voting EViD timestamps per county. In the 2012 General Election, there were 2,409,097 total early ballots cast in Florida, and in 2016, 3,876,753 early ballots. Footnote 14 Our EViD data cover approximately 43 (48) percent of all early in-person ballots cast in Florida in the 2012 (2016) General Election. Footnote 15 EViD timestamps are associated with official Florida voter identification numbers, and we merge our timestamps with statewide voter files that cover the 2012 and 2016 General Elections. Footnote 16
EViD Check-Ins by County, 2012 and 2016 General Elections.

In 2012, all 67 Florida counties offered between six and 12 daily hours of early voting over an eight-day period (Saturday through Saturday) that ended immediately prior to the General Election, November 6, 2012. In 2016, after long lines in 2012 had apparently convinced the state legislature to grant counties more flexibility in offering early voting opportunities, counties were permitted to offer up to 12 hours of early voting per day, spread over 14 days, ending the final Sunday before the November 8, 2016, General Election. Counties were permitted to offer a maximum of 168 total hours of early voting. Footnote 17
Figure 1 displays the distribution of EViD check-in times at the Fred B. Karl County Center in Hillsborough County and the West Kendall Regional Library in Miami-Dade County on the last Saturday (November 3) of the 2012 General Election early voting period. The figure describes in 10-minute blocks the number of voters who checked into these two polling stations. Counts begin with the first voter who checked-in just as polls opened at 7:00 a.m., and they end with the last voter who checked-in. .
Early voting check-in times on Saturday, November 3, 2012, in two locations: (a) Fred B. Karl County Center, Hillsborough County; (b) West Kendall Regional Library, Miami-Dade County.

Both panels in Figure 1 contain vertical black lines at 7:00 p.m. This is the time beyond which voters were not allowed to join a (possibly existing) voting line. In the Hillsborough County location (Figure 1a), no check-ins occurred after 7:00 p.m., and from this, it follows that, at 7:00 p.m., there was no voting line. In contrast, the Miami-Dade location (Figure 1b) had many post-7:00 p.m. check-ins, the last one of which occurred around 1:00 a.m. on Sunday, November 4. We thus know that the last-voting voter at West Kendall Regional Library waited almost six hours to vote.
Figure 1’s bar shading reflects self-reported voter race/ethnicity. Early voters at the Fred B. Karl County Center were primarily white, although toward the end of November 3, the fraction of nonwhite voters trended up. At the West Kendall Regional Library, the vast majority of the early voting pool was nonwhite, the fraction of nonwhite voters being roughly consistent across November 3.
Last, we observe a flatter, more-uniform distribution of check-in times at Karl County Center than in West Kendall Library. We draw on this pattern later when we try to determine which early voters in our 12 counties waited in line, and here we provide some intuition. As illustrated in Figure 1, it appears that early voting locations in Florida that shut down very late had flatter distributions of check-in times. We suspect that this is evidence of persistent lines. In contrast, the nonuniformity of check-in times that we observe in Figure 1a is consistent with an ebb and flow of voters. We know that there was not a line to vote at Karl County Center at 7:00 p.m. on Saturday, November 3, despite the fact that, per check-in times, the Center was regularly processing voters.
Results
We present results in two sections. First, we describe patterns in check-in times across the 2012 and 2016 General Elections with particular attention to race/ethnicity and partisanship. Second, we consider the downstream consequences of extensive early voting wait times.
Who Waits?
Our analysis of who waits to vote turns in large part on check-in times that occurred after 7:00 p.m. on a day of early voting. Any voter with such a late check-in must have waited to vote.
Early voting in 2012
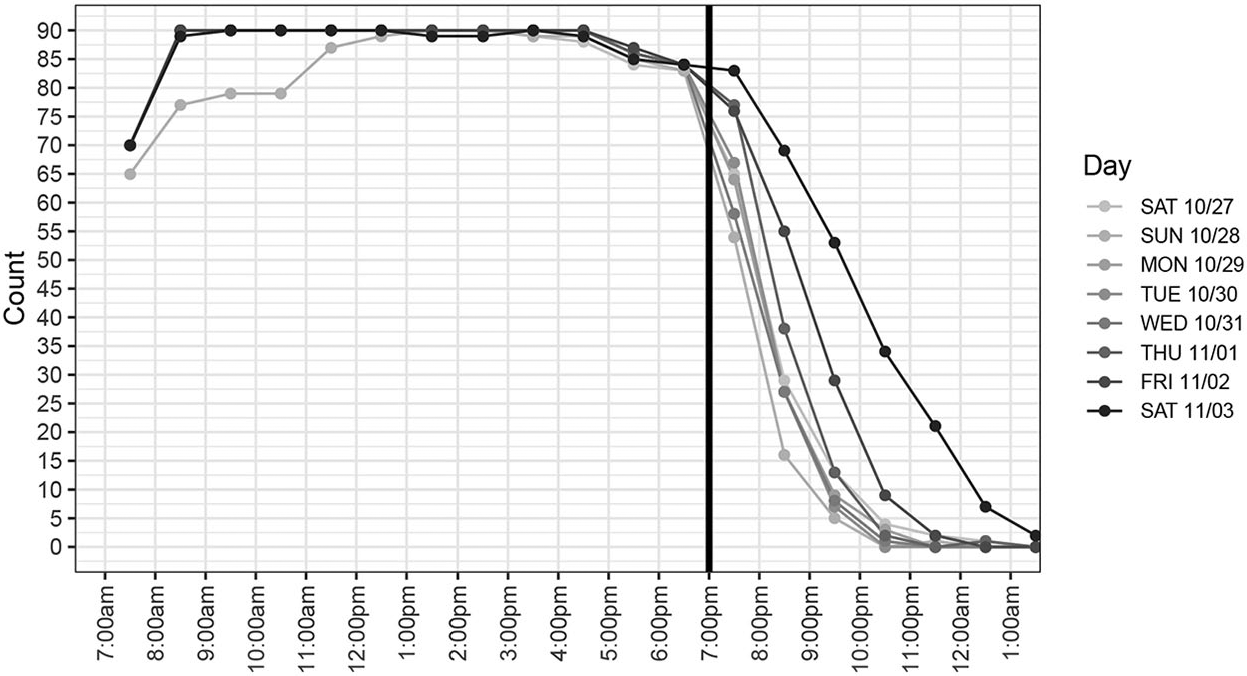
In 2012, there were, across our 12 Florida counties, 90 early voting stations in 2012 that serviced voters in an eight-day-long, early voting period. Footnote 18 Figure 2 describes by day of early voting and by hourly window the number of locations across our counties that actively served voters. Most locations served early voters virtually the entire day, and this is evident in the flat line, for the most part pegged at 90 prior to 7:00 p.m., at the top of the figure. The most notable exception to this pattern occurred at the earliest time of the day, during which several early voting stations lacked active voters.
Number of locations where early votes were cast, 2012 General Election.

After 7:00 p.m. (note the vertical black line at this time), Figure 2 shows that check-in uniformity across early voting stations quickly changed. On initial days within Florida’s eight-day-long early voting period in 2012, there was a steep drop in active stations starting at this time. Even with this drop, however, there were still at least five open locations at 9:00 p.m. on every day of early voting. Then, on the last two days of early voting, November 2 and 3, many early voting stations remained open well beyond 7:00 p.m. On the final Saturday of early voting, over 50 stations were still open at 9:00 p.m., and a few processed voters through midnight.
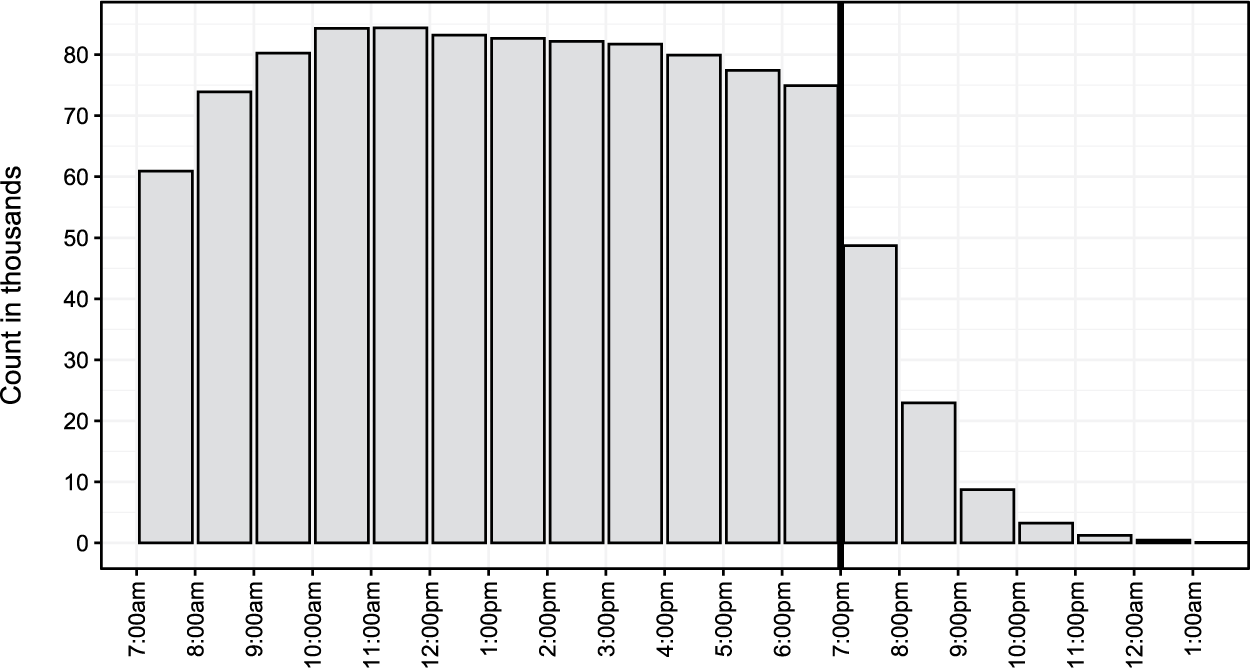
Figure 3 displays the total number of voters who voted early by the hour of the day at which they checked-in. Prior to 7:00 p.m., EViD check-ins were distributed fairly uniformly across the day with a small peak before noon. From 7:00 a.m. to 7:00 p.m., our 12 counties consistently served around 70,000 Florida early voters per hour. After 7:00 p.m., at which point new voters could not join existing voting queues, the number of voters served per hour dropped drastically—but not entirely. A total of 84,446 early voters in 2012 across our 12 counties cast ballots after 7:00 p.m. These are individuals who were in line at the time the polls closed and were allowed to continue to wait to vote. We know that all of these voters had to wait in this way although we do not know precisely how long each individual waited. Of this group, 36,230 voted after 8:00 p.m. These voters waited at least one hour to vote, and 13,568 voters who checked-in after 9:00 p.m. waited at least two hours to vote.
Distribution of check-in times among early voters by hour, 2012 General Election.

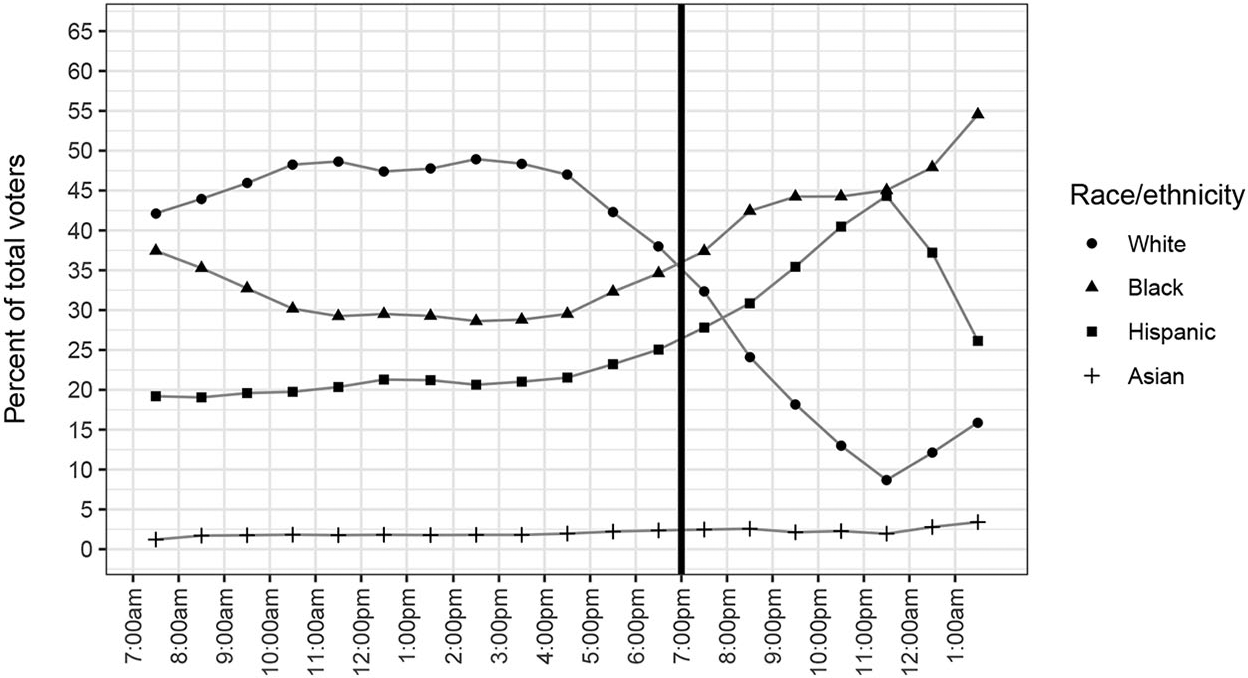
Aggregating across locations, Figure 4 describes the composition of the 2012 early voting pool by race/ethnicity and hour of check-in. For most of the day, whites were the majority racial group, followed by blacks, Hispanics, and Asians. This ranking reflects Florida’s registered voter pool. Among the 12,580,602 registered voters in the December 2012 Florida voter file, approximately 66.4 percent are white, 13.9 percent Hispanic, 13.6 percent black, and 1.63 percent Asian. As in years prior, blacks in Florida in 2012 were disproportionate users of the state’s early voting period (Reference Herron and SmithHerron and Smith 2012). What is striking in Figure 4, however, is the racial/ethnic composition of the early voting pool immediately before and then after 7:00 p.m. Simply put, the pool becomes rapidly nonwhite starting around 7:00 p.m. By the 8:00 p.m. to 9:00 p.m. window, the pool is less than 25 percent white.
Racial/ethnic composition of early voters by hour, 2012 General Election.

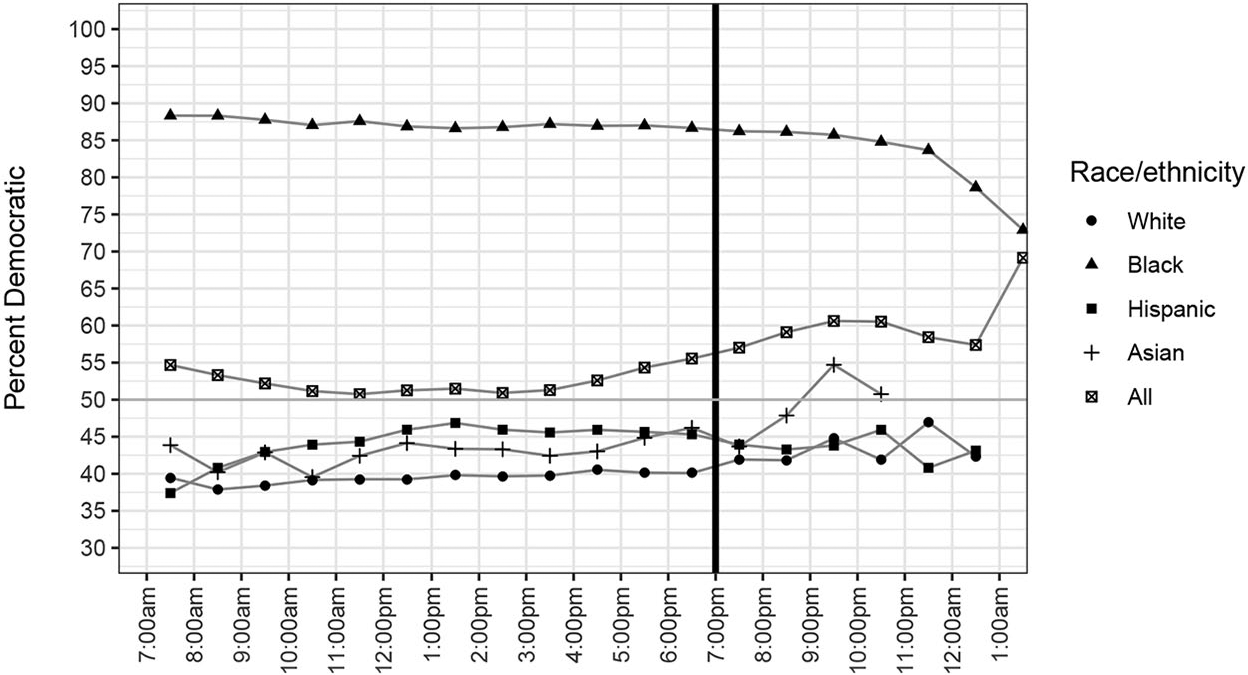
The party registration of the early voting pool varies slightly with time although not as starkly as its racial/ethnic composition. This is illustrated in Figure 5, which describes by hour the partisan breakdown of early voters in our 12 counties as well as the party breakdown of the four aforementioned racial/ethnic groups. While Democrats constituted approximately 53 percent of all those who voted early in our 12 counties, we see from the black line in the figure that this percentage varied by hour of the day. Notably, Democrats composed a greater share of the voters in both the early hours of voting and the hours after 7:00 p.m.
Partisan composition of early voters by hour and by race/ethnicity, 2012 General Election.

Figure 5 describes the breakdown of party registration by race/ethnicity, which reflects the aforementioned racial/ethnic patterns of voting. For example, black early voters in Florida were almost entirely Democratic, regardless of when they checked-in to vote. Similarly, the party registration of Hispanic voters—the least Democratic group in our 12 counties—remained relatively constant throughout the day. However, there is a slight trend for white and Asian early voters, who became increasingly likely to be registered Democratic as time progressed.
Early voting in 2016
By the time the 2016 General Election had occurred, Florida had increased its number of early voting days from eight to 14, ostensibly in an effort to reduce voting location congestion. Was this change effective? Figure 6 is analogous to the earlier figure that described active early voting locations. Our 12 counties had 118 early voting stations in place for the 2016 General Election.
Number of locations where early votes were cast, 2016 General Election.

The most important aspect of Figure 6 is the pictured drop-off in voter check-ins that occurred after 7:00 p.m. There were indeed check-ins that took place after this time but not nearly as many as in 2012. On the busiest day in 2012, more than half of the polling locations were open past 9:00 p.m. and more than five were open past midnight. On the busiest day in 2016, only six locations were open past 9:00 p.m. and no early voter cast a ballot after 10:00 p.m.
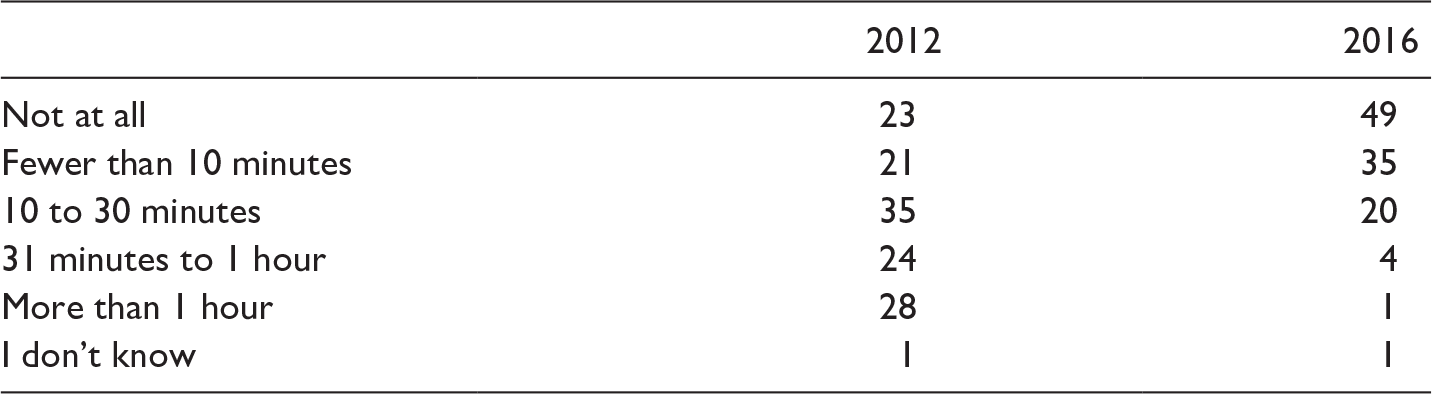
In the introduction, we commented on improvements in voter wait times that survey-based research designs have found in 2016 compared with 2012; indeed, and Figure 6 is consistent with findings in the 2012 (Reference StewartStewart 2013a) and 2016 (Reference StewartStewart 2017) editions of the SPAE. See Table 2. Early voting in 2016—at least in our 12 Florida counties of interest—represents an improvement over 2012 in terms of reducing voting station congestion, which is presumably tied not only to the expanded number of sites but also to the number of days and hours of allowable early voting. Footnote 19
Wait Times of Florida Respondents in the SPAE, 2012 and 2016 General Elections, Broken Down by Percentages.

Note. Ignores individuals with missing responses to the SPAE wait time question, “Approximately, how long did you have to wait in line to vote?” SPAE = Survey of the Performance of American Elections.
Late voting in 2012 versus 2016
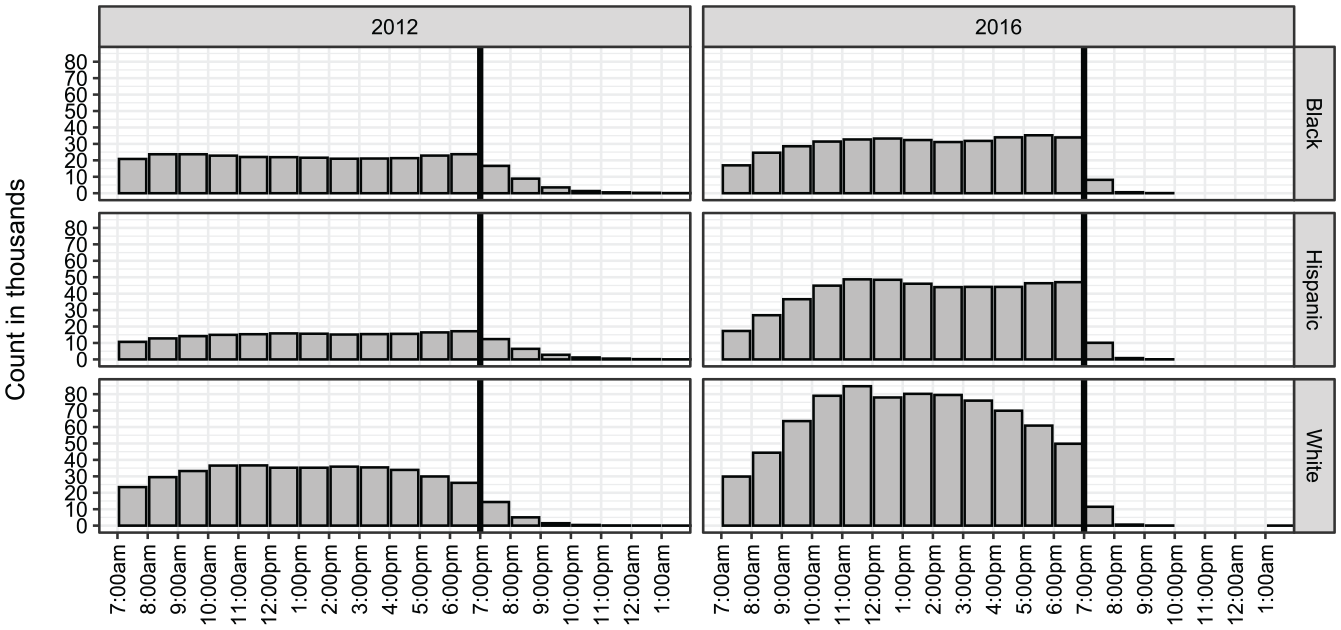
Figure 7 provides a race/ethnicity-based perspective on the 2012 versus 2016 comparison for our 12 counties. For three key racial/ethnic groups in Florida—black, Hispanic, and white—the figure shows the total number of check-ins by time, aggregated across all days in the 2012 and 2016 early voting periods. Not only did more voters check-in for early voting in 2016 compared with 2012, fewer voters voted past 7:00 p.m. This is the case for black, Hispanic, and white voters. We already have seen that nonwhite early voters in Florida had disproportionately late check-ins in 2012, but Figure 7 shows how this problem did not appear in 2016. There were slightly more nonwhites with late check-ins in this latter year, but the magnitude of the white versus nonwhite gap shrunk in 2016 compared with 2012.
Distribution of voter check-ins, 2012 General Election versus 2016 General Election, by time and race/ethnicity.

Even though 2016 attracted far more early voters than 2012, the changes made to the early voting period appear to have reduced the congestion outside of the polls. The increased number of days and hours may have helped, as our 12 counties still served roughly the same number of early voters per day in 2016 (approximately 131,918) as they did in 2012 (approximately 128,897). It is an open question in the literature on election administration as to the marginal effect of additional days versus hours per day on early voting usage (e.g., Reference Walker, Herron and SmithWalker, Herron, and Smith 2018).
Effects of Waiting to Vote
We now consider the downstream effects on future electoral political participation of waiting in line to vote. We focus first on the consequences of waiting in an early voting line in the 2012 General Election on turnout in the 2016 General Election. We then assess how waiting in line in 2012 affected early voting. Last, we consider how waiting in 2012 was associated with turnout in 2014, the year of a midterm election.
Effects of 2012 lines on 2016 turnout
The challenges associated with assessing the effects of waiting to vote in 2012 are twofold. First, while we know voter check-in times from our EViD data, the same cannot be said of voter arrival times, which are not collected by election officials or anyone else for that matter. Indeed, were voter arrival times systematically tracked by election administrators across the United States, there would be no need for the research design employed here, much less national surveys asking about wait times. Second, early voters who voted at, say, 9:00 a.m. on a given day of early voting may be systematically different from those who voted at 6:00 p.m. Consequently, estimating the effect of voting after closing time—when we know voters must have waited in line—is potentially confounded by voter-level selection. Hence, we need to ensure that we control for differences across early voters as best as we can so that selection into time of early voting does not confound our estimates of the effect of waiting in 2012 on future turnout.
Our approach is as follows. We condition on county, race/ethnicity, party registration, gender, age, neighborhood income, and previous voting history, all of which are voter-level characteristics that we know because EViD timestamps can be linked to Florida voter files. And, we make the following assumption: individuals who voted at Florida early voting locations which stayed open well past the 7:00 p.m. cutoff time are more likely to have waited in line than those who voted in locations that closed before 7:00 p.m. or at this time exactly. Moreover, we assume that those who voted just before the 7:00 p.m. cutoff in early voting locations that stayed open late are more likely to have waited in line than those who voted earlier in the day. We cannot know for sure if these assumptions hold, but there are reasons to believe that they do.
Take, for example, the two polling locations in Figure 2. The first location—the Karl County Center in Hillsborough County—closed on time on November 3, 2012. Therefore, we assume that the Karl Center was not a congested polling location and that the voters who voted just before 7:00 p.m. did not have to wait in much of a line. If they did have to wait in line to vote, then the line remarkably stopped just in time for the final early voter to check-in right before 7:00 p.m. While this is technically possible, it would be remarkably coincidental.
On the contrary, the second location in Figure 2—the West Kendall Library in Miami-Dade County—remained open until around 1:00 a.m. on November 3. We know with certainty that the last voter at the library waited before voting. In fact, because all voters had to arrive before 7:00 p.m. to check-in, we know with certainty that this individual waited at least six hours to vote. Moreover, we can be fairly confident that the voters who voted just before 7:00 p.m. at the West Kendall Library also waited in line. Voting past 7:00 p.m. is indicative of a polling place operating essentially at capacity at this time, and individuals who voted just before 7:00 p.m. are likely to have been caught up in a long line.
We create a variable, called Over, that identifies all early voters who voted at a polling location on a day where the last voter checked-in past 7:30 p.m. We use this latter cutoff as opposed to 7:00 p.m. so that our results are conservative. Voters who cast ballots after 7:30 p.m. did so at locations where we know that the voting line at the end of the day was at least 30 minutes long. Then, we use a logistic regression to estimate the effect of voting at a polling location that was congested in 2012—one that went “over” 7:30 p.m.—on the probability of voting in 2016:
 $$ \mathbf{Pr}\left(\text{Voted}16_{i} = yes\right) = \text{logit}^{-1}
\left(\begin{array}{@{}l@{}}\beta + \eta_{Country} + \alpha_{Over} +\gamma_{Hour} + \sigma_{Over\times Hour} + \upsilon_{Gender}+\\
\rho_{Race/ethnicity} + \tau_{AgeGroup} + \psi_{Party} + \theta_{Income} + \pi_{Voted\,08}
\end{array}\right). $$
In the above model, i denotes our collection of 2012 early voters who appear in the history of Florida voting in 2008; County indicates a voter’s county; Over indicates if the voter had to wait in line in 2012; Hour indicates the hour of the day in 2012 at which a voter checked-in, between 7:00 a.m. and 7:00 p.m.; Gender indicates whether the voter identifies as male or female; Race/Ethnicity indicates if the voter self-identifies as white, black, Hispanic, or Asian; Age Group classifies voters according to their 2016 age and bins them into 10-year age groups (20–29, 30–39, 40–49, 50–59, 60–69, and 70+); Party indicates party registration, Democratic, Republican, No party affiliation, or none of the above; Income indicates log median household income in a voter’s zip code; Footnote 20 and Voted08 and Voted16 are indicators for participation in the 2008 and 2016 General Elections.
The covariates in our regression are based on findings in the extensive literature on turnout in American elections. This literature considers how age (Reference Highton and WolfingerHighton and Wolfinger 2001; Reference Strate, Parrish, Elder and FordStrate et al. 1989), gender (Reference Schlozman, Burns, Verba and DonahueSchlozman et al. 1995), party (Reference Grofman, Owen and ColletGrofman, Owen, and Collet 1999; Reference Martinez and GillMartinez and Gill 2005), and race (Reference FragaFraga 2016; Reference Verba, Schlozman, Brady and NieVerba et al. 1993) are associated with individual-level turnout decisions. We estimate our logistic regression using 826,145 individuals. Footnote 21
Before turning to results, we consider whether our indicator variable (Over) for the presence of lines in voting locations is consistent with aggregate features of our check-in data. If, using the 7:30 p.m. rule as noted above, the voting locations we identify as having been affected by lines truly were busier than the locations where we believe lines were not an issue, then we should observe greater numbers of check-ins in the former compared with the latter. On this point, see Figure 8. This figure displays hourly total check-ins per location, disaggregated by Over. What we see in the figure is that, in every hour of the day, locations we believe had voting lines were on average busier than locations where we do not believe lines were prevalent.
Average check-ins per hour across congested and noncongested voting locations.

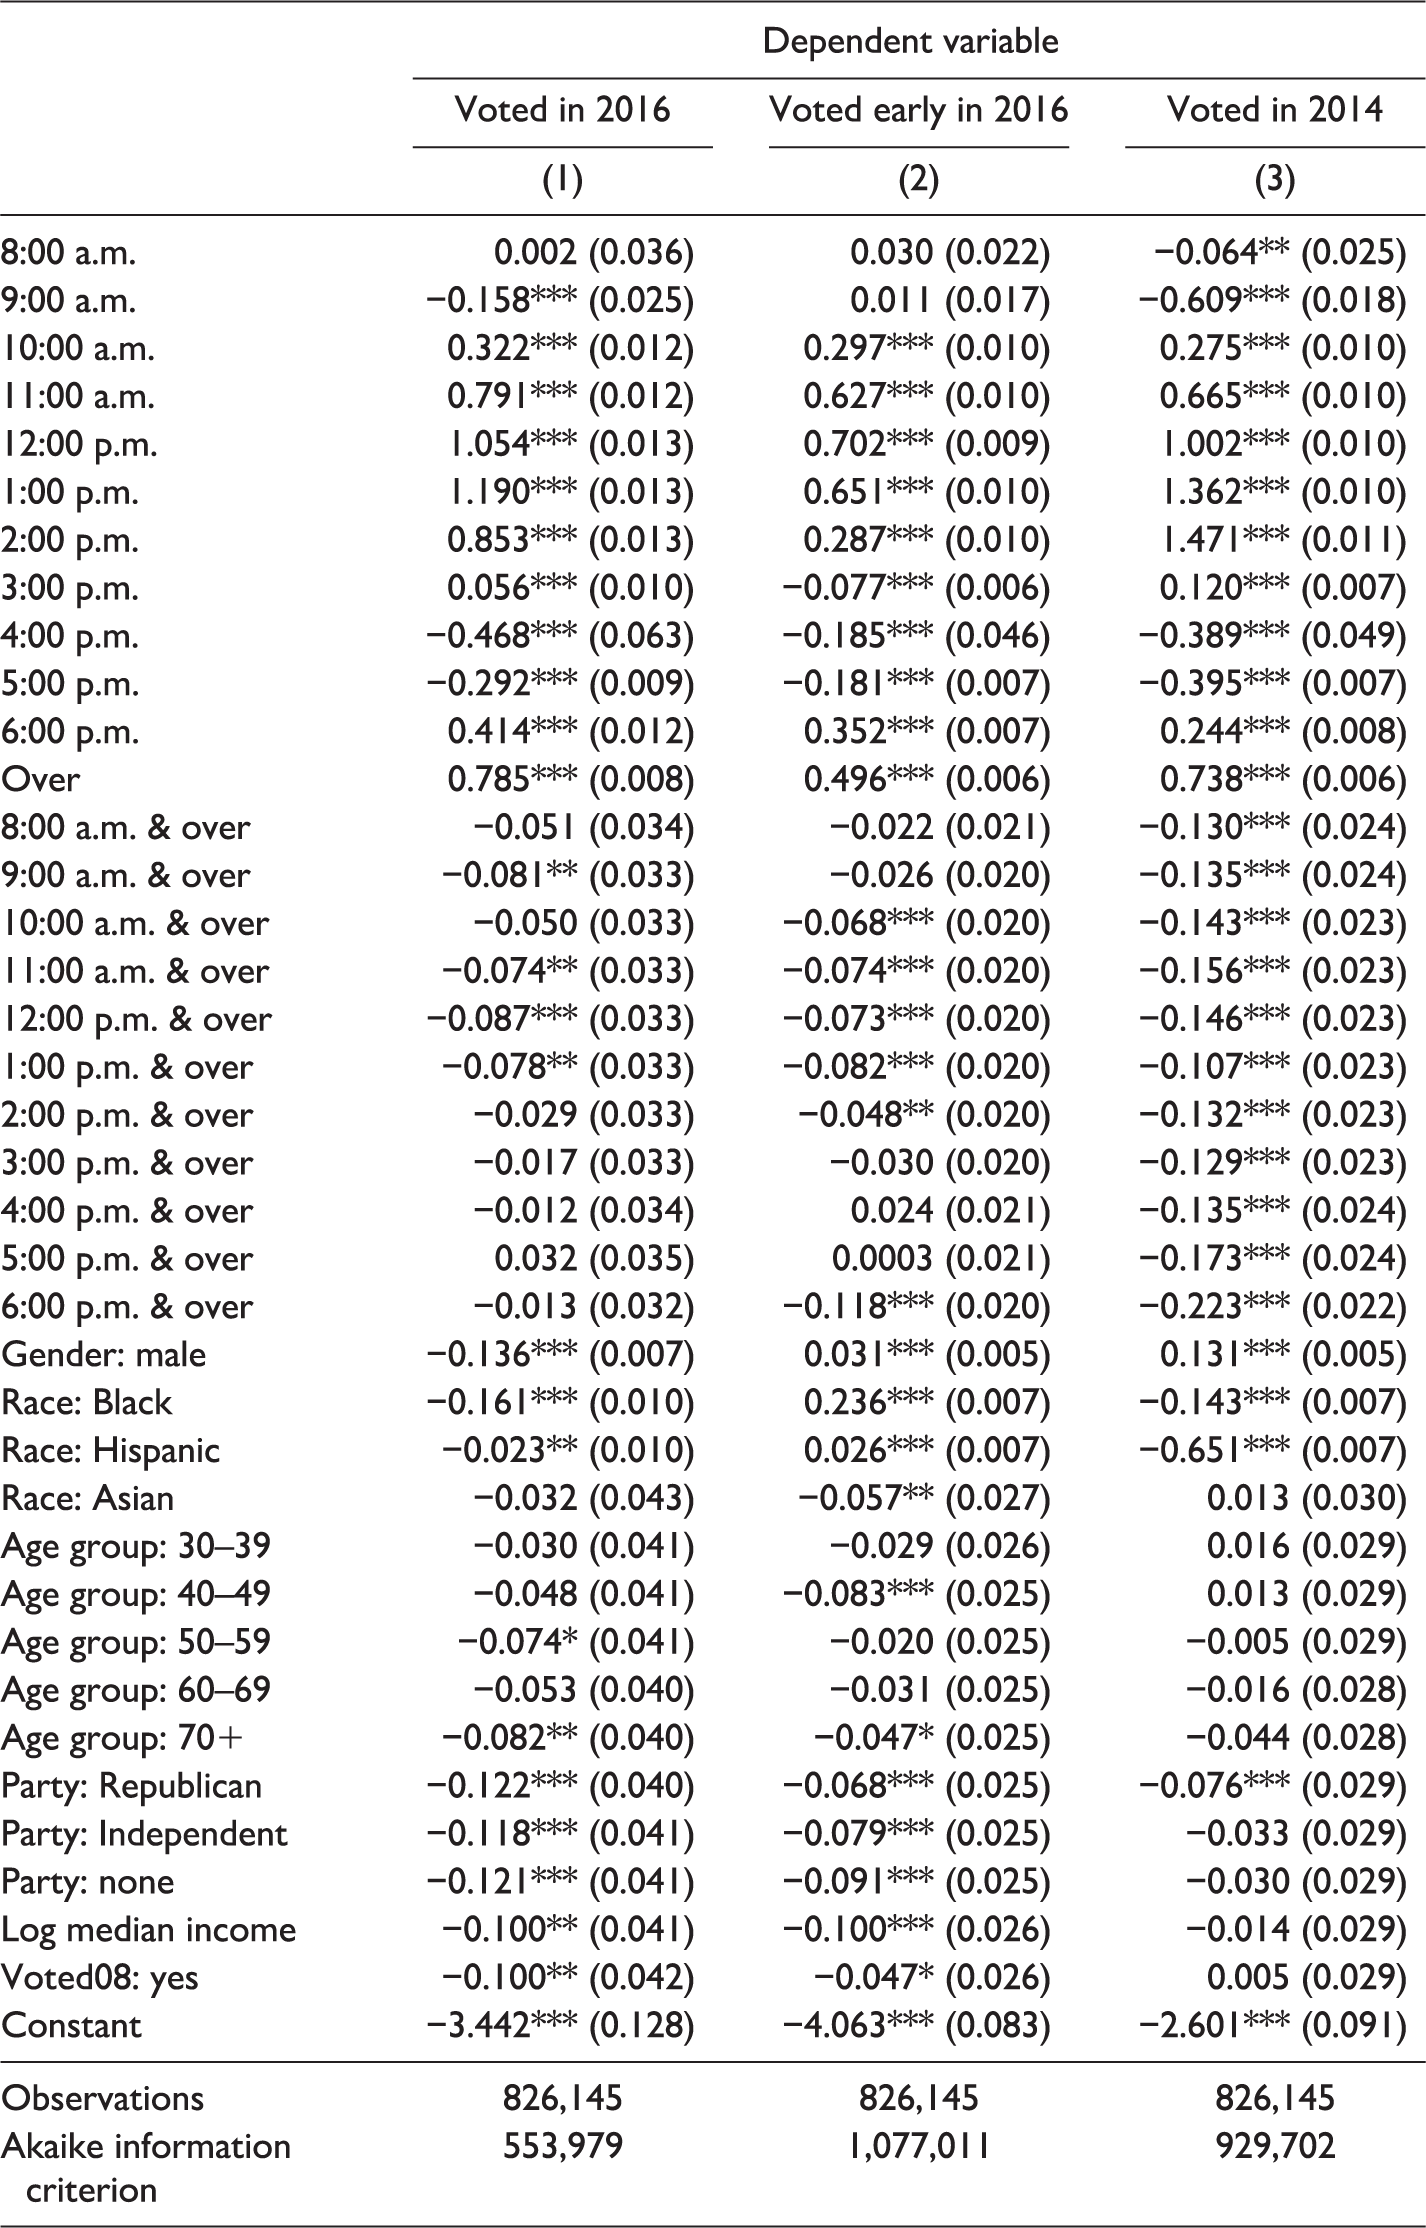
Regression coefficient estimates appear in Table A1 in the appendix. Per the leftmost column (1) of the table, having voted in 2008 in Florida is positively associated with subsequent voting in 2016, and being older is associated with greater turnout, ceteris paribus. The latter result is consistent with findings on turnout and age (Reference Costa, Schaffner and PrevostCosta, Schaffner, and Prevost 2018). Our age estimates in Table A1 are presumably underestimated; the model that generates them excludes the youngest voters in 2016, who could not legally register to vote in Florida in 2008, and younger registered voters are, ceteris paribus, less likely to turn out to vote (Reference Shino and SmithShino and Smith 2018). Table A1 also shows that, ceteris paribus, registered men vote less frequently than women and that registered whites vote often than nonwhites. This gender finding is consistent with Reference Leighley and NaglerLeighley and Nagler (2014) although the race/ethnicity result is not.
Our objective is not to explore the relationship between demographic covariates and voter turnout in Florida in 2016. Rather, we want to know the marginal effect of waiting in line on future turnout. To this end, Figure 9 displays graphically the probability of voting in 2016 of a black male between the ages of 50 and 60 years who is a registered Democrat, voted in 2008, and lives in a Hillsborough County zip code with the average median household income.
Probability of voting in 2016, given 2012 check-in time.

Figure 9 estimates are conditioned on each hour of the early voting day in 2012. Its black points represent estimated probabilities of voting in 2016 conditional on voting at a polling location that closed before 7:30 p.m.; based on our discussion above, these estimates reflect individuals who likely did not wait in line. In contrast, the gray points in Figure 9 are the estimated probabilities of voting in 2016 conditional on casting an early ballot at a polling location that closed after 7:30 p.m. These estimates reflect individuals who likely did wait in line to vote. The differences between the figure’s two sets of estimates reflect the effect of waiting in line, and we expect them to be most isolated as one compares voters casting ballots closer to 7:00 p.m.
Beginning at around 2:00 p.m., there is a small albeit negative difference between individuals who voted in congested polling places compared with those who cast their ballots in noncongested places. This suggests that voting lines may have started in the early afternoon; the reason there is no difference between congested and noncongested polling places earlier in the day may be because long lines had yet to form then. As congested polling places become congested, we observe a small but statistically significant effect on future political participation, suggesting that voting lines slightly dampen future electoral participation. The effect is small, amounting to no more than roughly a percentage point difference.
Voting probability plots for other demographic groups are similar to that in Figure 9, and rather than displaying many such plots, we generalize to our complete sample the marginal effect of waiting in line in 2012 on voting in 2016. Across the sample, Figure 10 displays estimates, with 95 percent confidence intervals, of the change in probability of voting in 2016 based on time of early vote in 2012. We generated the results in the Figure 10 with a simulation. Our simulation (500 repetitions) drew from a multivariate normal distribution where the mean vector consists of values of the coefficient vector corresponding to the leftmost column (1) in Table A1. The covariance matrix for the multivariate normal is the estimated covariance matrix from our logistic regression. The numbers in Figure 10 can be thought of as average treatment effects where the treatment on individuals is being forced to wait in a voting line in 2012.
The effect of waiting in line to vote in 2012 on voting in 2016.

The point estimates in Figure 10 are all negative, indicating that waiting in line in 2012 is associated with decreased turnout probabilities in 2016. The magnitudes of the estimated probability differences range from almost zero (for a voter who waited at 7:00 a.m.) to slightly over one percentage point (later in the day).
Overall, our findings on the effects of lines—they depress future turnout, albeit barely—are similar to the conclusions in Reference PettigrewPettigrew (2017a) wherein each hour an in-person voter spends waiting in line to vote is associated with a one percentage point drop in the likelihood of future turnout. To the best of our knowledge, Pettigrew is the first scholar to try to estimate the effect of waiting in line to vote on a later propensity to vote, and our results are qualitatively similar to his.
Our regression results are based on individuals who were registered to vote in Florida in 2008, 2012, and 2016. Thus, our results exclude the youngest registrants in Florida, who were not legally permitted to be registered in Florida as of the 2008 General Election; individuals who moved to Florida from out of state between the years of 2008 and 2016; registered Floridians who died, were convicted of committing a felony, or adjudicated mentally incompetent between 2008 and 2016; and individuals who moved out of the state between 2008 and 2016.
In light of these issues, one might be concerned that, by selecting against younger voters, we are biasing our estimates of waiting in line in 2012 on turnout in 2016. To this end, studies of the willingness of individuals to leave emergency rooms without being seen by medical professionals find that being young is a risk factor for this behavior (Reference Clarey and CookeClarey and Cooke 2011; Reference Shaikh, Jerrard, Witting, Winters and BrodeurShaikh et al. 2012; Reference Sun, Bilstadt, Pelletier and CamargoSun et al. 2007). In other words, young individuals seem unduly sensitive to wait times. If this is true, by excluding relatively younger voters in our regression model, our estimates on the effect of waiting on future election turnout are conservative.
Our regression analysis also selects against recent movers into or out of Florida and individuals who became felons, and thus lost the right to vote, between 2008 and 2016. We do not know of any theoretical reasons to think that these types of individuals are systematically different in terms of sensitivity to voting lines. However, conditioning our results on individuals who remained registered to vote in Florida across a span of eight years presumably means that we are conditioning our analysis on politically engaged individuals. This will again make our results on the effect of voting lines on future turnout conservative.
Effects of 2012 lines on 2016 early voting
Now restricting attention to 2016 voters only, we consider a logistic regression that analyzes whether these individuals voted early in 2016—or, in contrast, voted in another fashion. Results are in column (2) of Table A1, and Figure 11 contains a plot of 2016 early voting probabilities structured similarly as our earlier turnout probability plot.
The effect of waiting in line to vote in 2012 on voting early in 2016.

Intuitively, and to the extent that time spent in line increases the cost of voting, we would expect that waiting in an early voting line in 2012 is associated with a decreased likelihood of voting early in 2016. Indeed, Figure 11 shows that the 2016 voters whom we identify as having waited in an early voting line in 2012 were less like to vote early in 2016, ceteris paribus. This result shows how some voters responded to high costs of early voting by choosing an alternative way to vote in a later election, and this highlights a downstream consequence of voting lines. Still, Figure 11’s percentage point gaps (black dot to gray dot) are around two to three points, which is small albeit not negligible. Early voting was designed as a convenience, and Figure 11 suggests that the value of this convenience can be lost in the shadow of a previous bad experience.
A full analysis of the determinants of what leads individuals to cast votes early is beyond our scope. However, what is most important about Figure 11 is that it highlights how voting experiences can affect forms of future political participation. Wanting to voting early, but not doing so on account of fear of lines, imposes a cost on voters, and future research on election administration needs to pay attention to the way that electoral experiences, both positive and negative, can accumulate over time and potentially affect future choices.
Effects of 2012 lines on 2014 turnout
Our final set of results on the effects of lines considers turnout in the 2014 General Election as a function of line waiting in 2012. Our focus here on 2014 reflects the possibility that the effect of waiting in line may diminish in time, perhaps as memories of lines become less salient. If this is true, we would expect greater consequences of waiting in line in 2012 on 2014 turnout compared with 2016 turnout.
Nonetheless, one drawback of analyzing 2014 turnout based on 2012 voting experiences is the fact that the 2014 statewide election in Florida was a midterm election as opposed to a presidential election. As midterms are generally less attractive to voters as the stakes are ostensibly lower in the former, a negative voting experience in 2012 might be sufficient to discourage a voter from turning out to vote in 2014 when such an experience might not have been enough to discourage that same voter from voting in the presidential election in 2016. Hence, having to wait in line to vote in 2012 may cause a more profound reduction in turnout in 2014 compared with 2016. On the contrary, midterm electorates may be more energized and politically engaged than presidential electorates, the latter of which attract all sorts of voters on account of the perceived high stakes. As a result, a negative experience waiting in line in 2012 might not be enough to deter an already motivated midterm voter. If this is the case, we might expect to see smaller effects of 2012 lines on 2014 turnout compared with 2016 turnout.
Figure 12 presents estimates of the effect of having waited in line to vote in 2012 on the probability of turning out to vote in the 2014 midterm election. What is most noticeable about this figure is that the downstream effect of having waited in line in 2012 appears much stronger in 2014 than in 2016. Individuals who voted in congested polling locations in 2012 were between 2.5 and 4.5 percentage points less likely to vote in 2014 compared with those who voted in polling locations that were not so congested in 2012. In 2016, those same individuals were between zero and 1.25 percentage points less likely to vote. This suggests that negative voting experiences in 2012 were more profound in altering midterm turnout than they were in altering turnout in a subsequent presidential election.
The effect of waiting in line to vote in 2012 on turnout in 2014.

In the analyses that we have described, the effects of waiting to vote on 2014 turnout and on 2016 turnout are conditional on the hour in which a voter voted in 2012. We have found that early voters who cast their ballots in the afternoon in 2012 were more affected by congested polling locations than voters who cast their ballots before noon. Although a so-called afternoon effect is more pronounced in 2016, we observe as well that, in 2014, the magnitude of the effect of line waiting on turnout increases between noon and 3:00 p.m. and then gradually returns to before-noon levels for voters who voted just before the 7:00 p.m. cutoff. Although it is unclear why the effect of lines is strongest regarding 2014 turnout just before 3:00 p.m., we note that there is a slight conditional effect of time from 2012 and that this effect is outweighed by a much stronger effect of having voted in a congested precinct.
Conclusion
Lengthy voting lines in the United States have been of concern to scholars, election officials, policy makers, and voters. Burdensome wait times not only impose opportunity costs on those forced to wait in line but can also discourage future electoral participation. Research on voting lines has historically been challenged by the lack of data on who waits to vote. Other than noting the times at which polls officially closed and recording information about which voters cast their ballots after voting lines were capped, there is little data collected by election officials that might distinguish those who waited in line to vote from those who did not (not to mention individuals who waited in a voting line but departed without casting a ballot). Notwithstanding a limited number of exceptions, local election officials do not maintain official records on line evolution or how long individual voters waited (Reference Herron, Smith, Serra, Joseph, Sisco, Galdieri and LucasHerron et al. 2017).
Scholars’ interest in lines has traditionally relied on surveys that ask respondents to recall their experiences at the polls and report the length of time that they waited prior to voting. Survey-based analyses have illuminated important variation in wait times across geographies and racial/ethnic groups, but associated with them is the caveat that survey responses are subject to biases associated with self-reporting. Although we do not believe that scholars should eschew voter self-reports of time spent in lines, we nonetheless argue that research depending on voter self-reports of time-based experiences should be cognizant of findings in the literature on memory distortion.
Our contribution to the literature on voting lines analyzes early voter check-in times in Florida’s 2012 and 2016 General Elections. Using electronic voting check-in time stamps from Alachua, Broward, Calhoun, Hernando, Hillsborough, Levy, Manatee, Miami-Dade, Orange, Osceola, Palm Beach, and Putnam counties, we identify the day and time at which over two million voters checked-in to vote. Voter check-in times are not a panacea in the quest to understand voting lines and their consequences, and this is because these times do not specify when voters arrived to cast their ballots. Using check-ins in a line study such as ours thus requires assumptions, and our key assumption is that late-closing (after 7:30 p.m.) early voting precincts in Florida in 2012 were different and in particular were more congested than, non-late-closing precincts. Our check-in times are roughly consistent with this assumption. Still, until voter arrival times are tracked as systematically as check-in times, studies of voting lines will be forced to confront the data limitations that bedevil the research described here.
Our analysis reveals that Florida’s early voting period in 2012 had a significant number of voters who voted past the official 7:00 p.m. closing time and, therefore, must have waited in line to vote. These voters were disproportionately black, Hispanic, and Democratic—a finding that coincides with survey results on voting lines. In 2016, we find that congestion observed in 2012 had all but vanished. Voters rarely voted late into the night in 2016, and most early voting locations in our Florida counties of interest closed promptly. Although the counties we study in 2016 served as many individual per day as they had in 2012, they appear to have been more prepared to handle the high rates of early voting.
We also estimated the effect that waiting in line in 2012 had on future electoral participation, that is, on voting in 2014 and in 2016. We found a very slight negative effect of 2012 line waiting on turnout in 2016, an effect amounting to no more than a one percentage point decrease in the propensity to vote. The result is similar to that identified by Reference PettigrewPettigrew (2017b). A one percentage point effect is small in magnitude, which is normatively pleasing, but any negative effect or lines on future turnout are normatively troubling. In 2014, a midterm election year, we find larger effects of 2012 line waiting on turnout. Thus, not only are some voters penalized by waiting in line, but a small number of these individuals appear to be dissuaded from voting in the future, thus lessening their voices.
Overall, our evidence shows that the 2012 General Election in Florida did not treat all voters equally. Minority voters in 2012 voters faced disproportionately long lines—thus disproportionately high costs of voting—and then, in some cases, a small downstream effect in 2014 and 2016 of a decreased propensity to vote. Our results illustrate how administrative aspects of elections, in particular, resource allocation decisions that affect whether an election will have lines at the polls or not, should not only be understood as administrative in nature, but also as indicative of the underlying fairness of the electoral process and the extent to which all voters are treated equally under the law.
Appendix
Logit Regression Predicting Voter Turnout in 2016.

Note. County fixed effects not displayed.
* p < 0.1. **p < .05. ***p < .01.
Summary of Registered Voters in Florida Voter File as of January, 2016.

Authors’ Note
Earlier versions of this manuscript were presented at the 2017 Annual Meeting of the Midwest Political Science Association, Northwestern University, and the Free University of Berlin. The authors thank Evan Morgan for research assistance, Michael Hanmer and Hollye Swinehart for comments on earlier drafts, and staff members from various Florida Supervisor of Elections offices for data on early voting check-in times.
Declaration of Conflicting Interests
The author(s) declared no potential conflicts of interest with respect to the research, authorship, and/or publication of this article.
Funding
The author(s) received no financial support for the research, authorship, and/or publication of this article.
ORCID iD
Michael C. Herron https://orcid.org/0000-0002-2021-2495
Author Biographies
David Cottrell is assistant professor of Political Science at the University of Georgia and has been on the faculty there since 2019. Cottrell is working on projects that use data science to detect bias in elections and legislative redistricting. After receiving his doctorate from the University of Michigan in 2015, he spent four years at Dartmouth College, first as a postdoctoral fellow in the Program in Quantitative Social Science and later as a visitor in the Department of Government.
Michael C. Herron is the William Clinton Story Remsen 1943 professor of Government at Dartmouth College. Herron received his doctorate from Stanford University in 1998, and his current research focuses on election administration with a focus on absentee voting. At Dartmouth, where he has been on the faculty since 2003, Herron teaches courses in applied statistics and in game theory.
Daniel A. Smith (@electionsmith) is professor and chair of the Department of Political Science at the University of Florida. His research is motivated by understanding how political institutions affect political behavior across and within the American states.