I. INTRODUCTION
Fe–Cr–Mo ferritic alloys are good candidates for high temperature applications and are often used in the oil industry. Historically, the development of ferritic alloys began in the 1920s with the introduction of Fe–Cr–Mo steels for power generation applications. Reference Kim, Park and Lee1–Reference Das, Joarder and Mitra4 In these alloys, the addition of chromium primarily serves to improve corrosion resistance, while molybdenum increases mechanical resistance at elevated temperatures and also improves resistance to pitting corrosion. Fe–Cr–Mo (ferritic-based) alloys are widely used in the petrochemical and power generation industries, and they are used in a variety of shapes that include tubes and pipes, plates, sheets, and structural components. Reference Kuzucu, Aksoy and Korkut5,Reference Souza6
One important requirement for alloys to be used in industrial practice, which require high operating temperature, is that their properties, which are directly related to their microstructure, should be stable. Therefore, it is important to know the possible microstructural changes that can occur over the lifetime of components made of Fe–Cr–Mo alloys. Reference Furtado, Almeida and May7,8 In addition, it is important to understand the kinetics of transformation and to identify the phases and precipitates formed in the matrix, which may change the mechanical properties and corrosion resistance of the alloys. Reference Parvathavarthini, Saroja, Dayal and Khatak9
Therefore, the aim of this study was to investigate the influence of molybdenum content on the corrosion resistance and microstructure of model Fe–Cr–Mo ferritic alloys. The alloys were prepared using a constant Cr content (9 wt%) and varying Mo contents (5, 7, and 9 wt%). For comparison purposes, a commercial alloy P9 (Fe–9Cr–1Mo, wt%) was also studied.
II. EXPERIMENTAL PROCEDURES
A. Model alloys
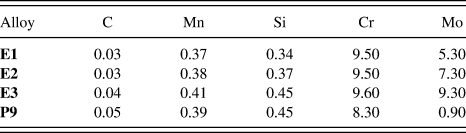
Model Fe–Cr–Mo alloys were fabricated with low C content (<0.05 wt%), which is typical for ferritic stainless steels and with higher Mo content than that found in commercial P9 alloys. The alloys were produced in an induction furnace at The Technological Research Institute (Instituto de Pesquisa Tecnológica - IPT) from commercial ferro-alloys containing 60–65 wt% Mo and 52–56% Cr wt%. The institute is linked to the Department of Economic Development, Science, Technology and Innovation of the State of São Paulo, Brazil. The ingots were then cut, and small portions were hot rolled in multiple reductions to achieve a thickness on the order of 5–10 mm. The model alloys were named as follows: E1 (9Cr–5Mo, wt%), E2 (9Cr–7Mo, wt%), and E3 (9Cr–9Mo, wt%). A newly bought commercial tube A213 T9-P9 (9Cr–1Mo, wt%) was also studied as a reference material. The chemical compositions of the alloys were obtained using an optical emission spectrometer (Shimadzu PDA 7000, Kyoto, Japan) and are listed in Table I. The values presented represent an average of three measurements.
Chemical compositions of the studied alloys (wt%).

Prior to testing, the model alloys were hot rolled with a starting temperature of 1000 °C. From the calculation of the phase diagrams using the software Thermocalc®, the temperature of 1030 °C was selected for the annealing of the E1, E2, and E3 alloys for 20 min, followed by quenching in water. This procedure was carried out to dissolve any secondary phases that may have formed during the hot rolling process. The P9 alloy samples were tested under the as-received condition to maintain their original characteristics and to simulate the typical use of P9 in the petrochemical industry. Based on the temperatures that Fe–Cr–Mo materials commonly operate in petrochemical industries, a temperature range from 400 °C up to 600 °C was selected for the annealing process. Reference Nelson and Klueh3 Additionally, to simulate exposure of the alloys to industrial practice, various combinations of time and temperature were tested. Specifically, the samples were treated at 450, 500, 550, 600, and 650 °C for 10 min, 100, 1000, and 10,000 min, followed by water quenching.
B. Computational calculation of the phase diagrams
The phase diagrams of the E1, E2, and E3 alloys were calculated using the software Thermocalc®. The measured chemical compositions of the alloys were used as input, and the temperature range was set to between 400 and 1100 °C. The software allows the evaluation of the expected phases present in the alloys at each temperature studied as well as their corresponding percentages. The phase percentages were calculated using the TCFE6 database.
C. Characterization
Microstructural characterization of the samples, after solution annealing and exposure to the heat treatment conditions, was performed using a Philips XL-30 scanning electron microscope (SEM; Eindhoven, Netherlands) equipped with a HKL electron backscattered diffraction (EBSD) system and Channel 5 EBSD software. The samples were prepared according to ASTM E 3-01, which outlines the standard procedures for the preparation of metallographic specimens. The microstructures of the samples were revealed using Vilella's solution (1 g picric acid, 5 mL hydrochloric acid, and 100 mL ethanol) at an etching time of 3 s. The samples were also characterized using an x-ray dispersive energy (EDS) apparatus attached to the SEM.
D. Electrochemical corrosion tests
The corrosion resistance behavior of the alloys was studied by potentiodynamic polarization curves. Electrochemical corrosion tests were performed at room temperature (≅ 25 °C) using a potentiostat/galvanostat Autolab PGSTAT30, which was interfaced with a microcomputer running the GPES software to acquire the electrochemical data. The electrochemical cell consisted of an Ag(s)/AgCl(s)/Cl− (aq)-saturated electrode as a reference electrode, a 2 cm2 platinum plate as an auxiliary electrode, and the alloys being studied as working electrodes. To fabricate the working electrodes, the samples were cut in a quadrangular geometry of 1 cm2 and connected to a copper wire. The mount was then cured in an epoxy resin. Prior to the electrochemical tests, the working electrodes were mechanically polished using sand papers with grain sizes of 100, 220, 320, 400, 600, and 1200. The test solution was 0.1 mol L−1 NaCl and 0.5 mol L−1 H2SO4. In the scanning experiments, the initial potential applied was −0.60 V, chosen to start the scan from a potential slightly more negative than the open circuit potential. The final potential was 1.2 V, and the scan rate was 1 mV s−1. To achieve the steady state for the open circuit potential, the potential scans were initiated 30 min after the working electrodes were immersed in the test solution. Three replicates of the electrochemical measurements were performed, and the results shown represent an average of the measurements.
III. RESULTS AND DISCUSSION
A. Theoretical computational calculations
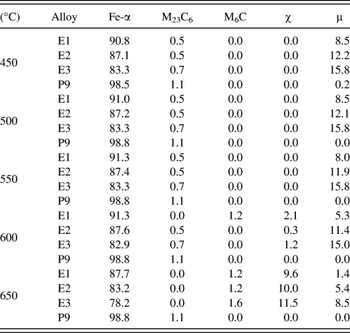
The phases provided by the Thermocalc® software and their corresponding calculated percentages are listed in Table II. Notably, neither chi phase (χ) nor M6C carbide is expected to form at temperatures below 600 °C. The fraction of M23C6 carbide up to 650 °C is also predicted to be low for the three model alloys. This table also forecasts that the percentage of deleterious Mo and Cr-rich phases will increase with the Mo content for alloys annealed at temperatures equal to or higher than 600 °C. This prediction is explained by the well-known fact that the formation of both χ and μ phases is more favorable in alloys with higher Mo content. Reference Mitchell10 The formation of such phases may deplete the matrix of these important elements and lead to a degradation of the desired properties, such as corrosion resistance and mechanical strength.
Thermocalc® calculated phases present in alloys E1, E2, E3, and P9 and their corresponding calculated percentages (wt%) at each studied temperature.

The most probable phase to be formed up to 600 °C is µ, with the predicted percentages varying between 5.3 and 15%, while χ is expected to be the major secondary phase at 650 °C, with the percentages varying between 9.6 and 11.5%. Table II also shows that M23C6 will not form above 600 °C. Rather, it will transform into M6C, which is consistent with reports in the literature suggesting that M23C6 transforms into M6C at this temperature due to the increased availability of Mo from the dissolving M23C6 carbide. Reference Jo, Lim and Kim11
Some elements in steels, such as Cr, Mo, V, W, and Ti, can form carbides. Therefore, when these alloying elements are present at sufficient concentrations, the formation of carbides is expected. The possible phases that can occur in a material can be predicted from calculated phase diagrams, but some limitations apply and the results must be interpreted with care. Under some conditions, equilibrium is not reached on a timescale compatible with the treatment applied to the material. In these cases, the structures indicated in the diagram cannot form, Reference Kodentsov, Bastin and Van Loo12,Reference Andersson, Helander, Höglund, Shi and Sundman13 meaning that not all of the predicted phases will necessarily be present. Under equilibrium cooling conditions, the presence of secondary phases, such as mu (μ), chi (χ), and M23C6 and M6C carbides, becomes possible. Below this temperature range, the alloying elements are not able to diffuse quickly enough to initiate carbide nucleation and growth. Reference Bhadeshia and Honeycombe14 Cr, Mo, V, W, and Ti diffuse substitutionally, and longer times are required for their diffusion through the ferritic matrix. Reference Andersson, Helander, Höglund, Shi and Sundman13 At 650 °C, up to 1.6% of M6C carbide may be formed.
B. Initial characterization of the alloys
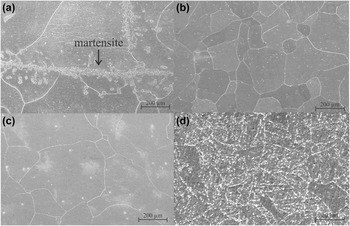
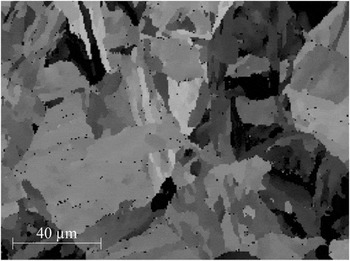
SEM images showing the surface morphologies of the three alloys, which were only subjected to the solution annealing treatment, and the as-received P9 alloy are shown in Fig. 1. These images reveal that the E1, E2, and E3 alloys had equiaxed grains of similar sizes [Figs. 1(a)–1(c)]. In contrast, the micrograph of the as-received P9 alloy [Fig. 1(d)] shows precipitates at the grain boundaries and within grains. Such precipitation arises from the quenching and tempering heat treatments that these commercial alloys are normally subjected to manufacturing processes. Reference Andersson, Helander, Höglund, Shi and Sundman13,Reference Bhadeshia and Honeycombe14 Also, as the features in Fig. 1(d) were one order of magnitude smaller than the ones seen in Figs. 1(a)–1(c), the magnification used for the P9 alloy micrograph was greater than the one used for the other alloys (3000x and 200x, see magnification marks). Figure 2 shows an EBSD map of the phases present in the as-received P9 alloy. This map shows a region containing 98.2% of a body-centered cubic phase and 0.8% of chromium carbide M23C6. The black points seen in the map represent the carbides (FeCr)23C6. These data approximately follow the Thermocalc® calculated phase fractions shown in Table II.
SEM micrographs of the solution annealed E1 (Fe–9Cr–5Mo, a), E2 (Fe–9Cr–7Mo, b), E3 (Fe–9Cr–9Mo, c), and as-received P9 (Fe–9Cr–1Mo, d) alloys.

EBSD micrograph of the as-received P9 alloy.

In the SEM image of alloy E1 [Figure 1(a)], a distinct phase that is in addition to the Fe-α matrix and is absent in the SEM images of the E2, E3, and P9 alloys [Figs. 1(b)–1(d)] is apparent (black arrow in central region). Localized EDS analyses were carried out to characterize the chemical composition of these precipitates. Additionally, computational Thermocalc® analysis from 400 °C to 1100 °C was conducted to investigate the possible formation of intermetallic phases during the solution annealing process at 1030 °C. The EDS analyses showed that the precipitates and the grain matrix have the same chemical compositions, and the Thermocalc® calculations predicted the formation of austenite (Fe-γ) during the solution annealing process at 1030 °C.
Austenite is known to be unstable, and Lerchbacher et al. Reference Lerchbacher, Zinner and Leitner15 showed that the martensite can be formed from austenite during cooling, after a heat treatment process. Therefore, the precipitates observed in the SEM images of alloy E1 are interpreted as being a low C martensite phase that was formed during the water cooling process; the body-centered cubic structure was due to the low-carbon content in the alloy, which did not promote the tetragonality of the unit cell.
C. Characterization of the alloys after heat treatment
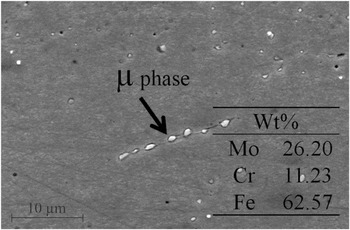
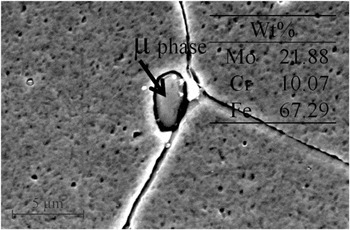
Figures 3 and 4 show SEM images of E2 and E3 alloys after heat treatment at 450 °C for 10 min. In these images, precipitates of different sizes can be observed and EDS analyses revealed that these precipitates had a higher Mo content as compared to Cr. The chemical compositions of the precipitates are indicated in the corresponding figures. The increased Mo content is a characteristic of μ phase, which can reduce both mechanical strength and corrosion resistance in Mo containing alloys. Reference Hirata, Iwai and Koyama16 The arrows in the figures indicate the precipitates on which EDS analyses were performed. It also has to be considered that the results of chemical analyses are influenced by the matrix effect and the compositions shown may have been increased by the contents of the ferritic matrix containing the precipitates.
SEM micrograph of an E2 (Fe–9Cr–7Mo wt%) sample heat-treated at 450 °C for 10 min.

SEM micrograph of an E3 (Fe–9Cr–9Mo wt%) sample heat-treated at 450 °C for 10 min.

Table II shows that, in addition to the ferritic phase, μ and M23C6 carbide phases can occur at 450 °C. Furthermore, up to 550 °C, the only phase predicted to have a volume fraction greater than 1% is μ, and little carbide formation is expected in all of the model alloys up to 550 °C.
From the literature, it is known that M23C6 carbide has a higher content of Cr than Mo and that the enthalpy of formation of Mo carbide is high, meaning that it requires a long time to form at a given temperature. Reference Bhadeshia and Honeycombe14 Thus, the formation of Cr carbide is favored, and Mo is available for the formation of the μ phase. Studies on Fe–9Cr–1Mo alloys have indicated that the formation of M23C6 requires temperatures in excess of 500 °C, depending on the composition of the alloy, due to a dependency on interdiffusion of the alloying elements. Reference Jones, Hillis and Polonis17
According to the results obtained from Thermocalc®, the formation of both μ phase and M23C6 carbide is possible at 450 °C. Nevertheless, the carbide formation reaction occurs predominantly at high temperatures and requires a long period of time to be completed. Thus, the carbide can be considered to be metastable at low temperatures. Reference Janovec, Svoboda, Výrostková and Kroupa18 Kroupa et al. Reference Kroupa, Výrostková, Svoboda and Javonec19 carried out theoretical calculations to evaluate the Gibbs free energy change with respect to temperature for the formation of M23C6 and M6C carbides in Fe–Cr–Mo ferritic alloys containing 0.09 to 0.12 wt% C, 2.4 to 2.6 wt% Cr, and 0.7 to 0.95 wt% Mo. They predicted the formation of only a small amount of carbides at temperatures between 530 and 580 °C. This prediction is in good agreement with the data in Table II, which shows that, besides µ, the fractions of precipitates at temperatures between 450 and 600 °C are predicted to be very low. In addition, Table II shows that the formation of M23C6 precipitates is not expected at temperatures above 600 °C, which agrees with published data. Reference Kroupa, Výrostková, Svoboda and Javonec19
Studies published in the literature claim that the formation of the χ phase requires a minimum Mo content, and heat treatments performed on a ferritic alloy containing 2% Mo (wt%) at 700 °C for 10,000 h were not sufficient to reach equilibrium and precipitate χ. Reference Krauss20 It has also been reported that χ phase formation precedes the formation of the sigma phase (σ) at slow cooling rates. Reference Padilha21 In alloys E1, E2, and E3, the presence of σ was not predicted by the calculations for any of the conditions used. Therefore, the carbide can be considered metastable at low temperatures, and the precipitates found in the microstructures of the annealed alloys, shown in Figs. 3 and 4, are understood as being μ.
D. Electrochemical corrosion tests
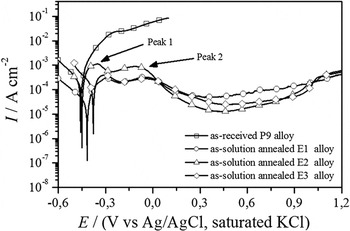
Figure 5 shows the polarization curves obtained for the P9 (as-received), E1, E2, and E3 (solution-annealed) alloys. Importantly, the anodic current density continually increases with the applied potential for the P9 alloy, indicating that it corrodes actively in the studied medium and presents the poorest corrosion resistance among the studied alloys, which was expected, since the molybdenum content in P9 is only about 1% (wt%). After the electrochemical test, it was visually observed that the P9 surface was completely attacked, and nonadherent corrosion products on the surface were observed.
Potentiodynamic polarization curves of the as-received P9 (Fe–9Cr–1Mo) alloy and solution-annealed E1 (Fe–9Cr–5Mo), E2 (Fe–9Cr–7Mo), and E3 (Fe–9Cr–9Mo) alloys in 0.1 mol L−1 NaCl and 0.43 mol L−1 H2SO4 with 1 mV s−1 and at room temperature.

On the other hand, the electrochemical behavior presented by P9 alloy in the 0.1 mol L−1 NaCl and 0.43 mol L−1 H2SO4 solution is opposite to that observed for 9Cr–1Mo ferritic steel in the H2SO4 solution showed by Modi et al. Reference Modi, Mungole and Singh22 These authors showed that the anodic branches of the polarization curves obtained for 9Cr–1Mo alloys in the H2SO4 solution were characterized by the existence of five regions: active, prepassive, passive, secondary passive, and transpassive. However, they also showed that, in artificial seawater, the 9Cr–1Mo ferritic steel did not presented passivation. Therefore, the observed active dissolution of the commercial P9 alloys in 0.1 mol L−1 NaCl and 0.43 mol L−1 H2SO4 electrolytes is related to the presence of the chloride ions in the solution, which did not allow the formation of a stable passive film on the P9 surface.
For the E1, E2, and E3 model alloys, the electrochemical behaviors were similar among them and also similar to those observed for Fe–12Cr–xMo (x = 0, 5, and 10) in 1 mol L−1 H2SO4 by Bojinov et al. Reference Bojinov, Betova and Raicheff23 Initially, it can be seen that an active dissolution region in the potential range located before the two current density maximums observed around −0.3 V (peak 1) and −0.1 V (peak 2), which characterize the prepassive region. After these two peaks, the current density decreases to a minimum value at approximately 0.4 V, followed by the gradual increase in current density for values greater than 0.4 V. The observed decrease in anodic current densities after the second peak is associated with the recovery of the surface by metal oxides film formed during the anodic polarization, characterizing a passive region, while the increase in anodic current densities observed after −0.4 V is attributed to the breakdown of the films. These results suggest that the oxide films formed on the surface of these alloys are not electrochemically stable in the studied medium; since due to the low chromium content (9 wt%) in these alloys, stable Cr2O3 protective surface film does not form when they are exposed to oxidizing conditions added to the chloride ions. Instead, a nonprotective iron oxide film will form. Reference Huntz, Bague, Beauplé, Haut, Sévérac, Lecourb, Longaygue and Ropital24
In addition, all polarization curves obtained for model alloys present a passive region, while the commercial P9 (9Cr–1Mo) has active dissolution, demonstrating the improvement in the corrosion resistance of the Fe–Cr–Mo alloys due to the increase of Mo content in the alloy composition. Furthermore, among the model alloys, it is evident that the E1 alloy (9Cr–5Mo) presents the highest anodic current densities in all the regions of the polarization curves, while the difference between the anodic current densities displayed by E2 (9Cr–7Mo) and E3 (9Cr–9Mo) alloys was not so remarkable, indicating that the Mo content higher than 7% did not lead to a significant improvement in the corrosion resistance of the Fe–Cr–Mo alloys.
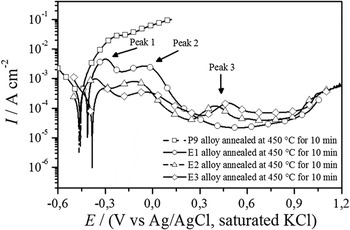
Figure 6 shows the polarization curves for P9, E1, E2, and E3 alloys heat treated at 450 °C for 10 min. The polarization curve of the annealed P9 alloy is similar to that obtained for the as-received P9 alloy, with the anodic current density rising with the applied potential. This result indicates that, even under the annealed conditions, the P9 alloy shows the worst corrosion resistance behavior. The anodic branches of the polarization curves of the annealed E1, E2, and E3 alloys show two peak current densities in the same potential range observed for the solution annealed alloys. Furthermore, a third maximum is observed approximately 0.4 V in the polarization curves of the both annealed E2 and E3 alloys.
Potentiodynamic polarization curves of the P9 (Fe–9Cr–1Mo), E1 (Fe–9Cr–5Mo), E2 (Fe–9Cr–7Mo), and E3 (Fe–9Cr–9Mo) alloys heat-treated at 450 °C for 10 min using 0.1 mol L−1 NaCl and 0.43 mol L−1 H2SO4 with 1 mV s−1 and at room temperature.

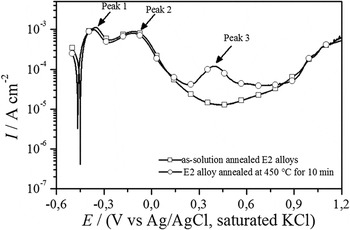
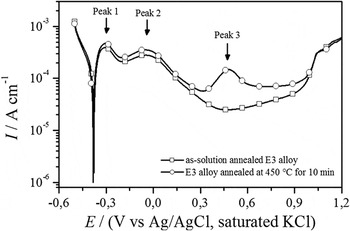
Comparing the polarization curves obtained for the as-solution annealed and as-annealed samples, it can be noted that the as-annealed sample presented the higher current density values. In addition, the comparison between the polarization curves obtained for the as-solution annealed and as-annealed E2 and E3 alloys revealed that the marked difference between the as-solution annealed and as-annealed samples was between 0.3 and 0.9 V, as shown in Figs. 7 and 8. In this potential range, the current values of the annealed samples were smaller to those obtained for the heat-treated samples and the third peak that appeared with peak current density around 0.5 V, which was attributed to the microstructural changes induced by the heat treatment, which was associated with the presence of µ phase. After the third peak, current values decreased indicating that both heat-treated alloys repassivated.
Comparison between the polarization curves obtained for the E2 alloys of as-solution annealed and annealed at 450 °C for 10 min. The curves were obtained using 0.1 mol L−1 NaCl and 0.43 mol L−1 H2SO4 with 1 mV s−1 and at room temperature.

Comparison between the polarization curves obtained for the E3 alloys of as-solution annealed and annealed at 450 °C for 10 min. The curves were obtained using 0.1 mol L−1 NaCl and 0.43 mol L−1 H2SO4 with 1 mV s−1 and at room temperature.

Moreover, some electrochemical parameters derived from the polarization curves obtained for the E1 alloy revealed a very interesting behavior. For the solution-annealed sample, the critical current density was about 3 × 10⁻⁴ A cm−2, the passivation current density was around 6 × 10⁻⁵ A cm−2, and the passivation range was between 0.35 and 0.95 V, while such electrochemical parameters for the sample annealed at 450 °C were: 3 × 10⁻³ A cm−2, 2 × 10⁻⁵ A cm−2, and from 0.4 V up to 0.9 V, respectively. Therefore, these results indicated that due to the precipitation of the martensite phase during the heat treatment at 450 °C, more current density to passivate was required, but once the alloy was passivated, less current to keep the passive film was needed, which is interesting for industrial practice, such as anodic protection applications. Finally, the electrochemical results proved that the as-annealed E2 and E3 alloys had inferior corrosion resistance than the corresponding as-solution annealed samples.
To rationalize that how the phases present in annealed E1, E2, and E3 alloys are associated with the maxima observed in the corresponding polarization curves, additional polarization tests were performed in which the polarization ended once the maximum current densities were reached. The samples were subsequently examined with SEM.
Prior to the electrochemical tests, the surface morphologies of the E1, E2, and E3 alloys after heat treatment at 450 °C for 10 min were observed by SEM. Notably, while markings from the sanding process were seen on the sample surfaces, no holes or cracks were observed.
Figure 9 shows a SEM micrograph of an annealed E1 alloy after the polarization test, which was stopped at the first maximum value of current density. This SEM image shows markings from the sanding process and stains from the etching, as well as the revelation of martensite. Martensite is a solid solution that is supersaturated with carbon and has body-centered tetragonal structure, which is a distorted form of α-iron (ferrite). When the carbon content is lower than 0.2 wt%, which is the case for the alloys used in this study, the structure tends to become body-centered cubic. Reference Smallman and Bishop25 The more pronounced attack in the martensitic structure compared to the ferritic structure maybe due to the metastable nature of this phase. Martensite carries in its microstructure more defects and interfaces than ferrite. Thin lamellae are formed, providing a greater surface area, which should allow for preferential and faster electrochemical attack. Reference Ustinovshikov26,Reference Shen, Kim, Cho, Han and Ryu27 Thus, the first peak observed in the polarization curves of alloy E1 is associated with the dissolution of the martensitic phase. Additionally, it was verified by EDS analysis that the chemical compositions of both ferritic matrix and revealed martensite were similar, suggesting that the formation of this phase is indeed diffusionless.
SEM micrograph of an annealed E1 alloy (Fe–9Cr–5Mo) after a polarization test ending at the first peak value of current density.

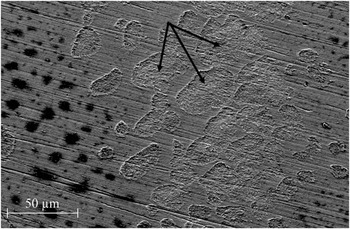
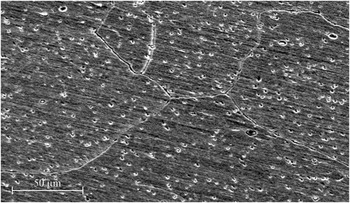
Figure 10 shows a micrograph of an E2 sample, which was heat-treated at 450 °C for 10 min and subjected to the polarization test to the first peak. It can be observed that the sample surface contains scratches from the preparation process, and the grain boundaries were attacked. Furthermore, the ferritic matrix shows regions with localized corrosion, characterized by the formation of small cavities (pits), which vary in size.
SEM micrograph of an E2 alloy (Fe–9Cr–7Mo), which was heat-treated at 450 °C for 10 min, after polarization testing to the first peak value of current density.

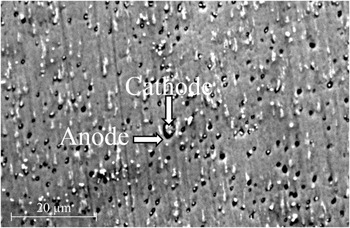
The grain boundaries are chemically more reactive and depending on the crystal defects and/or chemical heterogeneity, the material can be attacked in their contours. Intergranular corrosion occurs in some alloys in specific environments due to potential differences between the compounds that are precipitated in the grain boundaries. The compounds present in the grain boundaries can be more (cathode) or less noble (anode) with respect to matrix. If these precipitates are anodic, they will be preferably eroded, and the remaining material will become cathodic. If the depleted zones of alloying elements are anodic in relation to their neighboring precipitates, they will form the cathodes of the electrochemical cell and promote corrosion of the depleted zones. Reference Kritzer28 In the alloy analyzed, the μ phase, which is rich in molybdenum and has a more noble structure than the ferritic matrix, is formed at this temperature. Therefore, the μ phase acts as the cathode and the matrix as the anode, promoting corrosion in the neighboring regions.
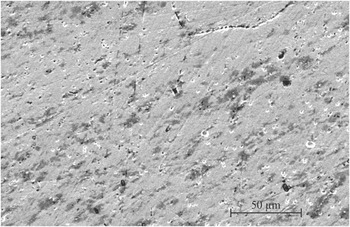
Figure 11 shows a SEM micrograph of the E2 alloy surface after polarization testing to the second peak. It can be observed that the grain boundaries are revealed. Furthermore, localized attacks can be seen in the interior of the ferritic grains. The SEM image, shown in Fig. 10, presents the surface morphology of the heat-treated E2 alloy, after polarization to the third current density peak (peak 3). This image shows evidence of a localized attack that formed cavities around the grains, indicating that the grains were the cathode and that their vicinity is the anode. EDS analyses showed that the grains had a higher content of Mo than Cr and the Mo content varying between 12 and 35 wt%. As indicated by the arrows in Fig. 12, the dissolution of the ferritic matrix in region around the precipitate can clearly be observed. This dissolution may have been due to the formation of a cathodic region, formed by the precipitate, and an adjacent anodic region, formed by a ferritic matrix, which was depleted of Cr and Mo, making it more susceptible to electrochemical attack. Therefore, the second and third peaks observed in the polarization curves are explained as been due to the localized attack occurred around the precipitates, since ferritic matrix has lower Cr and Mo concentrations than the μ phase formed during the annealing process.
SEM micrograph of an E2 (Fe–9Cr–7Mo) alloy, which was heat-treated at 450 °C for 10 min, after polarization testing to the second peak value of current density.

SEM micrograph of an E2 (Fe–9Cr–7Mo) alloy, treated at 450 °C for 10 min, after polarization testing to the third peak value of current density.

IV. CONCLUSIONS
All the three as-solution annealed Fe–9Cr–xMo (x = 5, 7, and 9) alloys presented better corrosion resistance than the commercial P9 alloy under the tested conditions. However, the heat treatment led to the precipitation of the μ phase, which has higher Mo content than the ferritic matrix, while the martensite phase was formed during cooling of the Fe–9Cr–5Mo alloy. Electrochemical experiments indicated that the as-solution annealed Fe–9Cr–xMo alloys were more resistant than the commercial P9 and that Mo content higher than 7% did not lead to a significant improvement in the corrosion resistance of the Fe–Cr–Mo system whatsoever. In addition, the heat-treated Fe–9Cr–5Mo alloy has shown potential for industrial practice, since the alloy required more current density to passivate, but less current to keep the passive film. Finally, due to the formation of the μ phase, deleterious to corrosion resistance properties in the heat-treated samples, no corrosion resistance difference was observed among the Fe–9Cr–xMo alloys.
ACKNOWLEDGMENTS
The authors would like to acknowledge financial support received through the Brazilian National Research Council (CNPq - Edital Universal/CNPq14/2013 Proc. 470960/2013-2) and the Cearense Foundation for the Support of Scientific and Technological Development (FUNCAP-Edital 2013/Proc. CI1-0080-0033.01.00/13. Amanda S. C. Urcezino thanks the National Council for the Improvement of Higher Education (CAPES) for the scholarship provided.