Introduction
The diversification of tourism products is part of the development pathway of tourism in destinations across the world. The diversification of activities, transport modes, and accommodation types reflects the increasing levels of specialisation and competition among tour operators as well as a shift towards experiential travel (Page Reference Page2003; Stamboulis and Skayanis Reference Stamboulis and Skayanis2003; WTO 2001). Diversification is often advocated as a strategy to make regions focused on a single economic activity, or a single mass tourism product, more sustainable, that is less vulnerable to external shocks and fairer in terms of distribution of costs and benefits (for example Bramwell Reference Bramwell2004; Hunter Reference Hunter1997). Critical voices can be heard as well regarding the practical challenges of diversification, for instance in rural tourism (for example Sharpley Reference Sharpley2002). Across the world the diversification of tourism activities, and the resulting varying interests of visitors, tour operators and other stakeholders, demonstrates the need for visitor management (Page Reference Page2003).
The diversification of tourism in Antarctica has been met with concern by those who claim that new types of tourism may pose safety risks, disturbance of wildlife and environmental impacts, erosion of intrinsic Antarctic wilderness values (for example Antarctica becoming a simple playground) and even strategic judicial challenges in the longer term (ASOC 2008; Bastmeijer Reference Bastmeijer2003; Bastmeijer and others Reference Bastmeijer, Lamers and Harcha2008; Lamers and others Reference Lamers, Stel, Amelung, Snyder and Stonehouse2007). High-risk adventure activities, the use of existing scientific facilities for tourism, or the development of permanent land–based tourism infrastructures are examples of developments that might pose such challenges (Bastmeijer and others Reference Bastmeijer, Lamers and Harcha2008; Lamers and others Reference Lamers, Stel, Amelung, Snyder and Stonehouse2007; Murray and Jabour Reference Murray and Jabour2004). It has also been suggested that different types of activities might attract tourists and tour operators that are not as dedicated to the integrity of Antarctic ecosystems and intrinsic values as are the present ones (Hemmings Reference Hemmings2000; Hummel Reference Hummel1994). So far, these concerns have not been supported by empirical evidence, for example in the form of a detailed case study.
The objective of this paper is to start exploring some of the implications of the diversification trend in Antarctic tourism for visitor experiences, environmental and societal outcomes, and onsite management efforts. The paper draws on observations and survey material collected during a diversified Antarctic tourism product: a scuba diving expedition cruise in the Antarctic Peninsula region. Based on this diving expedition case study, the paper aims to answer two interrelated questions. Does the diversification of Antarctic tourist activities result in diverse experiences and behaviours of tourists on board, and what are the implications for wildlife, site use and visitor management? By answering these questions, this paper aims to contribute to the current academic and political discussion on policy development and management options for tourism in Antarctica.
Growth and diversification of tourism in Antarctica
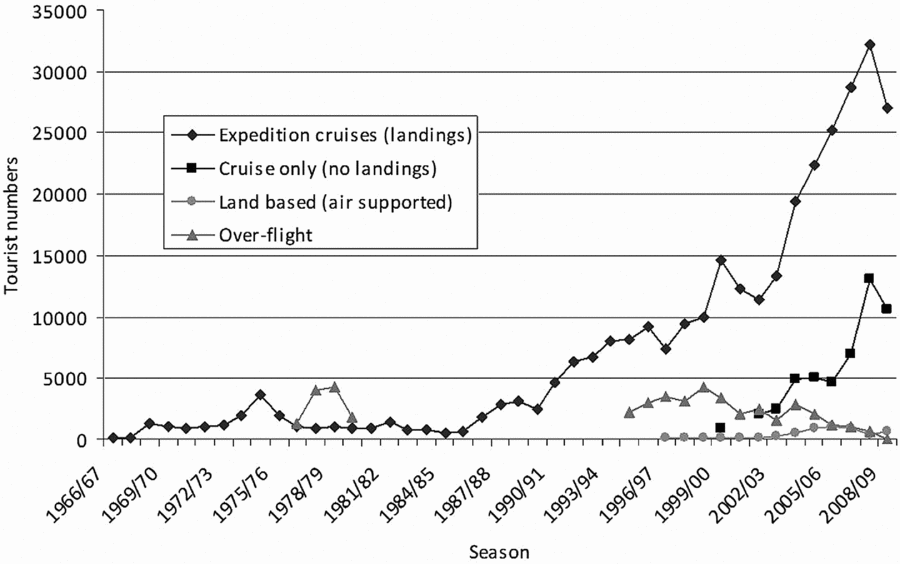
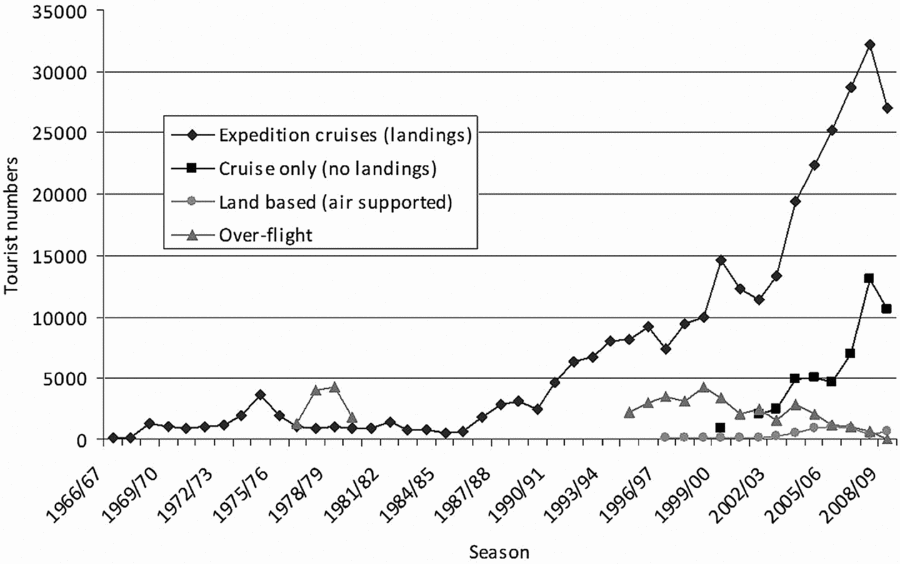
Since the mid-1980s, the annual number of people visiting Antarctica for tourism purposes has increased rapidly from a few hundred to over 45,000 in 2008 (Enzenbacher Reference Enzenbacher1993; IAATO 2008) (see Fig. 1). The consistent growth trend was recently interrupted as a result of the global financial crisis and economic recession, but is likely to return soon. Antarctic tourism has also become more diverse. Tourism operations are largely ship-based (97.7%), with smaller (but increasing) numbers of tourists travelling to Antarctica by air (IAATO 2008). The traditional expedition cruises, involving small to medium-sized ships, Zodiac (inflatable boat) landings and educational programmes, are complemented with large cruise liners making no landings, overflights, fly-sail operations, as well as land based tourism using aircraft for transportation. In the context of expedition cruises and land based itineraries, an increasing range of activities is offered, including helicopter excursions, camping, kayaking, scuba diving, mountain climbing, and cross-country skiing (Bastmeijer Reference Bastmeijer2003; Bastmeijer and Roura Reference Bastmeijer and Roura2004; Stonehouse and Crosbie Reference Stonehouse, Crosbie, Hall and Johnston1995). Thereby, the types of visitors to Antarctica are broadening, and due to the development and logistics of each type of visitation, visitors may seek and encounter widely different experiences (see also Hemmings and Roura Reference Hemmings and Roura2003; Maher and others Reference Maher, McIntosh and Steel2006). The management implications of the diversification of visitor experiences in the polar regions presents a topic that is in need of further research (Stewart and others Reference Stewart, Draper and Johnston2005).
Tourist numbers in Antarctica per industry segment, 1966–2009.
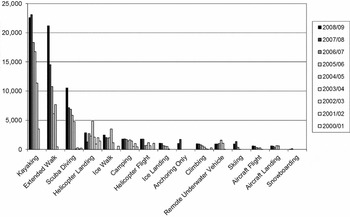
Despite the prominence of the diversification trend in Antarctic tourism in academic literature and policy documents there have been few scholarly contributions dedicated to analysing and understanding its features and implications. Evidence for the diversification trend is typically given by means of a list of activities that can be undertaken in Antarctica (for example Bastmeijer Reference Bastmeijer2003; Bastmeijer and Roura Reference Bastmeijer and Roura2004; Molenaar Reference Molenaar2005; Stonehouse and Crosbie Reference Stonehouse, Crosbie, Hall and Johnston1995). To further substantiate the evidence base for these claims, Fig. 2 shows the number of tourists participating in activities organised from cruise ships in the last decade, as reported by the International Association of Antarctica Tour Operators (IAATO). Activities that can be seen as part of the traditional pattern of expedition cruising and constitute the majority of Antarctic tourism activities, such as Zodiac cruising, site landings and station visits, have been kept out of this graph. Fig. 2 shows that various activities have been introduced in the past years and that the popularity of certain recently introduced activities has grown rapidly, such as kayaking, extended walks, and scuba diving. Popularity can be explained by the limited experience or qualification that are required for undertaking some of these activities, such as walking or kayaking. Others, such as scuba diving, do require extensive skills and qualification (Lamers and others Reference Lamers, Stel, Amelung, Snyder and Stonehouse2007). Less popular activities, such as snowboarding, skiing, underwater vehicles and helicopter flights, depend largely on the initiative of individual tour operators or are limited by the availability of transport technology. It should be noted that some activities that emerged in the past have disappeared due to temporary natural circumstances (for example eclipse viewing trips), accidents and disasters (for example skydiving expeditions, over-flights from New Zealand), and loss of challenge or attraction (for example aviation expeditions) (Lamers and others Reference Lamers, Stel, Amelung, Snyder and Stonehouse2007; Murray and Jabour Reference Murray and Jabour2004). The location, nature and scale of these activities, along with the management mechanisms applied, determine the effects for ecosystems and other human users, as well as the acceptability of these effects (Lamers and others Reference Lamers, Amelung, Saarinen and Tervo2008).
Tourist numbers participating in selected activities, 2000–2009.

Management of Antarctic tourism activities
Visitor management in Antarctica is not a straightforward issue. Tourism is formally regulated by the Antarctic Treaty System (ATS), a group of countries with Antarctic scientific programmes that collectively manages activities in this region. However, tourism policies have typically been ad hoc and reactive, targeting individual expeditions rather than clusters of activities, focusing on requirements rather than restrictions, and often responding to incidents (for example Bastmeijer and Roura Reference Bastmeijer and Roura2004; Hemmings and Roura Reference Hemmings and Roura2003). General operational standards and site-specific guidelines have been adopted by the Antarctic Treaty Consultative Parties (ATCPs) but in a legally non-binding way. There is generally no funding available for onsite management, monitoring and enforcement, despite the fact that the Antarctic is designated as a nature reserve (Snyder Reference Snyder2007). Onsite management is an important task that is now largely left for the tourism industry to cover. Tour operators in Antarctica have maintained a relatively strong record on safety and environmental sensitivities (Splettstoesser Reference Splettstoesser2000). However, its ability to continue in this fashion is not guaranteed (Haase and others Reference Haase, Lamers and Amelung2009). The role of guides in interpreting and enforcing operational rules during shore landings and other activities is pivotal, while the ability of guides to do so varies (Davis Reference Davis1999). In the face of the expanding industry it has been suggested that continuing to recruit qualified and experienced lecturers and guides might pose a future challenge for tour operators (Lamers and others Reference Lamers, Haase and Amelung2008).
Case study and methods
Context
Scuba diving in Antarctica used to be the exclusive realm of scientific programmes, but has become available for recreational divers in the last ten to fifteen years. Organised diving occurs predominantly in the Antarctic Peninsula region and is offered by a few specialised operators on expedition cruises and yachts. Most diving operators require divers to carry a Professional Association of Diving Instructors (PADI) advanced open water certification, a special dry suit certification, a minimum of twenty dry suit dives, a medical report signed by a doctor, and sufficient insurance coverage to allow participation in Antarctic diving (Trotter Reference Trotter2008). These precautionary measures are important for two major reasons. First, scuba diving and snorkelling in Antarctica is not without risk, which is illustrated by recent lethal diving incidents caused by a leopard seal attack and a heart attack while diving (Muir and others 2008; Lamers and others Reference Lamers, Stel, Amelung, Snyder and Stonehouse2007). Second, the medical facilities on board are limited, as are the possibilities for medical evacuation. Hyperbaric chambers or other specialised medical facilities are not immediately available in the event of a diving incident (Trotter Reference Trotter2008).
The diving–expedition cruise
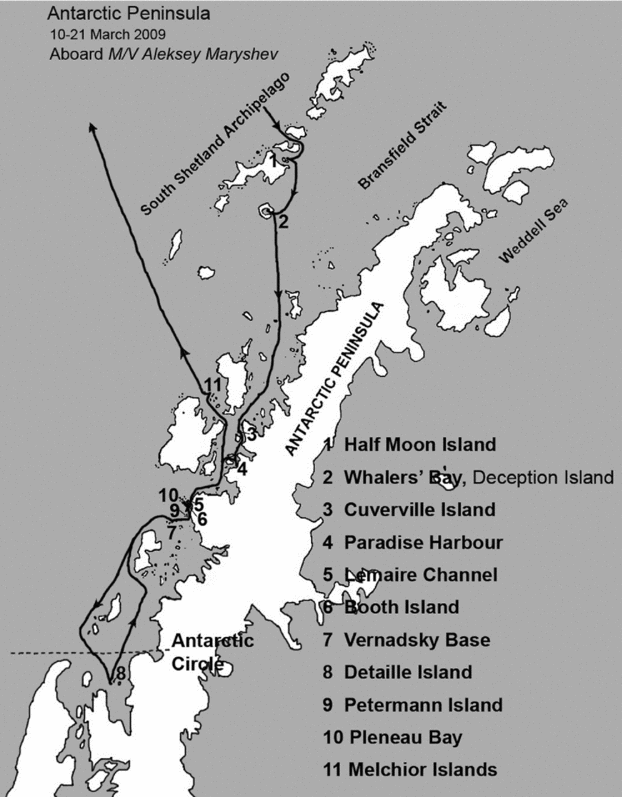
To analyse the variance in passenger experiences and the implications arising from the diversification of Antarctic tourist activities, this article comprises a single descriptive case study of a diving expedition cruise, and presents the first account of such a cruise. Research was conducted during and in the context of a diving expedition cruise in the Antarctic Peninsula Region on board Aleksey Marychev, in March 2009. With this approach the study responds to the mobilities turn in the social sciences (Buscher and Urry Reference Buescher and Urry2009; Sheller and Urry Reference Sheller and Urry2006) that calls for methods to study mobile social phenomena by following the movement in practice. The 11 day cruise followed a standard Antarctic Peninsula itinerary. It set off from Ushuaia (Argentina) and visited the South Shetland Islands and various sites along the Antarctic Peninsula, before returning to Ushuaia (see Fig. 3 for details). Some of these sites can be found on almost any expedition cruise itinerary (for example Half Moon Island, Deception Island, Cuverville Island, Paradise Bay, Lemaire Channel, Vernadskiy Base, Petermann Island), while others are not frequently visited by tourist ships but do get regular visits for diving purposes (for example Pleneau Bay, Booth Island, Detaille Island).
Itinerary of the diving expedition cruise.
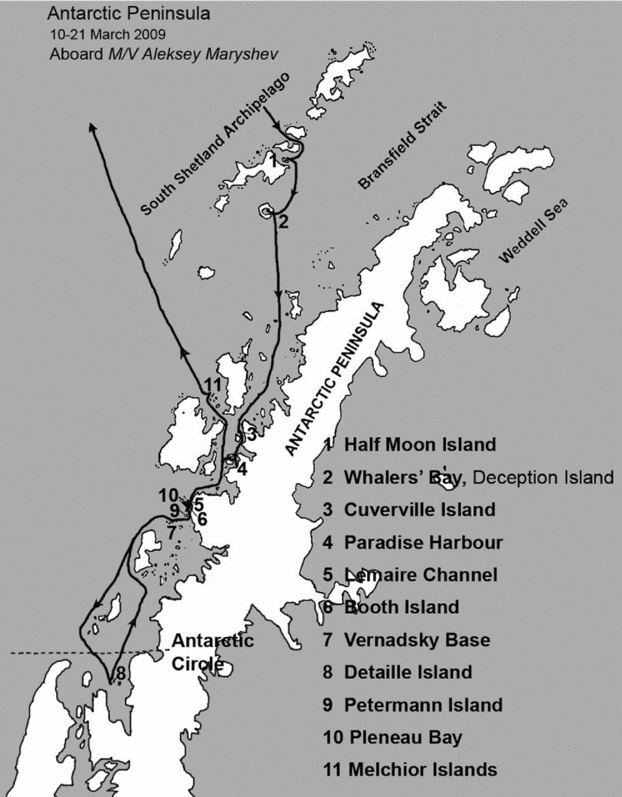
There were 30 passengers on board Aleksey Marychev (including the first author), a ship with a capacity of accommodating a maximum of 48 passengers. This under occupation was caused by the financial crisis and economic recession that emerged in late 2008. The passengers originated from seven countries, being Poland (14), The Netherlands (7), Ireland (4), United Kingdom (1), France (1), Switzerland (1), Spain (1), and the United States (1). Approximately two-thirds of the passengers engaged fully or partly in the dives. Since dives in Antarctic waters generally do not last longer than 45 minutes divers usually joined the non-divers in regular site visits and Zodiac cruising afterwards. All activities undertaken during the cruise were guided by an expedition staff of four, all of whom were experienced polar dive masters. One of these guides was a trained naturalist who conducted the activities for the non-diving tourists, dubbed ‘landfolks’. The ship was equipped with a container to store the diving gear and a compressor to fill diving tanks. Next to the standard briefings on safety and codes of conduct, special briefings were organised for the divers. Similarly, lectures on diving topics were scheduled alongside the regular lectures about Antarctic wildlife, history, and regulations.
Methods
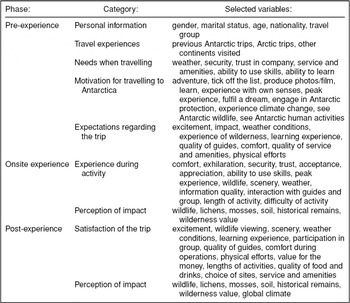
A combination of research methodologies was employed during and after the trip. First, a survey was conducted among the passengers. The aim of the survey was to see if tourists undertaking different types of activities during a multi-purpose trip had different expectations and experiences. Following earlier studies (for example Maher and others Reference Maher, McIntosh and Steel2006; Maher Reference Maher and Kylänen2005, Reference Maher2010), the survey was designed to explore the significance of a wide range of experiential variables at three moments: at the start, during, and at the end of the trip. Besides demographic questions and previous travel experiences to establish the profile, the pre-experience questionnaire consisted of travel needs, motivations for undertaking the trip, and expectations. The onsite experience questionnaire consisted of experience variables (for example comfort, exhilaration, security) and the perceived impact on environmental components. The post experience questionnaire consisted of the satisfaction of the passenger during the whole journey and the overall perceived impact of the journey (see Table 1 for more details). Respondents were asked to score these variables on a 10-point Borg Scale (Borg Reference Borg2004).
Content of the surveys.

Tourists were invited to fill in the first questionnaire immediately after embarking, the second halfway through the trip after a full day of activities in Antarctica, and the third the night before disembarking. Except for some of the Polish passengers, the fact that the questionnaires were in English formed no limitation. Being on board, the lead author managed to receive one or more questionnaires (pre, onsite, and/or post questionnaires) from 25 of the 30 passengers. The survey resulted in a total of 58 completed forms (16 pre-experience, 23 onsite experience, 19 post-experience).
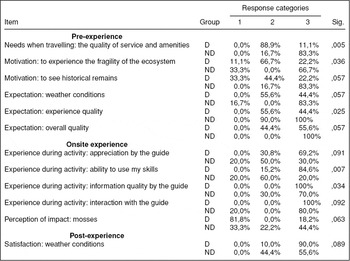
The small sample size and the relatively large number of experience variables included in the three questionnaires do not allow for reliable hypothesis testing. However, survey results were explored using the crosstabs function in SPSS (version PASW Statistics 17) for interesting differences between diving and non-diving passengers. A Pearson chi-square test was used to identify those variables with a significant (≤,005) or close to significant (≤,01) relation with the defined groups. For ease of analysis the 10 point scale was adjusted to a 3 point scale, in which 1 represents a weak value, 2 is average or undecided, and 3 represents a strong value.
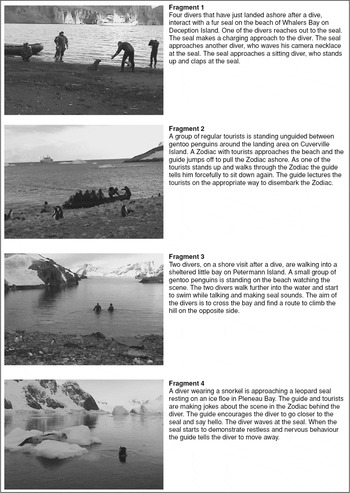
Second, being on board a moving ship allowed the lead author to participate in the activities of the regular tourists (no participation in the diving) and to make participatory observations that were recorded on video and written down in a notebook. Particularly video has been recognised as a useful research tool in mobilities research as it records the onsite movements of people and objects, can easily be produced, and allows for offsite interpretation (Murray Reference Murray2009). The resulting material was analysed in the context of the research questions for diverging and controversial behaviour of staff and tourists. To substantiate the findings of this analysis and the results of the passenger surveys, in-depth interviews were held with four Antarctic tourism experts to reflect on the results. The interviews were semi-structured by a list of questions on the implications of diversification in general and diving expeditions in particular, as well as four selected video fragments of remarkable situations observed during the trip. This interviewing technique has been termed film-elicitation (Murray Reference Murray2009) and works similarly to the photo elicitation technique in which interviewees are asked to respond to photographs or other visual material (Harper Reference Harper2002, Reference Harper, Denzin and Lincoln2005). The film fragments allowed the authors to confront the interviewees with actual situations of the trip that functioned as consistent input for discussing implications throughout the interviews (for a brief description and film still of each fragment see Table 2).
Brief description of the selected video fragments.

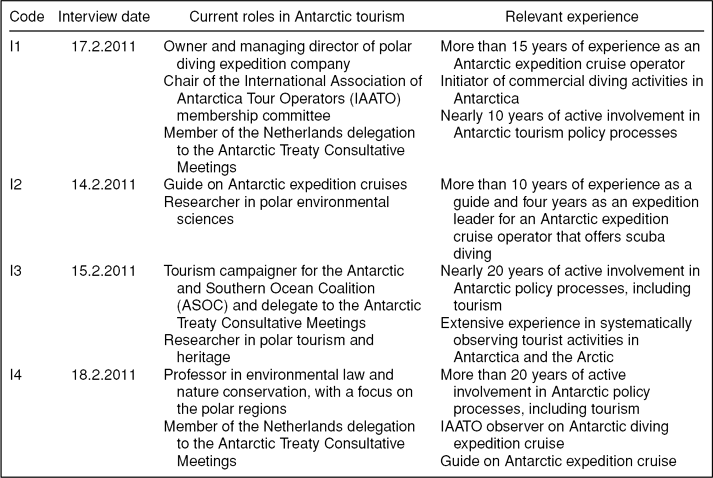
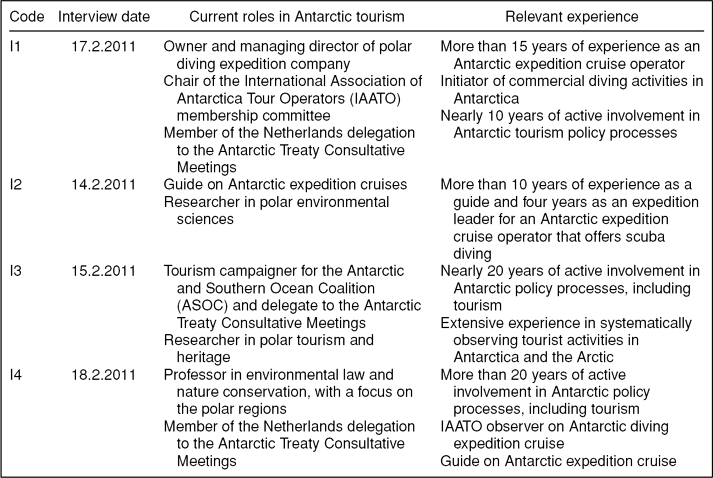
Three interviews were carried out in Dutch and one in English. For accuracy and reliability, interviews were audio recorded and based on these recordings detailed interview reports were drafted and sent to the interviewees for approval and comments. The interview material was qualitatively analysed. Anonymity was guaranteed to the interviewees and consequently a coding system is used for referring to interview results in this article (see Table 3).
Profile and coding of the interviewees.
Results
Profile of the respondents
68% of the respondents were male, equivalent to the higher number of males on board the ship. The average age of the respondents was 44.7 years, which according to some of the interviewees is explained by the special purpose of the trip (I2; I4) as well as a general trend of increasingly younger Antarctic tourists (I2). Of the respondents, 56% engaged fully or partly in diving activities. Further, 36% of the respondents were married (with or without children), 8% were unmarried with partner, 32% were single or widow(er), and 24% of the respondents did not state their marital status. 40% of the respondents travelled with friends, 36% with spouse or family members, and 24% of the respondents travelled alone. None of the respondents had previously visited Antarctica and 8% of the respondents stated that they had previously visited the Arctic. The adventurous spirit of the whole group is reflected in the relatively small share of 33.3% that regarded ‘nice weather conditions’, and 26.7% that considered ‘comfortable temperatures’, important while travelling. The group members found it important to ‘learn new skills’ (66.7%), to ‘obtain special experiences in life’ (86.7%), and to ‘fulfil their dreams’ (73.3%) while travelling. By going on this Antarctic trip 73.3% claimed to ‘want to seek adventure’, and 86.7% wanted to ‘learn about the place’ and to ‘experience it with their own senses’. A large share of the respondents considered it important to see specific features of the Antarctic wilderness, such as ‘penguins in their habitat’ (60%), ‘Antarctic seals’ (80%), ‘Antarctic whales’ (86.7%), ‘icebergs’ and ‘glaciers’ (both 86.7%). 46.7% found it important ‘to see historical remains’, and 53.3% wanted ‘to see scientific stations and research activities’ on the expedition. A lower share of the respondents found it important ‘to experience the fragility of the ecosystem’ (40%), or to ‘get a tangible idea of climate change’ (20%). 93.3% of the respondents on board did not want, or was undecided, to get ‘engaged in the protection of Antarctica’ or becoming ‘an ambassador for Antarctica’.
Expectations and experiences of divers and non-divers
An exploration of the differences in expectations, experiences and recollections between divers and non-divers results in the following observations (see Table 4 for details). Non-divers ranked the ‘quality of service and amenities’ while travelling as more important compared to divers. The interviewees suggested that divers might have their own expectations regarding the number of dives and the quality of the underwater experience (I1; I3; I4). It was also suggested that the diving passengers might be more used to travelling in extreme and remote locations than their non-diving fellow passengers (I1; I2; I4). Differences are also observed in the features that divers and non-divers wanted to experience during the trip. Non-divers found it important to ‘experience the fragility of the ecosystem’ and wanted ‘to see historical remains’. Divers on the other hand, as one of the interviewees noted, might feel fragile themselves in the marine ecosystem, being in the presence of agile penguins and impressive leopard seals (I4). During the diving there might not have been the same level of attention for the fragility of the ecosystem as during land visits (I4). The non-divers had higher expectations regarding the ‘weather conditions’ than the divers. At the start, non-divers also had higher expectations of the ‘experience quality’ and the ‘overall quality’ of the trip, compared to the divers.
Cross-tabulation between response categories and diving and non-diving passengers

During the experience, the divers felt much more ‘seen and appreciated by the guides’, than the non-diving passengers. Also, the divers felt that they were well ‘able to use their skills’, compared to a much lower percentage of the non-divers. The ‘quality of information given by the guides’ was considered good by 100% of the divers and 70% of the non-divers. All the diving respondents considered the ‘interaction with the guides’ as good; while a lower percentage of the non-divers thought the same way and 20% rated the interaction as bad. The interviewees explained this outcome on the one hand by the characters of the individual guides involved (I1, I2, I4) and on the other hand by the elevated ability of divers to recognise the skills and expertise of the dive master during a more specialised activity (I1; I3; I4). While for most impact areas (for example wildlife, physical environment, heritage, wilderness value) the scores of the two groups did not result in significant differences, this was certainly the case for the way divers and non-divers rated the perceived level of impact on terrestrial flora. The results of the post-experience survey demonstrated remarkably little differences between divers and non-divers. Exception is the rated satisfaction of the weather conditions during the trip, which was considered good by 90% of the divers and 55.6% of the non-divers.
Tourist–wildlife interaction
The interviewees were shown four video fragments that the authors had labelled as potentially controversial. Fragment 1 shows an interaction of divers (recognisable in their dry suits) after their dive on the beach at Whalers Bay with a fur seal. Some of the interviewees considered it an innocent scene and claimed that fur seals on Whalers Bay are more confrontational towards the presence of humans than elsewhere and that the divers did not purposefully lark about with the seal but stood their ground for safety reasons (I1; I2). Others classified the interaction as clearly too intensive. They argued that the divers unwisely risked a nasty fur seal bite and should have moved away from the seal as they were trespassing the seal's territory (I3; I4). Some questioned whether the divers had been informed properly about how to behave around the fur seals on the beach of Whalers Bay to the same extent that regular tourists usually are when landed. It was suggested that the dive master supervising the divers may not have been aware of the local circumstances or the necessity to brief the divers during the landing (I4). All tourists are supposed to receive the same instruction, both on the ship and when making the landing (I1; I2), and seeing to it that this actually happens in more complex operations is a point of attention (I1).
In fragment 4 a diver is closely approaching a leopard seal resting on an ice floe, enticing the seal to come into the water. Nearly all interviewees classified the diver's distance to the seal as too close (I2; I3; I4), except for one interviewee who argued that Zodiac cruisers are probably more disturbing for resting leopard seals than divers or snorkelers (I1). It is stated that the encounter does not seem to have a major impact, and that research is needed, to understand the behaviour of leopard seals in interaction with humans (I1). For some of the interviewees it was a reassurance that the guide intervened and seemed to know and closely watched the behaviour of the seal (I3; I4). However, admittedly searching for the point at which the resting seal is disturbed goes too far (I2; I3; I4), especially in the context of growing and accumulating tourist activities (I4). It is also suggested that similar disturbance frequently occurs from Zodiacs bumped against or driven too closely to ice floes with resting seals (I1; I2; I4).
Tourist–guide interaction
In fragment 2, a guide firmly explains to a group of tourists, on arrival at Cuverville Island, how to disembark the Zodiac in a safe and organised manner. All the interviewees agreed that the communication style of the guide is too authoritarian, but they also agreed that being firm is sometimes needed to ensure the safety of passenger and wildlife. Before the arrival of the Zodiac, however, an earlier load of tourists was waiting unguided around the landing area for the guide to return. The interviewees claimed that leaving a group of tourists unguided at a site is against the operational guidelines (I1; I2; I4), not necessary (I1; I2), and not desirable in case of an incident. Two of the interviewees argued that the situation in fragment 2 might be explained by the complexity of operations on a multi-purpose trip where attention has to be divided over multiple activities (I4) and fewer guides are available for a relatively large group of non-diving tourists (I2).
Fragment 3 presents a situation in which two divers are exploring a remote part of Petermann Island, an unguided action for which they received permission from the expedition leader. Deliberately stimulating tourists to explore parts of the island without a guide concerned some of the interviewees for issues of safety and the protected areas that may unconsciously have been crossed (I2; I4). In reaction to both fragments the tour operator assures the authors that multi-purpose tourist expeditions should neither proceed at the failure of meeting operational guidelines, nor on the loss of experience quality of any of the tourist groups.
Changing use of sites
Several of the video fragments present a changing use of sites due to the availability of diving technology. All the interviewees are surprised by fragment 3, in which two divers wearing dry suits are walking into and swimming in a remote inlet at a landing site. The question whether this scene is problematic yielded a more diverse response. One of the interviewees argued that human activities in between land and water can disturb wildlife that make use of these zones for getting into and out of the water (I2). It is also suggested that wildlife could be threatened by the swimming divers and consider them to be predators (I3). Another interviewee did not classify the scene as necessarily good or bad but found it interesting that divers apparently demonstrated different behaviour than regular tourists when landed at that site (I4). Finally, it is claimed that swimming in this particular place is not harmful and actually an enrichment of the visitor experience at many sites (I1). It is further claimed that the concerns are mostly based on the fact that people are not aware of these activities, instead of substantive evidence of negative impact (I1). The interviewees do agree that currently operational and site guidelines do not take into account the amphibian use of sites presented in fragment 3 (I1; I2; I4), which could have consequences for vulnerable nesting areas that were considered inaccessible because of water (I4).
Discussion and conclusion
Tourist numbers in Antarctica have grown substantially in the last few decades. Besides increasing visitor intensity, diversification is recently seen by many authors as a key trend in the development of Antarctic tourism (for example Bastmeijer and Roura Reference Bastmeijer and Roura2004; Lamers and others Reference Lamers, Haase and Amelung2008; Liggett and others Reference Liggett, McIntosh, Thompson, Gilbert and Storey2011; Molenaar Reference Molenaar2005). The diversification of activities reflects the increasing levels of specialisation and competition among tour operators in offering quality nature based and adventure experiences (Lamers and others Reference Lamers, Haase and Amelung2008; Page Reference Page2003; WTO 2001), as well as the shift towards experiential travel. The case study of a diving expedition cruise presented in this paper shows how its diversification sets it at variance from standard expedition cruises, in terms of passenger profiles, attitudes and experiences, behaviour, impact areas and management.
The general profile of the passenger group on the diving expedition cruise is younger, more adventurous, more unusual in terms of origin, and less inclined to be involved in the protection of Antarctica than those participating in earlier visitor surveys (for example Bauer Reference Bauer2001; Davis Reference Davis1995; Maher and others Reference Maher, Johnston, Dawson and Noakes2010; Powell and others Reference Powell, Kellert and Ham2008). This unusual profile can to a large extent be explained by the specialised and active purpose of the trip. The increasingly younger profile of Antarctic tourists has recently been noted elsewhere in the literature (Maher Reference Maher2010).
The untypical profile of the passenger group presents an interesting case for exploring diverging experiences and possibly future management challenges. The divers on board the ship appeared to have different needs and wants while travelling than the non-divers, especially with regard to the quality of service and amenities, the expected conditions (for example weather conditions), and the desired experiences (for example seeing historical remains). In general, needs and expectations of these variables appeared to be higher for non-divers. The non-divers showed remarkably lower-levels of satisfaction regarding the guides than the divers. The authors observed that some of the non-divers regarded the communication style of the guide during several incidences as offensive, which was confirmed by the interviewees in response to fragment 2. Being more experienced in adventure activities, divers are more used to being dependent on, recognising the expertise, and accepting the authority of the dive-master. The diverging needs, expectations and experiences between tourists of different activity types is believed to be not exclusive to diving expedition cruises, but generally arises during multi-purpose trips (I2; I3). Recent research results have demonstrated large differences in the communicative and operational styles of polar tourism guides (Roura Reference Roura2009). Additional research would be required to see if groups undertaking different activities demonstrate a preference for particular guiding styles and qualities.
Differences in clothing and gear (dry suits, snorkels), focus (marine environment), activity patterns (diving and afterwards landing) and possibly instructions contributed to diverging behaviour of divers when compared to regular expedition cruise passengers. By means of the video fragments these differences in behaviour were associated by the interviewees with varying levels of tourist satisfaction and wildlife disturbance, and the expanding use of sites. On the desirability of these effects the views of the interviewees widely differ. Responses to the interaction between the divers and the seal in fragment 1 leads to questions of who is approaching who, and what constitutes appropriate tourist interaction with wildlife at frequently visited sites? Responses to the scene of the swimming tourists in the remote inlet at Petermann Island (fragment 3) leads to the question whether the extended amphibian use (between land and water) of visitor sites entails negative impacts or is simply unknown by the interviewees? Responses to fragment 4 leads to questions of whether we should allow tourist-wildlife encounters to be pushed beyond the point that the animal experiences stress, and whether we currently fully understand the behaviour of leopard seals in interaction with humans? In answering these questions some of the interviewees emphasised the experiential opportunities of diving and snorkelling (I1), with a number of side effects that will have to be brought under control (I2). Others took a more precautionary stance and pointed to the spontaneous and unplanned occurrence of these activities (I3) and the cumulative nature of the effects (I4). To fully answer these questions further research and monitoring efforts are needed.
The interview responses do make clear that despite the visitor guidelines of the Antarctic Treaty System and IAATO, interpretations of tourist and animal behaviour and ways of proper enforcement range widely among highly experienced experts. We do know that the present collection of site guidelines have been drafted mainly with a terrestrial user in mind and did not consider swimming and snorkelling (with the exception of Whalers Bay on Deception Island). Given the growth of diving activities and the plans of tour operators to further develop snorkelling (I1), a reassessment of these guidelines might be timely.
Apart from the differences, a range of variables (counter-intuitively) did not generate significant differences between divers and non-divers in the survey results, such as the expected and experienced excitement levels, the perceived peak experiences, and the levels of physical effort. The commonalities could be explained by the fact that a reasonable number of the diving passengers were accompanied by a non-diving spouse or family member. The results also demonstrated a remarkable absence of notable differences during the recollection phase (post-experience). Nearly two weeks of intense contact of the passengers and the expedition staff on board of a small ship might provide an explanation for this tendency.
The current analysis clearly presents a number of limitations that make it unsuitable for drawing strong conclusions or policy recommendations. The most obvious limitation is the small sample of respondents collected on a single Antarctic cruise. Increasing the sample size by collecting passenger surveys on a wide range of Antarctic (and possibly Arctic) trips is continuing. However, the combination of this visitor survey with other research methods, such as participatory observations and film elicitation interviews, and triangulation of the outcomes has resulted in a first in-depth case study analysis of a diving expedition cruise.
Recreational diving in Antarctica is generally conducted in a responsible and professional way (Trotter Reference Trotter2008; I1; I2; I4). The differences in expectations and experiences between divers and regular tourists found in the survey results, and examples of unusual behaviour found in the film-elicitation interviews, suggest that careful attention for proper and consistent enforcement of visitor guidelines seems a prerequisite for multi-activity (or otherwise diversified) expeditions. The results of this study indicate that diverse activities generate a broader variance in attitudes and behaviour that may have repercussions for wildlife, site use and onsite management. Maintaining the quality of guides appears to be an important factor and a key challenge in the face of future diversification. The development of a certification scheme for guides (Honey Reference Honey2002), as now introduced on Svalbard, could direct the way in this respect. Attention for different discourses and levels of awareness among guides and tour operators about guiding ethics (Fennell and Malloy Reference Fennell and Malloy2007), codes of conduct, required competences, and appropriate behaviour associated to different activities form important elements for such a scheme.
Given the growth and diversification trends and the potential implications described in this paper, it seems timely and necessary to explore the implications of diversified Antarctic tourist activities and experiences. Addressing these issues from a scientific perspective is urgent to be able to develop guidelines for tour operators, guides and tourism managers. Growing numbers of tourists and types of tour operators from an increasing number of countries, including the rapidly developing economies of China, India and Brazil (Lamers and Amelung Reference Lamers, Amelung, Saarinen and Tervo2008), may entail additional implications for the quality and consistency of onsite management practices (Snyder Reference Snyder2007). The differences in expectations and experiences between passenger groups of different trips and different operators are probably much greater than in the present study and represent an important area for research and policy.
Acknowledgements
The authors are grateful to the respondents that participated in the survey and the interviews, to the tour operator for providing the opportunity, and to the Netherlands AntArctic Programme (NWO-NAAP grant number 851.20.025) for the financial means to undertake the Antarctic fieldwork. The authors wish to thank John Splettstoesser and an anonymous referee for their constructive comments.