Introduction
The McMurdo Dry Valleys (MDVs) are the largest ice-free region in Antarctica, situated between the relatively warm, maritime McMurdo Sound to the east and the cold, dry East Antarctic Ice Sheet (EAIS) to the west. Though the 3800 km2 ice-free region of the greater MDV (Levy Reference Levy2013) only accounts for c. 2% of the continental area of Antarctica (Drewry Reference Drewry1983), the unique desert ecosystem has been the focus of considerable research, in part because of the extensive biological activity in the soils, rocks, ephemeral streams and glacial melt-lakes (e.g. Fountain et al. Reference Fountain, Lyons, Burkins, Dana, Doran, Lewis, McKnight, Moorhead, Parsons, Priscu, Wall, Wharton and Virginia1999, Cary et al. Reference Cary, McDonald, Barrett and Cowan2010). The climate is cold (mean annual air temperature of -18°C) and dry (<100 mm water equivalent of precipitation per year), with the lack of extensive ice cover attributed to the blocking of ice from the EAIS by the Transantarctic Mountains and a precipitation shadow effect caused by the Royal Society Range just to the south of the MDVs (Monaghan et al. Reference Monaghan, Bromwich, Powers and Manning2005). The little snow that does fall quickly sublimates (Chinn Reference Chinn1981), therefore the hydrology in the MDVs is governed primarily by melting from glaciers and to a lesser extent from snow deposits transported by wind from the valley sidewalls to valley floors (Fountain et al. Reference Fountain, Dana, Lewis, Vaughn and McKnight1998, Steinhoff et al. Reference Steinhoff, Bromwich and Monaghan2012).
The hydrological cycle in the MDVs is defined by ‘hydrological reservoirs’ (or stores of water), which include the atmosphere, glaciers, streams, soils, and debris-covered ice, permafrost and lakes (Gooseff et al. Reference Gooseff, McKnight, Doran, Fountain and Berry Lyons2011). Hydrological systems are typically dominated by the strength and timing of precipitation, which is extremely limited in the MDVs. Therefore, changes in the daily and seasonal surface energy balance (SEB) play a dominant role in controlling water exchanges. For short periods in summer (late November to mid-February) there can be large amounts of water available in the form of lakes, pools and streams, with glacial melt being the primary source. The main loss of water from the MDVs is through sublimation and/or evaporation since most valleys are closed basins, with the rates of loss controlled by variability in the SEB (Fountain et al. Reference Fountain, Lyons, Burkins, Dana, Doran, Lewis, McKnight, Moorhead, Parsons, Priscu, Wall, Wharton and Virginia1999). The focus of SEB studies in the MDVs has been on determining the relative contribution of melting, sublimation and evaporation to glacier ablation. Though melt is significant during summer it has been demonstrated that sublimation accounts for the majority of mass loss from the glaciers through all seasons (e.g. Hoffman et al. Reference Hoffman, Fountain and Liston2008, Bliss et al. Reference Bliss, Cuffey and Kavanaugh2011). Lewis et al. (Reference Lewis, Fountain and Dana1999) showed that ablation from the vertical sidewalls of the glaciers could be an order of magnitude greater than the horizontal surfaces. By comparison, energy and mass fluxes from moist MDV soils and sediments are significantly less well observed. To fully understand the controls on the spatial and temporal variability in MDV hydrology it is important to characterize the SEB over the range of surface types that characterize the landscape of the MDVs.
An important control on the SEB in the MDVs is the variability in the local wind regime (e.g. McKendry & Lewthwaite Reference McKendry and Lewthwaite1990, Reference McKendry and Lewthwaite1992, Nylen et al. Reference Nylen, Fountain and Doran2004), which is summarized by Steinhoff et al. (Reference Steinhoff, Bromwich and Monaghan2012). During periods with weak synoptic pressure gradients in summer, a diurnal wind regime exists which produces easterly winds during daytime that are believed to be thermodynamically forced sea breezes (Bull 1996, McKendry & Lewthwaite Reference McKendry and Lewthwaite1992). The contrast in surface types between the MDVs (bare ground) and McMurdo Sound (water or sea ice) leads to differential heating that supports the initiation of the sea breeze circulation, which weakens at night when the sun angle is lower, leading to light westerlies (Steinhoff et al. Reference Steinhoff, Bromwich and Monaghan2012). In contrast, the sea breeze circulation is non-existent during winter and winds are generally light, with a localized katabatic component that flows down valley slopes (Nylen et al. Reference Nylen, Fountain and Doran2004). The occurrence of strong, gusty föhn-like westerly winds that can occur on timescales of a few hours to a week are important during the summer melt. The physical processes controlling the strong wind events has been a subject of debate in the literature, as described by Steinhoff et al. (Reference Steinhoff, Bromwich and Monaghan2012), but are characterized by warming (up to 50°C during winter) and drying (relative humidity decreases to less than 10%). Though the events are stronger and more common in winter, their occurrence in summer is important as they can lead to above freezing air temperatures, resulting in significant melt and enhanced biological activity. Thus, an understanding of the effect of variability in the wind regime on the SEB, in particular how it controls the rates of melt, sublimation and evaporation, is critical to fully characterize the microclimate of the MDVs.
The microclimate of surfaces of the MDVs is an important driver in the production of shallow desert soils with a significant biological component (Campbell et al. Reference Campbell, MacCulloch and Campbell1997, Doran et al. Reference Doran, Priscu, Lyons, Walsh, Fountain, McKnight, Moorhead, Virginia, Wall, Clow, Fritsen, McKay and Parsons2002a, Reference Doran, McKay, Fountain, Nylen, McKnight, Jaros and Barrett2008, Cary et al. Reference Cary, McDonald, Barrett and Cowan2010). Biological activity has been shown to respond rapidly to changes in surface climate in the MDVs, with a reduction of soil invertebrates (>10% per year) linked with observed cooling (0.7°C per decade) between 1986 and 2000 in the MDVs (Doran et al. Reference Doran, Priscu, Lyons, Walsh, Fountain, McKnight, Moorhead, Virginia, Wall, Clow, Fritsen, McKay and Parsons2002a). In addition, the seasonal melting and freezing of water acts like a binary switch in the MDVs, effectively turning biological activity on and off (Kennedy Reference Kennedy1993, Fountain et al. Reference Fountain, Lyons, Burkins, Dana, Doran, Lewis, McKnight, Moorhead, Parsons, Priscu, Wall, Wharton and Virginia1999, Stichbury et al. Reference Stichbury, Brabyn, Green and Cary2011). Although fairly unique on Earth, the surfaces of the MDVs have received increasing attention from wide ranging disciplines due to close analogues with the surface environmental conditions on Mars (Marchant & Head Reference Marchant and Head2007, Levy et al. Reference Levy, Head, Marchant, Dickson and Morgan2009, Cary et al. Reference Cary, McDonald, Barrett and Cowan2010). Improved understanding of the microclimate of these surfaces, therefore, has implications for characterizing mass-budgets of ice-cored sediment, production of sublimation till, and soil development in cold and hyper-arid environments elsewhere.
To improve understanding of the atmospheric controls on sublimation and evaporation in the MDVs this research article presents observations of the SEB and mass fluxes over debris-covered ice in the Taylor Valley, Antarctica, during early summer (13 November to 9 December 1999). This early summer period captured the onset of the seasonal melting of ice in the moraines and outwash fan at the glacier terminus, which enables comparison between microclimate and mass flux changes associated with this hydrological switch. In addition, the variability in the amount of moisture that is lost to the atmosphere under different wind regimes is explored and estimates of melt (which was not directly measured) from the SEB are provided.
Physical setting
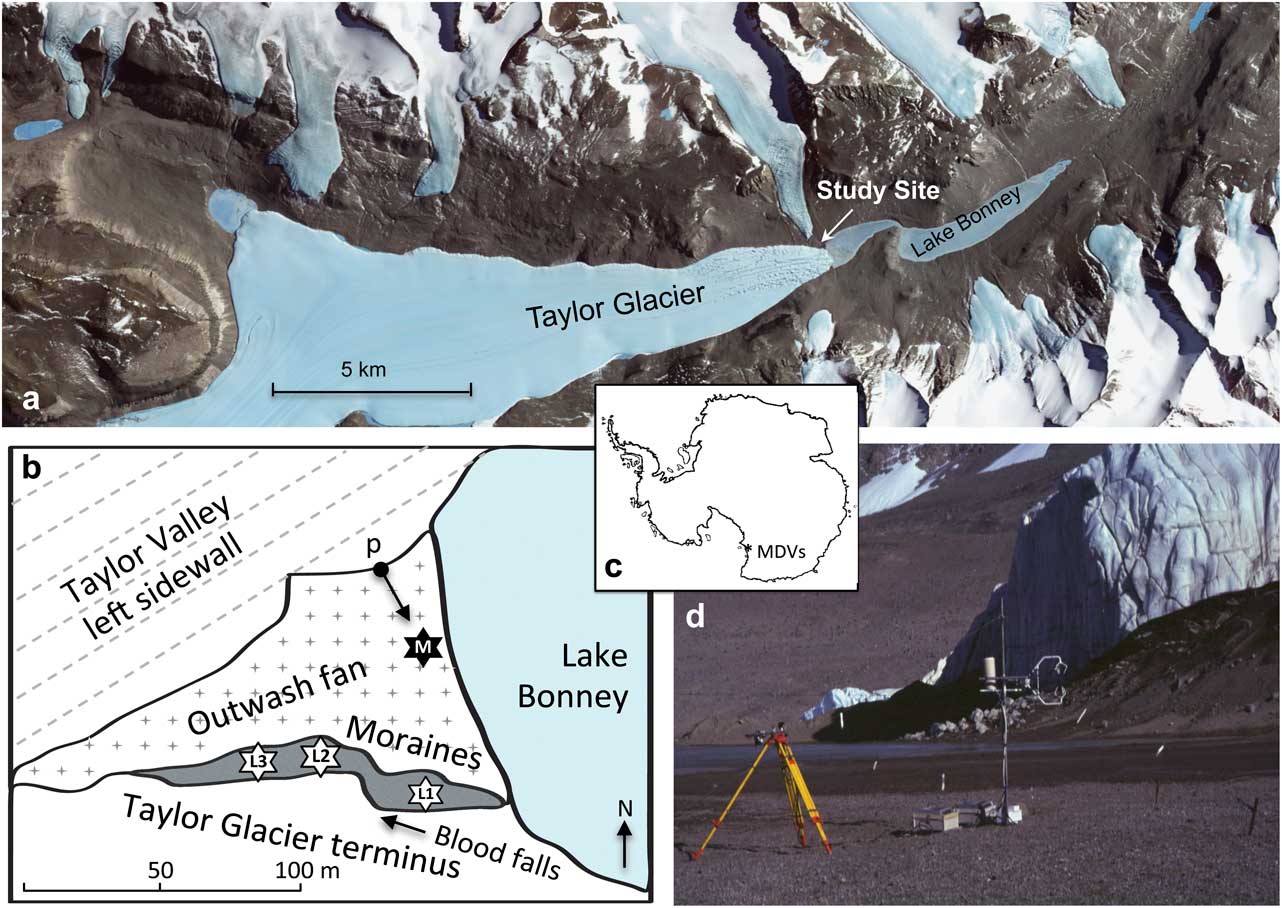
The measurements for this study were undertaken near the Taylor Glacier terminus on the Taylor Valley floor (Fig. 1). Instruments were deployed on terminal moraines and an outwash fan between 13 November and 9 December 1999. The moraines were comprised of varying debris–ice mixes and stood c. 10 m tall in front of the 30 m near-vertical walls of the Taylor Glacier terminus. The adjacent outwash fan was produced by ephemeral streams, which develop along the side of the glacier. On arrival at the study site on 11 November, the entire fan was ice-cemented, although melt began at the surface soon after. By the end of November the substrate was melted to a depth of 0.1 m during the day and 0.2 m by the end of the observational period (9 December). Volumetric water content (VWC) of the outwash fan debris on arrival was c. 5% in the 0–0.05 m layer and 20% in the 0.05–0.1 m layer. Once melt was widespread, the 0–0.05 m layer water content increased to c. 15%.
Study site overview. a. Visible satellite image of Taylor Valley, Antarctica (Landsat 7, 18 December 1999, courtesy of NASA). b. Map of study area showing major topographical features and measurement sites; M shows the meteorological observation site, L1–3 refer to three weighing lysimeters deployed in the moraines, and p shows the location and orientation of the photograph in d. c. Map of Antarctica showing location of McMurdo Dry Valleys (MDVs). d. Photograph of the Taylor Glacier terminus area and micrometeorological instrumentation on the outwash fan (Oliphant).
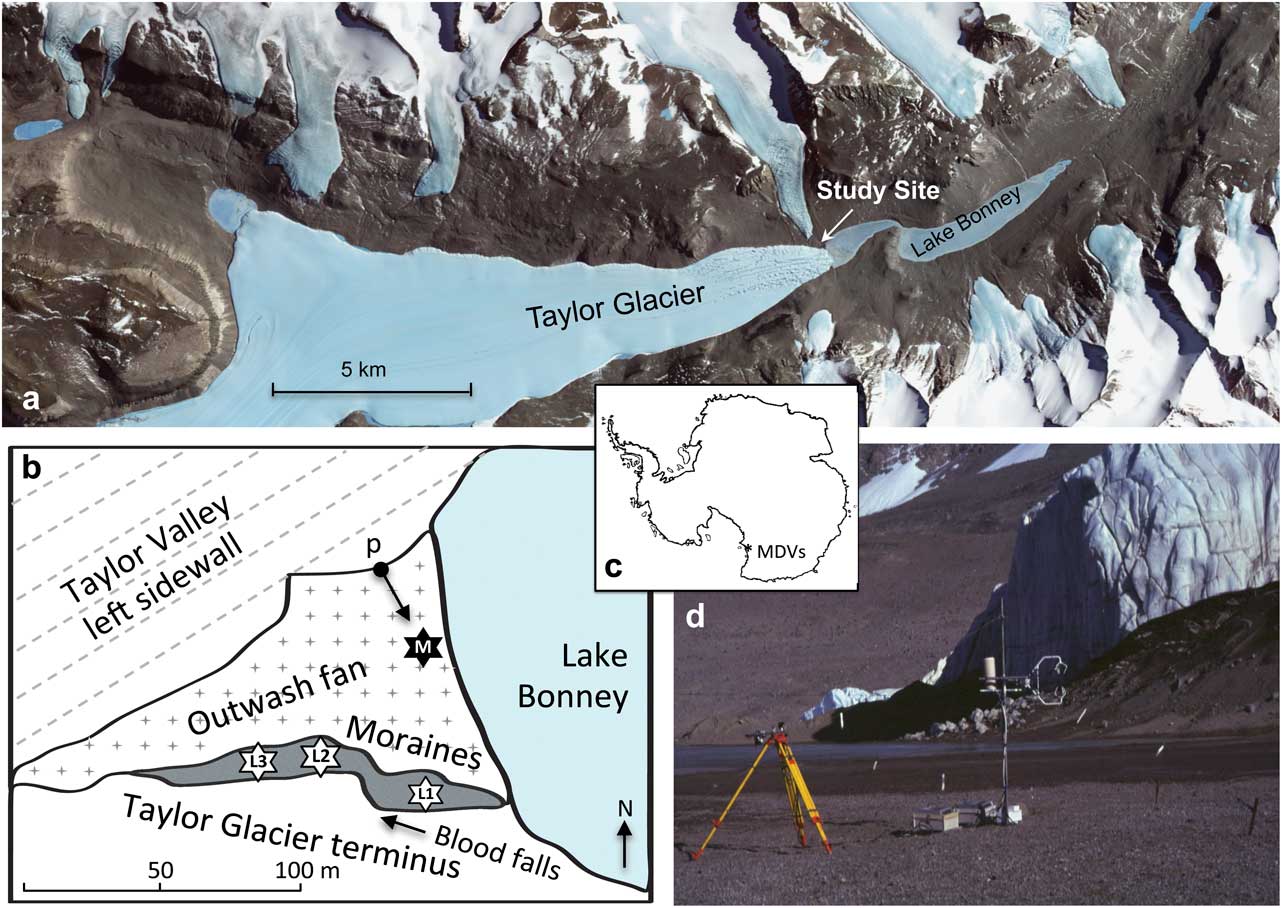
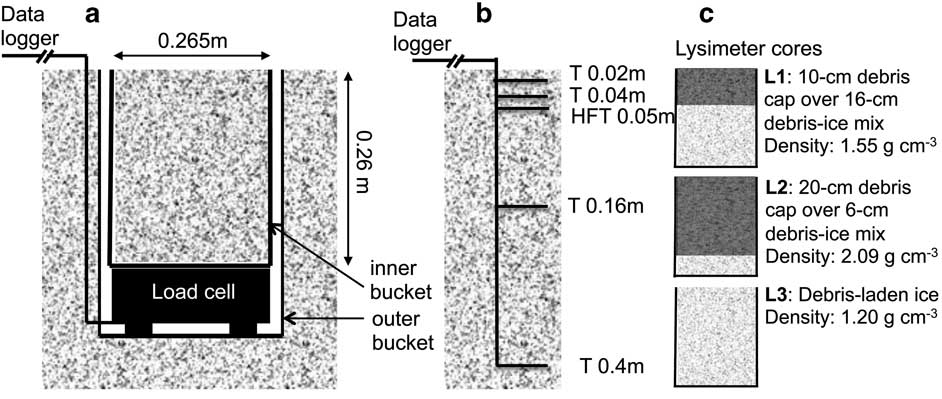
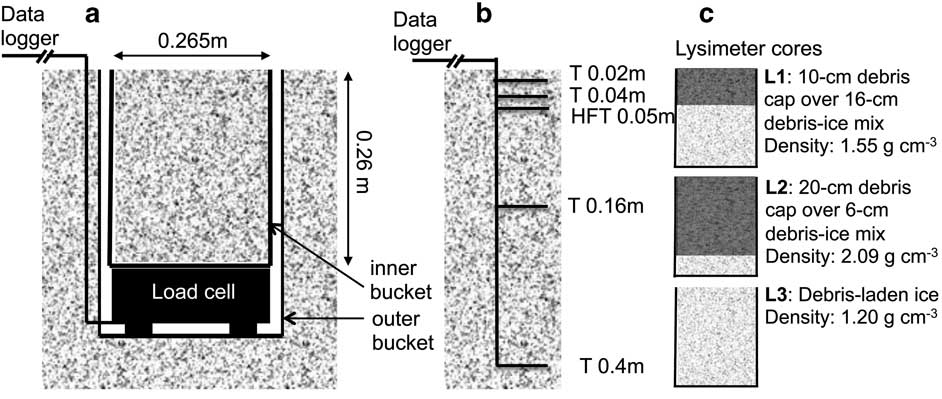
The photograph in Fig. 1d looks across the outwash fan to the moraines, with the Taylor Glacier terminus located behind these. The outwash fan drains into Lake Bonney, a glacial lake at the foot of Taylor Glacier (Fig. 1a & b), which is frozen to a depth of c. 4 m year-round, except at the margins in summer (Gooseff et al. Reference Gooseff, Barrett, Northcott, Bate, Hill, Zeglin, Bobb and Takacs-Vesbach2008). The fan presented a nearly flat and homogeneous surface, c. 180 m long in the orientation of the valley and 80 m at its widest point. It was bounded to the west and south by terminal moraines and the Taylor Glacier terminus, to the north by the sloping sidewall of Taylor Valley, and to the east by Lake Bonney (Fig. 1). The fan itself was made up of coarse sand to gravel clasts with individual surface roughness elements of c. 0.005–0.01 m. The outwash fan was used to site radiation and eddy covariance instruments as well as ground temperature and heat flux sensors. Three weighing lysimeters and additional ground sensors were deployed in the adjacent terminal moraines (Fig. 1b). The lysimeter pits were all located on the ridge of the terminal moraines within 10 m of the glacier sidewall. Two were made up of debris-laden ice capped by a layer of coarse sand to pebble clasts of 0.1 and 0.2 m depths. The third was comprised of debris-laden ice with no debris cap (Fig. 2).
Experimental design of a. weighing lysimeter deployment, b. ground temperature and heat flux measurements and c. the physical make-up of the three different cores measured by lysimeters.
Climate statistics from a long-term meteorological station located c. 2 km down-valley on the shores of Lake Bonney, show annual average air and soil temperatures of -17°C (Doran et al. Reference Doran, McKay, Clow, Dana, Fountain, Nylen and Lyons2002b). They also show strong seasonal variability with maximum air and soil temperatures (at 0.1 m depth) reaching 9°C and 16°C, respectively. Doran et al. (Reference Doran, McKay, Clow, Dana, Fountain, Nylen and Lyons2002b) estimated an annual average of 34.3 degree days above freezing for this site, slightly higher than the average for seven instrumented sites in the MDVs. Further description of the unique climate characteristics of the MDVs can be found in Fountain et al. (Reference Fountain, Lyons, Burkins, Dana, Doran, Lewis, McKnight, Moorhead, Parsons, Priscu, Wall, Wharton and Virginia1999).
Methods and materials
Assuming no advection of heat and no precipitation, the SEB of debris-laden ice surfaces can be expressed as:
 $$Q{\asterisk}=Q_{H} {\plus}Q_{E} {\plus}Q_{G} {\plus}Q_{M} ,$$
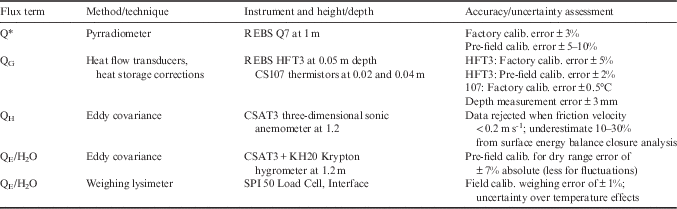
where the net radiative flux (Q*) is balanced by convective transport between the surface and atmosphere of sensible (Q H ) and latent (Q E ) heat fluxes, conduction between the surface and the underlying debris-ice substrate (Q G ) or phase change of ice within the debris (Q M ). The sign convention used here is flux terms are positive when directed toward the surface and negative when directed away from the surface, either upward through the atmospheric surface layer or downward into the substrate. When the substrate is frozen, Q M is zero and the magnitude of Q E is governed by sublimation only. However, when substrate temperatures reach melting point, Q M becomes positive and energy used to evaporate liquid water from the surface is added to the Q E term. In this study, all of the terms in Eq. (1) were measured directly except Q M (Table I). When Q M was positive, the portion of melted water that was evaporated from the surface was included in the measurement of the Q E term. However, since runoff was not measured, the energy that was used to melt water that subsequently flowed downstream represents advection of energy from the debris surfaces to Lake Bonney. This heat flux was unmeasured, although runoff into Lake Bonney via the outwash fan was visually evident mid-way through the study.
Energy and mass flux terms measured, with associated instruments and measurement details including available accuracy information.

Radiation measurements
Radiation instruments were mounted near the down-valley end of the outwash fan at 1 m above the surface. Incoming and outgoing solar radiation (K↓ and K↑, respectively) were measured using two pyranometers oriented in opposite vertical directions (Li-Cor 190SB; LiCor, Lincoln, NE). An Everest 3000a thermal infrared radiometer with a band pass of c. 8–13 μm was directed at the debris surface to measure upwelling longwave radiation (L↑). Net allwave radiation (Q*) was determined by a level pyrradiometer (Q7; REBS, Seattle, WA) and incoming longwave radiation (L↓) was determined from the radiation budget residual (L↓=Q* - (K↓ - K↑)+L↑). The surface in the vicinity of the instruments was flat and homogeneous; access to the entire area was prevented since footprints made a significant change to the surface microtopography. The sediments were well mixed and there was little horizontal variation in colour. A second pyrradiometer was mounted at 1 m height over a debris-covered surface on the terminal moraine.
Eddy covariance measurements
The eddy covariance instruments were located on the outwash fan near the radiation instruments (Fig. 1). The instruments were mounted at 1.2 m on a guyed pole. Because of the small size of the fan, eddy covariance instruments were deployed at the down-valley end of the fan c. 10 m from Lake Bonney (Fig. 1b). This site was the only location that satisfied uniform fetch requirements for this technique. The upwind area that would have contributed to the flux measurement was approximated using the Flux Source Area Model (FSAM; Schmid Reference Schmid1994). For an aerodynamic roughness length (z0) of 0.001 m and under neutral atmospheric stability, 90% of the flux was estimated to be sourced from within 47 m of the instruments in the upwind direction. Even for a more conservative z0 of 0.0005 m and under stable conditions (Obhukov length of 100 m), the outer boundary of the 90% effective flux footprint was from within 134 m. Since the wind direction was very consistent at this site due to valley channelling, the width of the 90% footprint was only 20 m. Therefore, the measurements made by the eddy covariance instruments were probably representative of the fan surface when the wind was blowing in the down-valley direction (31% of the 20-minute observation periods). For the remaining hours, the eddy covariance measured energy balance terms were not used in this analysis. The instruments and guys were oriented in a way to give the instruments uninterrupted exposure in the up-valley direction.
Three-dimensional winds, and both sonic and thermocouple temperature, were measured using a CSAT3 sonic anemometer and water vapour density was measured using a KH20 krypton hygrometer (Campbell Scientific, Logan, UT). Instruments were sampled simultaneously at 10 Hz with 20-minute bulk covariance blocks stored. Sensible (Q H ) and latent (Q E ) heat fluxes were calculated from the covariance of fluctuations of vertical velocity (w′) with fluctuations of air temperature (T′) and water vapour density (ρ v ′), respectively:
 $$Q_{H} =C_{a} \overline{{w'T'}} ,$$
 $$Q_{E} =L_{{v/s}} \overline{{w'p_{v} '}} ,$$
where C
a
is specific heat of air, L
v
latent heat of vaporization used when surface temperatures were above freezing and L
s
is latent heat of sublimation used when temperatures were below zero. Fluctuations in 10 Hz variables denoted by the prime were calculated as departures from the 20-minute mean, e.g.
 $$T'=T{\minus}\bar{T}$$
Burns et al. (Reference Burns, Horst, Jacobsen, Blanken and Monson2012) warned that Q
H
can be overestimated using temperature derived from the sonic anemometer in high wind speeds. However, differences between sensible heat fluxes derived using temperature from the sonic anemometer and thermocouple temperatures in this case were negligible throughout the period. Latent heat fluxes were corrected for oxygen effects for the krypton hygrometer and density fluctuations using WPL corrections (Lee et al.
Reference Lee, Massman and Law2004).
Ground heat flux, temperature and moisture content
Soil thermistors (CS107; Campbell Scientific) were inserted at depths of 0.02, 0.04, 0.16 and 0.4 m, and two heat flux plates (HFT; REBS) were inserted at 0.05 m (Fig. 2b, Table I). The sensors were inserted into holes drilled horizontally into the sidewall of a pit, excavated using a diamond tipped chainsaw. This design was repeated at three locations; the outwash fan near the eddy covariance station and in two of the lysimeter pits in the moraines, comprised of ice that was capped by 0.1- and 0.2-m layers of debris, respectively (Figs 1b & 2). Debris samples from 0–0.05 m and 0.05–0.1 m on both the outwash fan and the moraines were collected in 0.000176 m3 soil tins at six regular intervals during the observation period (approximately every five days). Laboratory analyses included determining the weight of the undisturbed sample (W E ), the sample after drying for 24 hours (W D ) and the sample after gradually saturating the tin with liquid water (W S ) using a drip feeder. The VWC (m3 m-3) was derived from [W E -W D ]/v ×ρ w , where v is the volume of the sample tins and ρ w is the density of liquid water (1000 kg m-3). Dry bulk density (ρ b , kg m-3) was derived from W D /v and porosity (δ, m3 m-3) was derived from, [W S -W D ]/v.
The ground heat flux (Q G ) was calculated from,
 $$Q_{G} =HFT_{{(Z)}} {\plus}C_{v} {{\Delta T_{S} } \over {\Delta t}}z,$$
where HFT is the measured soil heat flux at 0.05 m depth (z), ΔT s is the change in average temperature (K) of two thermistors inserted above the heat flux plates (at 0.02 and 0.04 m) over each period (in this case, Δt=1200 seconds). The volumetric heat capacity (J m-3 K-1) of the substrate (Cv) was determined from,
 $$C_{v} =p_{b} c_{d} {\plus}\phi _{a} C_{a} {\plus}\phi _{W} C_{W} {\plus}\phi _{i} C_{i} ,$$
where, c d is specific heat of dry mineral sediment, ϕ is the specific volume (m3 m-3) and C is the heat capacity of air ( a ), liquid water ( w ) and ice ( i ) in the substrate. The ϕ a was determined from δ-ϕ w , and ϕ i was determined from [W E -W D ]/v ×ρ i , where ρ i is the density of ice. Heat capacities used included 0.0012 MJ m-3 K-1 for cold dry air, 4.19 MJ m-3 K-1 for liquid water and 1.85 MJ m-3 K-1 for ice and the specific heat of dry mineral sediment used was 839 J kg-1 K-1.
Weighing lysimeter measurements
Three weighing lysimeters (SPI 50 Load Cell; Interface, Scottsdale, AZ) were deployed in the terminal moraines (Fig. 1b). The dimensions and measurement design of the lysimeter pits are provided in Fig. 2a. First, cylindrical shaped cores c. 0.3 m diameter and 0.4 m depth were cut using a diamond tipped chainsaw and extracted. Temperature sensors were installed in the sidewalls of two of the lysimeter pits. A heavy duty plastic outer bucket was then inserted into the hole with its rim at ground level. Although the cores remained largely intact, the surrounding surface on one side of each lysimeter pit had to be removed in order to extract the core whole. This was reconstructed once the outer bucket was positioned. The load cell was seated and levelled at the bottom of the outer bucket with the cable running up the outside of the bucket to a data logger on the surface (Fig. 2a). The cores were trimmed to fit into narrower, shorter inner buckets that were placed on the load cell with a removable handle. The cores remained largely intact throughout this process, including the debris-capped cores, probably due to ice cementation within the debris layer. However, some reconstruction of the debris layers was necessary. Once positioned there was no contact between the inner bucket and any surface except the top of the load cell with a gap of 0.003–0.005 m between buckets. In addition, in cross-sectional view the rims of the buckets and the core surface (0.053 m2) were flush with the surrounding surface (Fig. 2a). The cores weighed 15–25 kg with a bulk density ranging between 1.2 and 2.0 g cm-3 for debris-laden ice and 0.2 m debris-covered ice, respectively (Fig. 2c).
Load cells were measured every second and the 20-minute average core mass was calculated. The mass flux of water between the core surface and atmosphere (FH2O - g m-2 hr-1) was then determined from:
 $${\rm F_{H2O}} ={{\Delta W_{c} } \over {A_{c} }}\Delta t,$$
where ΔW c is the change in mass between averaging periods (g), A c is the cross-sectional area of the core surface and Δt is the time between averaging periods, in this case 1200 seconds. The load cell uses strain gauges with internal temperature compensation for the range -10–45°C and have an initial factory accuracy rating of +/- 0.07%. In-field calibrations were made twice during the field period using known weights. Analysis showed the error to be mostly systematic with a maximum of 0.3%, and corrections were applied using coefficients derived from these in-field calibrations.
From the mass fluxes, a latent heat flux term was determined by Q E =F H20 /L s . The latent heat of sublimation (L s ) was used since all mass fluxes have to come through the top of the bucket by either sublimation or melt followed by evaporation and L s =L v +L m . In this way, the complete energy exchange of the mass fluxes was resolved, although any time lag between melt and evaporation was unaccounted. Since the air was generally colder than the ground surfaces, convective mixing within the 3–5 mm gaps between the inner and outer buckets of the lysimeter system may have produced a negative lateral conductive heat flux into the sides of the bucket, which would offset some of the conductive heating from the surface. It is unclear how much this might have lowered the mass flux.
Numerical simulation of heat transfer
A simple one-dimensional numerical model was developed to simulate vertical flows of heat and moisture within the sediment of the outwash fan in order to help interpret the sediment temperature and heat flux observations. The model computes the ice-water phase transitions as well as evaporation and sublimation. It can either be forced by variations in the skin temperature, or by variations in the net radiation and sensible heat flux. The model solves the diffusive heat transport equation using pseudo-spectral methods (Fornberg Reference Fornberg1996). The phase transition is represented by an ‘enthalpy method’, where the latent heat of fusion is represented by an increase in the specific heat capacity over a narrow temperature range centred on the melting point of ice.
The sediment was assumed to be saturated, which our observations showed to be almost the case. In both the water-saturated phases and ice-saturated phases, the governing equation is given by
 $$\rho c{{\partial \theta } \over {\partial t}}={\partial \over {\partial z}}\left( {k{{\partial \theta } \over {\partial z}}} \right),$$
where ρ is the bulk density, θ is the temperature, c is the bulk specific heat capacity, z is the vertical position and t is time. Bulk quantities are given by e.g.
 $$c=\varphi c_{w} {\plus}(1{\minus}\varphi )c_{s} $$
in the water-filled area and
 $$c=\varphi c_{i} {\plus}(1{\minus}\varphi )c_{s} $$
in the frozen zone; subscripts w, i and s refer to water, ice and sediment, respectively. Around the freezing point, bulk specific heat is increased by a quantity
 $L\exp \left( {{\minus}\theta ^{2} /S^{2} } \right)/\left( {\pi ^{{1/2}} S} \right)$
, where L is the latent heat of fusion of water, and S is a scale factor, set here to 0.1°C. This expression has integral over its whole range equal to the latent heat of fusion. The smaller S is, the smaller the range over which the specific heat is; this has to be traded off against numerical stability. The value chosen is smaller than the typical diurnal temperature ranges considered. For the current simulations, the substrate was represented by sand-sized debris with 20% porosity. The principal forcing was a sinusoidal variation in the net heat flux at the upper surface. This was tuned to the observations and averaged 25 W m-2 with a diurnal amplitude of 200 W m-2. The lower boundary of the model was 15.35 m, well below the level of heat penetration over the time frame, and this boundary was forced by the geothermal heat flux. The model solved 115 vertical levels between the surface and the lower boundary, with much higher resolution nearer the surface (ranging from 31 levels in the upper 0.1 m to 11 levels in the lowest 10 m). The initial temperature was -30°C and the model was forced diurnally for a computational period of 75 days, covering the onset of the melt period as observed.
Results
Meteorological conditions
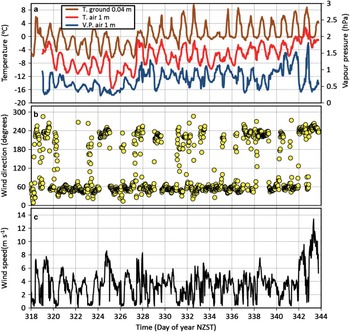
Over the 4-week study period, air temperature at 1.2 m above the outwash fan surface averaged -5.8°C, showed consistent diurnal variability and increased generally, rising to above freezing only briefly once during the study period (Fig. 3a). The dark debris surface (albedo averaged 0.17) coupled with the seasonally high solar radiation produced a strong diurnal signal in ground temperatures at 0.04 m depth, which averaged 0.4°C and ranged from -6.7–9.6°C. For the first week of observations, ground temperatures at this depth were predominantly below freezing (Fig. 3a), with only short periods of above-zero temperatures occurring during the day. However, temperatures then rapidly increased and by the final week, ground temperatures were seldom below freezing at 0.04 m. This was apparent also in the moistening of the outwash fan surface and development of runoff into Lake Bonney.
General meteorological conditions measured on the outwash fan at 20-minute intervals (13 November to 9 December 1999) including a. ground temperature (T) at a depth of 0.04 m, and air temperature and vapour pressure (V.P.) at 1.2 m above the surface, b. wind direction at 1.2 m, and c. wind speed at 1.2 m.

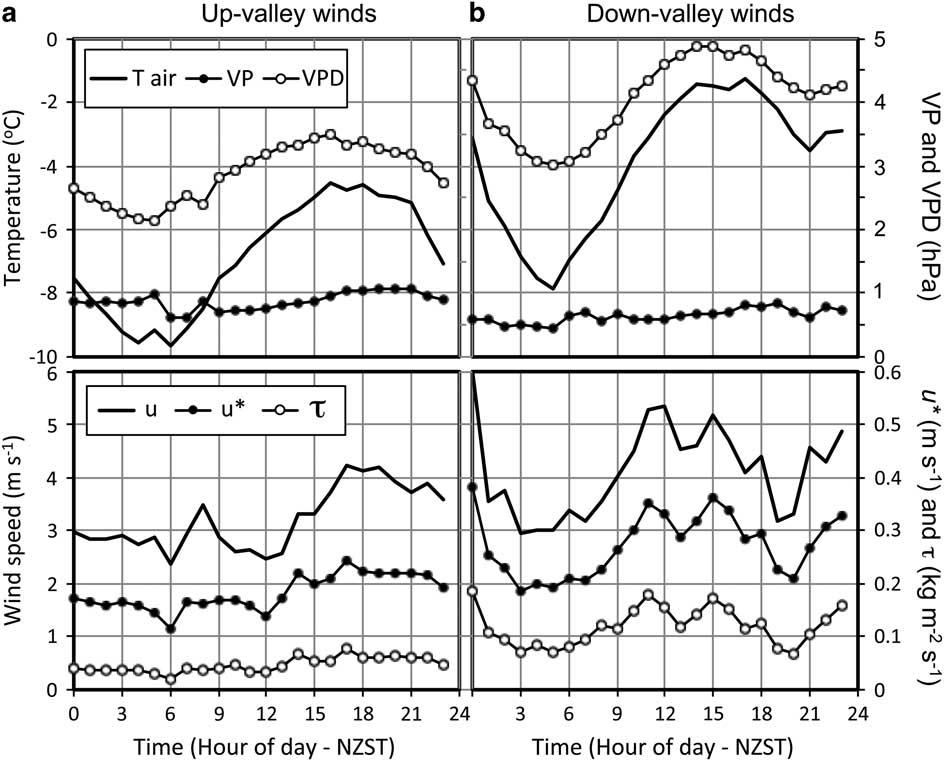
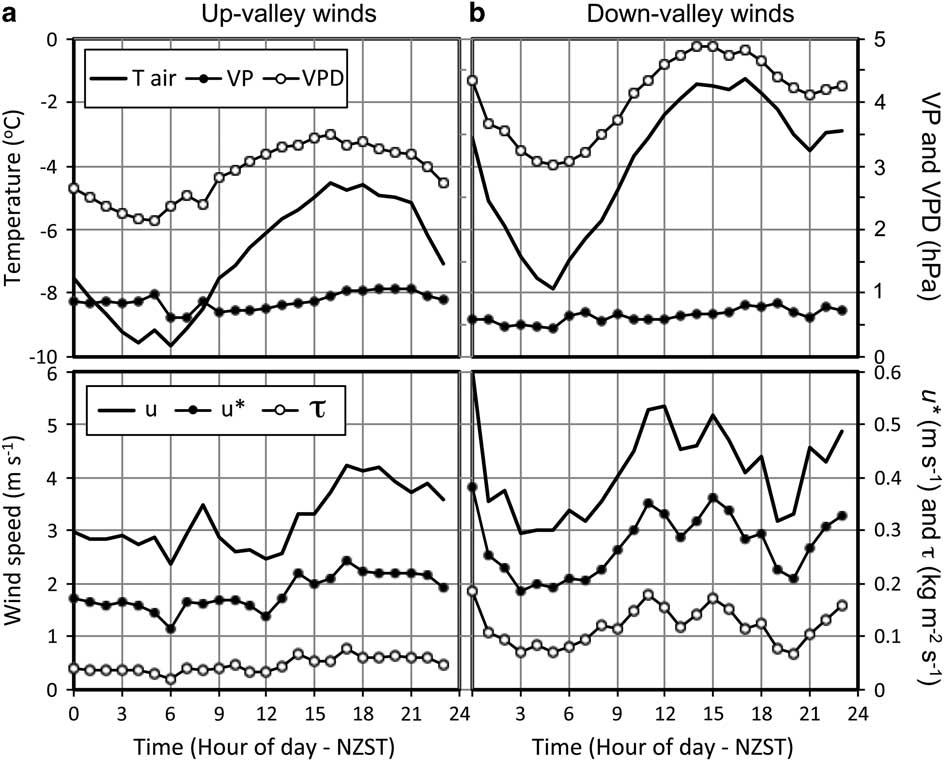
The wind direction was largely bimodal, oriented longitudinally within the deep valley. Weak up-valley north-easterly flows (centred around 60o) deriving from McMurdo Sound occurred c. 62% of the time, were most frequent in later afternoon and early evening, and brought relatively cool, moist air masses (Fig. 3b). Down-valley winds occurred 31% of the time. These appeared to include both a weak nocturnal katabatic flow with cool and dryer air masses as well as much stronger and warmer föhn-like winds, lasting from several hours to days (Fig. 3b & c). Hourly averages of meteorological data filtered by wind direction (up-valley=40–80o and down-valley=220–260o) are presented in Fig. 4. The term ‘diurnal ensemble averages’ is used to refer to these filtered data averages. The sample size in each hour varied due to diurnal variations in the local wind system, as well as over the study period in general. This means that the down-valley average observations are best represented (largest sample size) in the early morning hours, and are least well represented in the later afternoon and early evening hours and the opposite is true for up-valley winds. Down-valley winds were consistently warmer than up-valley winds, with the difference averaging 3°C (Fig. 4). They were also drier with a lower vapour pressure (mean difference=0.25 hPa). Combined with the higher temperatures, down-valley winds had a much higher vapour pressure deficit than up-valley winds (mean difference=1.2 hPa), with a maximum average difference of 1.7 hPa. Wind speed, friction velocity (u*) and momentum flux (τ) were also all much higher under down-valley wind conditions than up-valley (Fig. 4). Combined, down-valley winds produce a significantly higher atmospheric demand for sublimation/evaporation than up-valley winds. There is not a clear physical reason why there is a second diurnal peak on average around midnight in down-valley wind strength, temperature and vapour pressure deficit. It is probably a function of the limited sample size in these diurnal averages and a particular föhn event near the end of the study period that peaked around midnight with almost double the wind speed and friction velocity than other down-valley winds at this time and significantly higher temperature (Fig. 3).
Hourly ensemble average atmospheric characteristics at the surface energy balance site during up- and down-valley wind conditions (13 November to 9 December 1999) where Tair is air temperature, VP is vapour pressure, VPD is vapour pressure deficit, u is wind speed, u* is friction velocity and τ is momentum flux, all measured at 1.2 m above the outwash fan. In total, wind was up-valley (down-valley) for 62% (31%) of 20-minute observations and peaked in frequency between 1700–2200 NZST when up to 80% of hours were up-valley, while down-valley winds were most frequent (50%) during early morning hours (0300–0700 NZST).
Surface energy balance
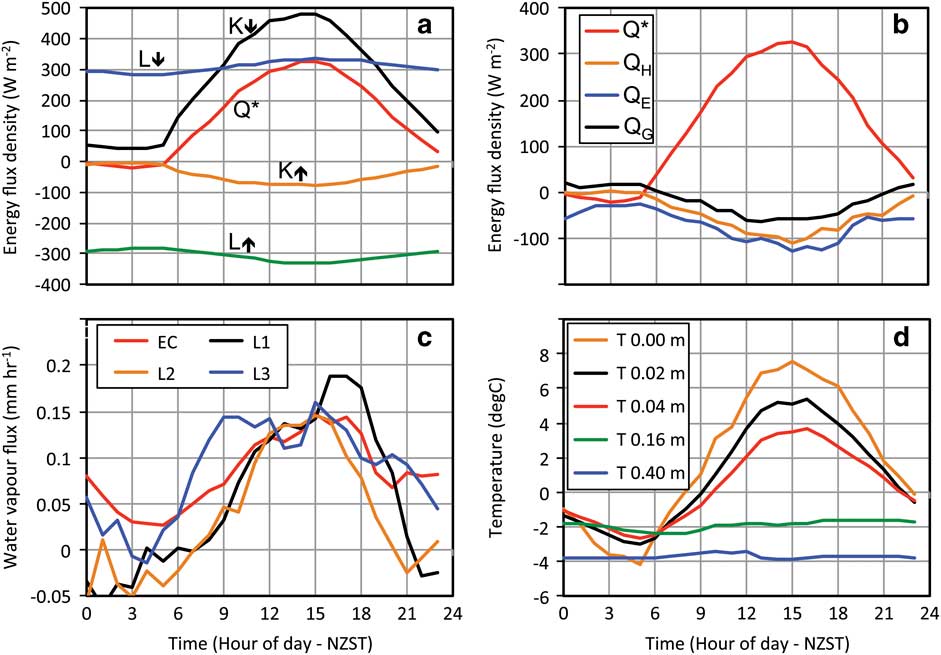
Diurnal ensemble microclimate characteristics measured during down-valley winds over the entire study period are presented in Fig. 5. Incoming solar radiation (K↓) was near its annual maximum and 83% was absorbed at the surface generating a net daily solar uptake (K*) of 19.7 MJ m-2 d-1. Net longwave radiative (L*) loss was consistent but smaller at 6.3 MJ m-2 d-1 and combined with the much larger K* gain, there was a net allwave radiative (Q*) surplus of 13.4 MJ m-2 d-1. The surface radiation budget was most strongly affected by shading from the valley sidewall to the south between 2300 and 0530 NZST, with a minimum of 42 W m-2 recorded by diffuse solar radiation at these low elevation angles. During these local twilight hours L* loss exceeded K* gain to produce a net surface radiative energy deficit for several hours (negative Q*). Therefore, although overall warming occurred during the period, diurnal variability produced both significant radiative heating and cooling of the surface.
Diurnal ensemble averages of a. surface radiation budget fluxes, b. surface energy balance fluxes, c. mass fluxes of water vapour, where EC refers to the eddy covariance estimate and L1–3 are the three lysimeters, and d. ground temperatures at five depths. All data were collected between 13 November and 9 December 1999, although b. and c. use data collected only during down-valley wind conditions.
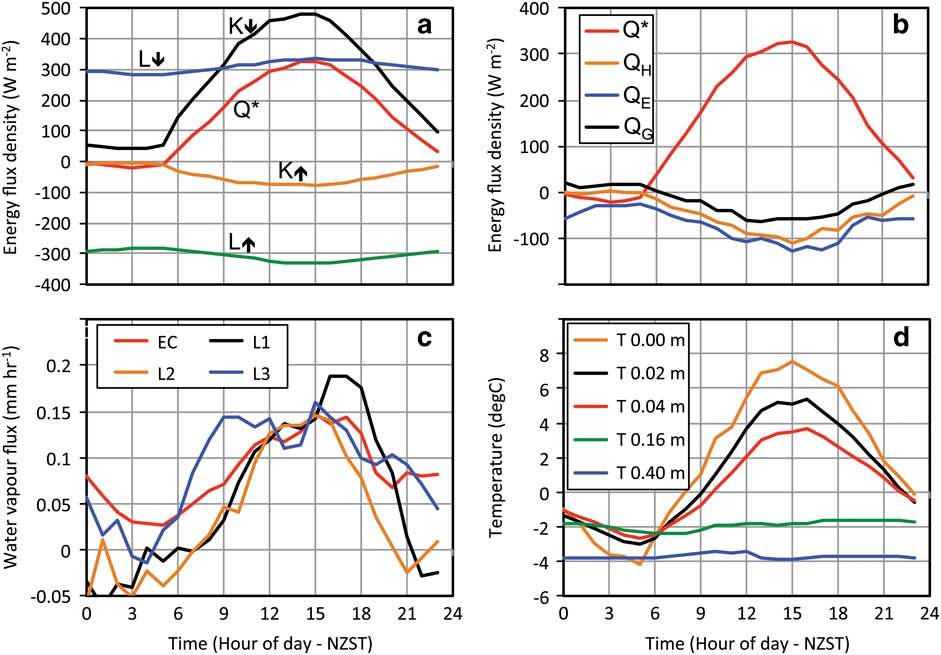
The overall radiative energy surplus was used in atmospheric and ground heating (Q H and Q G , respectively) and a net vaporization of water over the study period (Q E ). The partitioning of Q* between the turbulent heat fluxes measured by eddy covariance favoured Q E with a mean Bowen ratio (β=Q H /Q E ) of 0.78. These two fluxes had similar diurnal patterns, although Q E remained positive at night on average and radiative cooling during local twilight hours was offset by both Q H and Q G . The ratio Q G :Q* averaged 0.12 and was fairly consistent throughout the period (σ=0.03) during both positive and negative phases. This consistency and magnitude is commonly found for bare soils or sand (e.g. Santanello & Friedl Reference Santanello and Friedl2003, Oliphant et al. Reference Oliphant, Zawar-Reza, Azizi, Dehghanpour and Harrison2011) although this value is fairly low, presumably due to the high VWC.
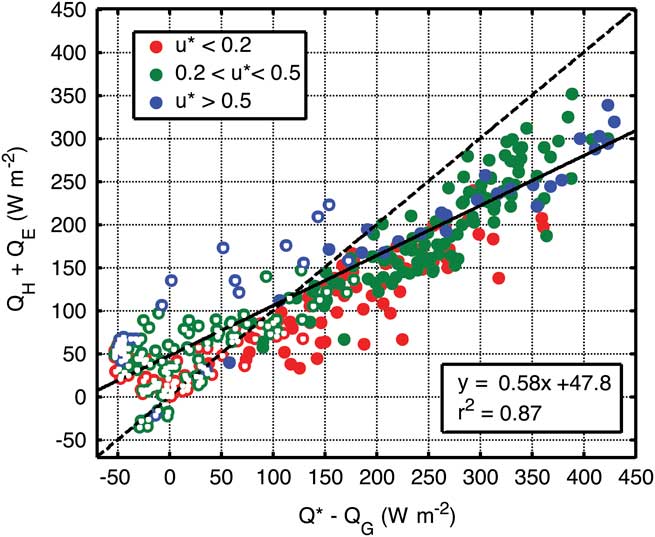
On a daily basis, the residual energy not accounted for by the measured energy terms was c. 20% of Q*. This residual comprises the sum of all measurement errors and any unmeasured energy balance components. It has been shown that the eddy covariance technique can underestimate turbulent heat fluxes due to its inherent inability to resolve all scales of turbulent transport, especially under conditions of weak turbulence (Lee et al. Reference Lee, Massman and Law2004). A simple test of the turbulent flux terms (Q H +Q E ) against the available energy (Q* - Q G ), shows turbulent fluxes to generally track but underestimate available energy in this study (Fig. 6). This underestimation gets larger and less correlated with available energy under weak turbulent conditions and based on this, eddy covariance data under conditions of u* < 0.2 m s-1 were rejected from energy balance estimates presented here. Relatively few data (c. 10%) were rejected due to the quite high u* of down-valley winds (Fig. 4). However, even under moderate to high u*, the turbulent fluxes tended to underestimate available energy except when ground temperatures dropped below freezing and the sum of turbulent fluxes was higher (Fig. 6). This pattern could reflect freezing and melting terms in the SEB. Although, neither of these terms was measured directly, the implications of the sign and magnitude of these residual energy components are discussed in the Discussion.
Assessment of closure from measured energy balance components at the outwash fan site under down-valley winds for three ranges of friction velocity (u*). Periods when surface ground temperature was below freezing are indicated by white dots.

Mass fluxes
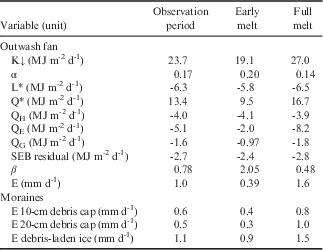
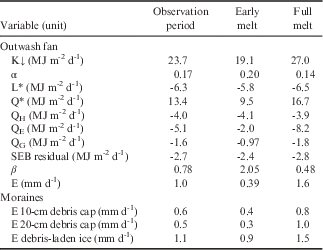
Diurnal ensemble average mass fluxes estimated from the three weighing lysimeters deployed in the moraines and the eddy covariance instruments deployed on the outwash fan are provided in Fig. 5c. The four independent estimates were comparable in magnitude and general diurnal signal; the daily average mass flux from the lysimeters ranged from 0.5 mm d-1 for the 20-cm debris-capped ice surface to 1.1 mm d-1 for the debris-laden ice sample (Table II). The mass losses from the debris-capped ice surfaces were both significantly less than the outwash fan and debris-laden ice surfaces, which were both uniform mixes of debris and ice. Both of the debris-capped ice samples followed diurnal Q* patterns closely and even showed small deposition fluxes when Q* was negative, while the other two sites remained weakly positive at night.
Daily energy and mass flux terms measured at the Taylor Glacier terminus (13 November–9 December 1999) produced from diurnal ensemble averages for all times during down-valley wind conditions. Data are further divided into the early melt period (13–20 November) and full melt period (2–9 December).
Since the lysimeter observations were not limited to down-valley winds, daily mass loss was also estimated for up-valley conditions and compared. All three lysimeters reported higher mass fluxes under down-valley winds (which averaged 0.83 mm d-1) compared with up-valley winds (0.67 mm d-1). A student’s T-test reported this difference to be statistically significant at the 95% confidence level (P=0.0236). Because the eddy covariance estimate only includes down-valley winds, which were more conducive to evaporation and sublimation, the daily average mass flux reported from the outwash fan is probably an overestimate of the all-condition mean for the site.
Response of surface energy balance and mass fluxes to melt onset
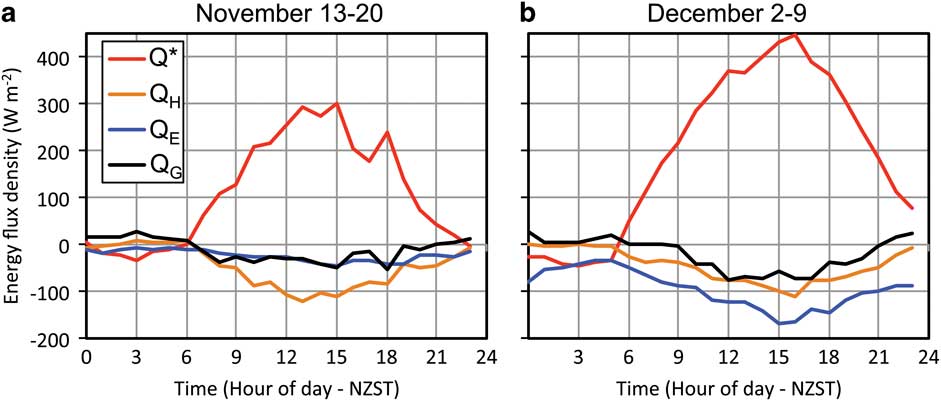
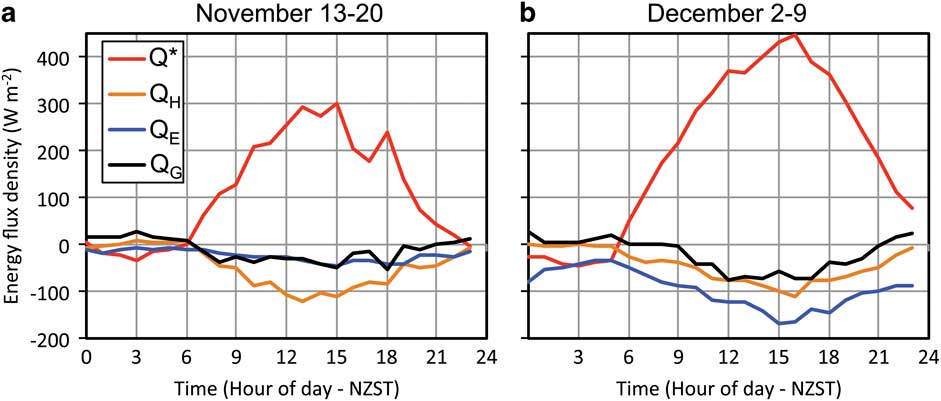
Large differences existed in both the available energy and relative energy partitioning prior to and following the onset of melt (Fig. 7, Table II). First, insolation increased by 7.9 MJ m-2 d-1 (42%) between the two periods. This was due to both an increase in solar declination and decrease in cloud cover between the periods, although it was generally quite clear throughout the study. Insolation under a clear sky day at the end of the study was 4.9 MJ m-2 d-1 greater than a clear sky day at the beginning of the study period (62% of observed increase in insolation). Albedo of the dry debris surface of the outwash fan prior to melt was 0.20. However, once melt lead to surface moistening, albedo dropped to an average of 0.14 (Table II). The darkening associated with moistening alone increased solar energy absorbed by 1.4 MJ m-2 d-1 (7.1%). Q* responded similarly to absorbed solar radiation and had a 7.2 MJ m-2 d-1 (75%) increase between the two periods. Ground heat flux (Q G ) rose proportionally and did not deviate far from 12% of Q* throughout. The remaining partitioning of convective energy was dominated by Q H in the first period and Q E in the second period (Fig. 7), with an associated switch in the Bowen ratio (β) from 2.05 to 0.48 (Table II). This reversal was driven entirely by a significant increase in Q E ; Q H remained very constant between the two periods despite the significant increase in Q*. The water vapour flux measured by eddy covariance was fairly small in the first period (0.39 mm d-1) with a large jump in the second period to an average of 1.6 mm d-1. This increase also occurred at each of the lysimeter sites (Table II). Although the mass losses were smaller in general in the debris-covered ice, the relative jump between the two periods was larger, with a four-fold increase for 20-cm debris-covered ice, three-fold increase for 10-cm debris-covered ice and close to double for the debris-laden ice and outwash fan surfaces.
Ensemble average surface energy balance components in the a. first 7-day period (13–20 November), b. last 7-day period (2–9 December) of observations under down-valley wind conditions. Frequency of down-valley wind observations in first period was 35% and in the second period was 62%. In both periods, frequency was highest in early morning and lowest in early evening.
Ground temperature profiles
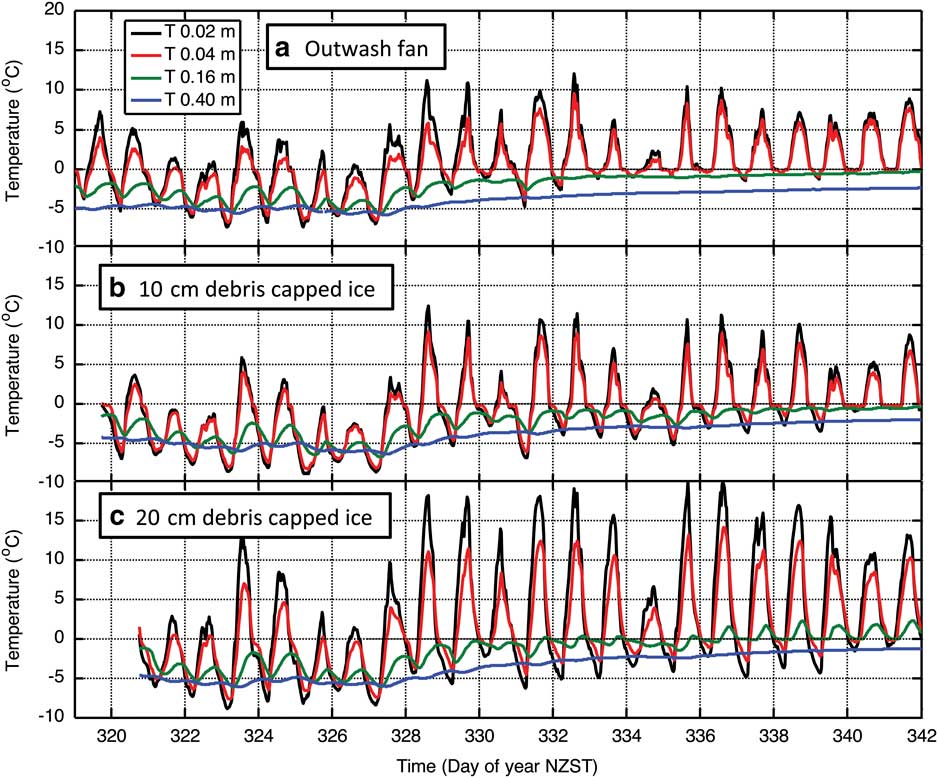
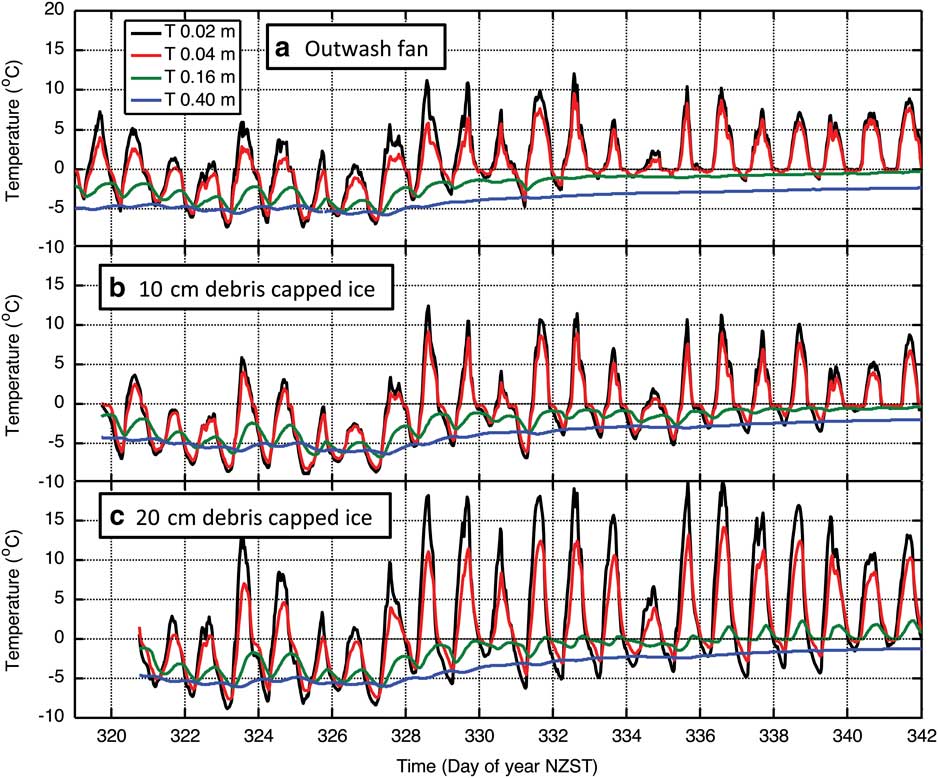
Substrate temperature decreased with depth in both magnitude and variance throughout the study period (Fig. 5d). The maximum range of temperature over the study period of 22.8°C was observed at the surface (radiometric skin temperature) and the minimum of 3.6°C at 0.4 m. Surface temperature peaked c. 30 minutes after solar radiation and the time of maximum temperature increased by 0.28 hours (17.2 minutes) per centimetre on average to a depth of 0.4 m. Figure 8 shows 20-minute average temperature time series at four depths in three substrates; two on moraines, one on the outwash fan. These three examples similarly describe the significant and rapid change in surface thermal properties as a function of the onset of melt despite their differences in substrate make-up (Fig. 2). In the first eight days, diurnal temperature oscillations were evident to 0.4 m, where the diurnal maximum was c. 12 hours after solar noon. Temperature near the surface was predominantly below freezing except near solar noon. On around day 327 (23 November), ground temperatures began increasing rapidly and the diurnal oscillation damped significantly at 0.16 and 0.4 m depths. By the end of the period, there was negligible diurnal oscillation below 0.16 m, except at the site with a 0.2 m debris cap (Fig. 8c). This stasis in temperature suggests enough melting occurred in the substrate to fully utilize available energy conducted through the substrate and enough release of latent heat energy from freezing to offset substrate cooling. The large supply of water available in the debris pore spaces (c. 15% VWC) produced enough phase change regulation of temperature to effectively shut-off most energy conduction to lower layers in the substrate. However, gradual warming continued to occur at these levels through the remainder of the observation period indicating, though greatly muted, a small positive net heat flux continued on a daily basis to at least 0.4 m.
Twenty-minute average ground temperature profiles at three locations in: a. the outwash fan, b. ice with 10-cm debris cover, and c. ice with 20-cm debris cover (13 November to 9 December 1999).
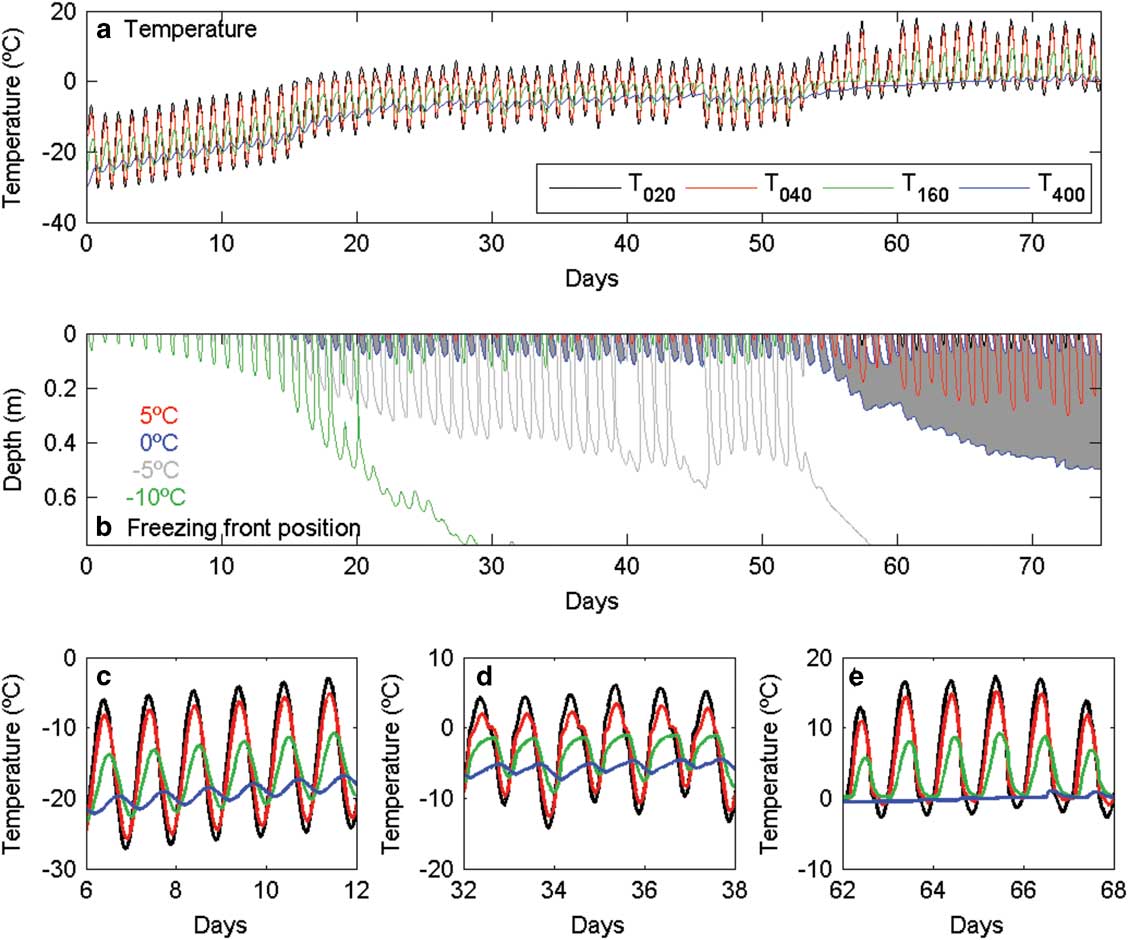
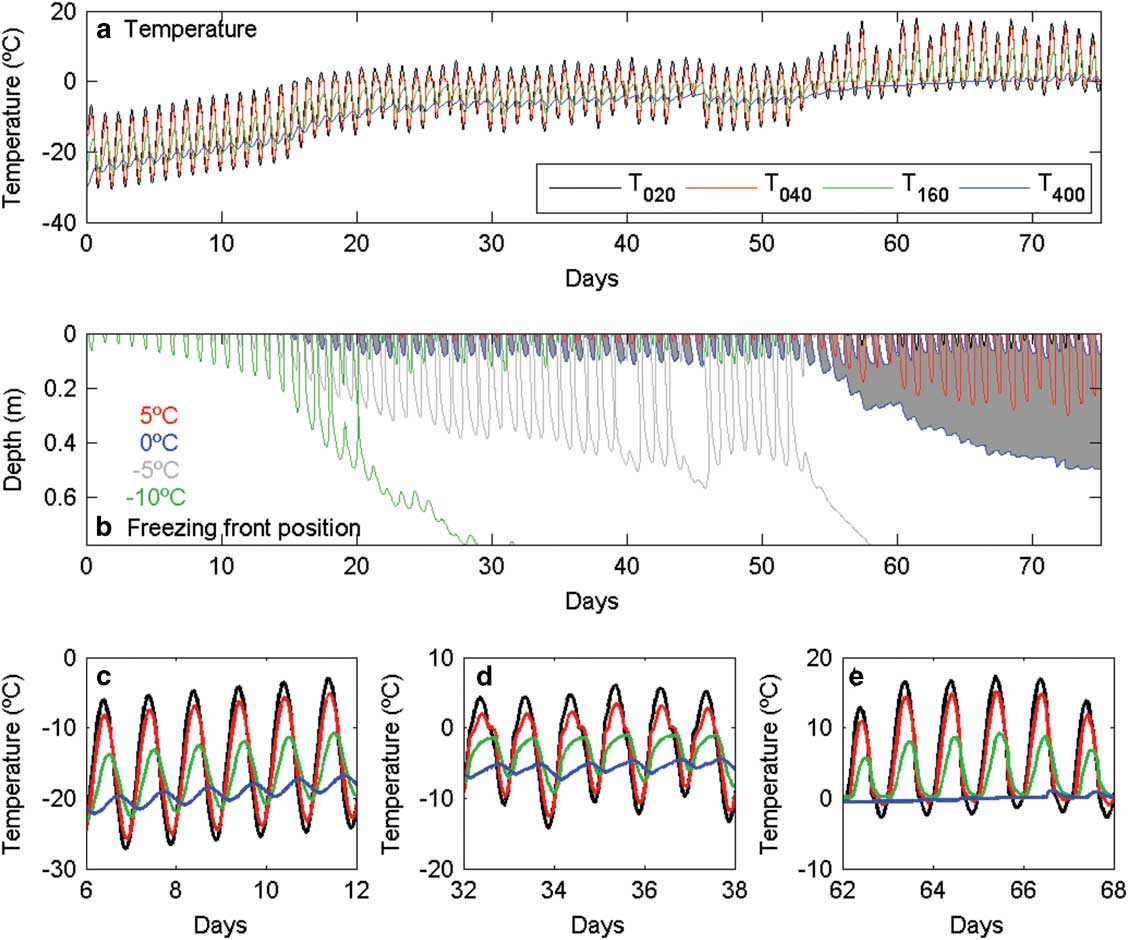
Results from the numerical simulation of ground temperatures are presented in Fig. 9. The simulations included no synoptic forcing in order to isolate the impact of the onset of melt on ground heat fluxes and temperature profiles driven purely by seasonal forcing. It is apparent that there are three regimes (Fig. 9b): days 0–15 where there is no melt, days 16–54 where there are melt zones during part of the day, and days 55–75 where there is a permanent melted zone, with a permanent deep frozen zone and temporary diurnally occurring frozen zones near the surface. In the no-melt regime, the temperature signal decays with depth (Fig. 9c), and the maximum is delayed with respect to the surface maximum (Fig. 8). Once melting behaviour commences, the diurnal amplitude is reduced (compare Fig. 9d with 9c), and the response is no longer sinusoidal. This is due to the additional heat required to melt the ice or released during freezing. At the greatest depth, the temperature signal is highly damped until the melting front traverses 0.4 m depth at around day 67, whereupon diurnal oscillations increase (Fig. 9e).
Simulations of ground temperature at four depths. a. Computed temperature at four indicated depths over the 75 simulated days. b. Indicated temperature contours; grey shaded area is where temperatures are above melting point. c.–e. Subsections of a., corresponding to different melt regimes: no melting, melting present part of the day, and melting present all of the day. Fig. a, c–e show modelled temperatures at the four depths used in observations (0.02, 0.04, 0.16 and 0.4 m) over the 75-day modelled period.
Discussion
The results from this study describe the characteristic microclimate and mass fluxes of four debris-ice surfaces in the MDVs in early summer during the onset of melt. The water loss to the atmosphere on a daily basis (0.4–1.6 mm d-1) is low by global standards; for example, an order of magnitude lower than found by Brock et al. (Reference Brock, Mihalcea, Kirkbride, Diolaiuti, Cutler and Smiraglia2010) for debris-covered ice at a mid-latitude glacier in summer. However, estimates from elsewhere in the MDVs are mostly of the same order of magnitude to those found here. On Ross Island, Balks et al. (Reference Balks, Campbell, Campbell and Claridge1995) observed mass losses of 3 mm d-1 for a disturbed soil with exposed permafrost and negligible rates for an undisturbed site. The evaporation/sublimation magnitudes observed in the current study are the same order of magnitude as total ablation estimates for a Taylor Glacier clean-ice site in summer months (Hoffman et al. Reference Hoffman, Fountain and Liston2008) and for the frozen Lake Hoare, also in the MDVs (Clow et al. Reference Clow, McKay, Simmons and Wharton1988). However, model estimates for undisturbed soils in the MDVs are three orders of magnitude lower than these observations (Hagedorn et al. Reference Hagedorn, Sletten and Hallet2007). The very low predicted values appear to be due to assumptions regarding the availability of moisture at the surface. Sediment water levels were observed to be much higher in the present study (c. 20% VWC).
Ablation rates have been estimated to vary considerably within the MDVs by topographical controls on wind, solar radiation and air temperature (Ebnet et al. Reference Ebnet, Fountain, Nylen, McKnight and Jaros2005) and different substrate constituents (Reid & Brock Reference Reid and Brock2010). Large mass flux differences were found between substrate types within a small area. Both the ice-cemented outwash fan and the debris-laden ice sites produced approximately twice the mass flux of the debris-capped ice samples. Since net radiation, temperature profiles and ground heat fluxes were similar between these substrates, the main difference appears to be availability of water at the surface. The debris capping the ice was comparatively dry and limited transport of water from the ice beneath to the atmosphere, reducing mass loss by c. 50% compared with the debris-laden ice sample. Reid & Brock (Reference Reid and Brock2010) showed theoretically that 10 and 20 cm of debris cover is sufficient to reduce mass fluxes by this margin. Very small sublimation rates were estimated for Victoria Valley (Hagedorn et al. Reference Hagedorn, Sletten and Hallet2007) and Beacon Valley (Hindmarsh et al. Reference Hindmarsh, van der Wateren and Verbers1998, Putkonen et al. Reference Putkonen, Sletten and Hallet2003), all cases with undisturbed arid soil layers above ice.
Energy balance closure analysis showed a consistent underestimation by turbulent fluxes of available energy when temperatures were above freezing and overestimation when temperatures were below freezing. The nature of this imbalance suggests the residual energy is made up, at least in part, by the unmeasured energy balance terms: melt and freezing. The most probable source of unmeasured energy loss is through melt followed by runoff, since the melt-evaporation route for water would be measured by the eddy covariance system. In energetic terms, runoff here represents downstream advection of energy absorbed at the surface during the melt phase change. Percolation is unlikely since the temperature profiles show frozen debris below 0.16 m throughout the study. Furthermore, there was visible runoff into Lake Bonney soon after the beginning of the experiment and this increased throughout. If the residual in the SEB was assumed to be entirely due to unmeasured melt and freezing, the average water equivalent of runoff generated would be 8 mm d-1. This value should be considered speculative only since it assumes complete accuracy of the other four terms and that all of the energy flux residual on a diurnal basis is due to unmeasured melt. Nevertheless, combined with the directly measured 1 mm d-1 loss to the atmosphere, this would represent a total ablation of c. 9 mm d-1. This is significantly higher than estimates of ablation from a clean-ice surface 4 km up-valley from the Taylor Glacier terminus (Hoffman et al. Reference Hoffman, Fountain and Liston2008). There, ablation was dominated by sublimation and averaged 180 mm yr-1 peaking at c. 40 mm mth-1 in December/January, a magnitude similar to our direct observations of mass flux to the atmosphere. However, on the glacier, ablation occurred by sublimation, with melt restricted to a few days each year (Hoffman et al. Reference Hoffman, Fountain and Liston2008) compared with the current study where melt seemed to dominate overall ablation on a daily basis.
The differences in SEB and water vapour loss to the atmosphere during the study were largely governed by the status of surface temperatures with respect to freezing. The most significant differences occurred between the periods before and after the onset of melt on the outwash fan over a period of approximately one week. On a seasonal timescale, this operates like a hydrological switch, with surface temperatures rapidly brought up to and beyond the freezing point, providing water to the pores of soils near the surface, resulting in daily water vapour fluxes jumping four-fold and the Bowen ratio switching from 2.05 to 0.48 within a week. Such dynamic change to energy partitioning is a unique aspect of this environment. Stichbury et al. (Reference Stichbury, Brabyn, Green and Cary2011) described this hydrological switch in the MDVs and predicted it to be a widespread feature. The process-response of heat flux, temperature and water phase change found in the current study would certainly support this.
Secondly, due to its low albedo, the magnitude of SEB and water vapour fluxes was strongly controlled by changes in solar radiation due to both cloud cover and seasonality in solar declination. This controlled the available energy, which was also found to control the magnitudes of Q G and (Q H +Q E ). However, the partitioning of the turbulent heat fluxes was primarily driven by availability of water controlled by seasonal temperatures, which produced a well-defined temporal switch in the Bowen ratio.
Thirdly, the SEB and water vapour fluxes varied due to local winds and different magnitudes of turbulent transport, temperature and humidity. Hoffman et al. (Reference Hoffman, Fountain and Liston2008) also found solar radiation to drive ablation on the Taylor Glacier surface on the seasonal timescale with regional winds playing a secondary role impacting day-to-day variability in ablation rates. The generally warmer, drier and more turbulent characteristics of air masses derived from the EAIS compared with those derived from McMurdo Sound were also found in the nearby Wright Valley (McKendry & Lewthwaite Reference McKendry and Lewthwaite1992), as well as in simulations of regional winds in the MDVs region using a mesoscale atmospheric model (Steinhoff et al. Reference Steinhoff, Bromwich and Monaghan2012). However, despite the different atmospheric demands for moisture between up- and down-valley winds, the weighing lysimeters reported relatively small increases in mass wasting under down-valley winds relative to up-valley. In contrast, Doran et al. (Reference Doran, McKay, Fountain, Nylen, McKnight, Jaros and Barrett2008) observed much higher runoff in the MDVs during a summer with a particularly high frequency of down-valley winds. This suggests that the role of regional winds on runoff in the overall watershed is more significant than observed in debris-laden ice over short timescales. The length of observations in the present study was too short to experience many extreme föhn events. Only one wind event resulted in air temperatures >0°C and velocities >10 m s-1, when the largest fluxes of water vapour to the atmosphere were measured. Despite the limitations of this dataset, it is also possible that the atmospheric characteristics of the local wind regime are less important in the case of debris-covered than bare ice surfaces, due to the lower albedo and, therefore, larger relative role of absorbed solar radiation. For example, Hoffman et al. (Reference Hoffman, Fountain and Liston2008) measured an average albedo of c. 0.6 for the Taylor Glacier surface at the same time of year as this study measured an average albedo of 0.17 for the nearby debris-laden ice surface. This represents nearly a doubling of absorbed solar energy in the debris-laden substrate relative to the glacier, which also showed solar radiation transmission to c. 0.5 m in bare ice (Hoffman et al. Reference Hoffman, Fountain and Liston2008). In addition, absorbed solar radiation led to ground temperatures near the surface being increasingly near or above freezing which provided water to the near-surface layer of the substrate. Therefore, it is also possible that the mean difference in atmospheric demand for water between up- and down-valley winds (ΔVPD=1.2 hPa) was less important to evaporation/sublimation than changes to the surface supply of meltwater due to the rapidly warming ground temperatures.
The SEB throughout the study showed a strong diurnal cycle, including switching between surface cooling and heating. Temperature changes combined with the suddenly abundant supply of water in the debris led to freeze-thaw cycling on a diurnal basis to a depth of at least 0.16 m. This produced complex temperature profiles, with significant reduction of heat conduction below the freezing front and coincident damping of the diurnal temperature signal. By the end of the study, the amount of water available in the sediment meant that as the surface energy budget became negative and cooling ensued, ground temperatures to a depth of 0.16 m did not drop more than 0.5 degrees below freezing due to the large magnitude of latent heat release. Modelling heat fluxes shows that the observed damping and stasis in the temperature profiles can be represented in general terms. This supports the explanation of the importance of latent heat exchange in the substrate temperature profile. Our aim was not to represent the data exactly, as there were several unconstrained parameters, such as synoptic meteorology leading up to the observation period, which prevented a detailed match from being made. However, simulated temperature profile behaviour is consistent with observations and supports our interpretation of the dynamic control of water phase transitions in the substrate. It also shows a similar rate of freezing front penetration. Although this dynamic ground temperature behaviour has been observed elsewhere in the region (e.g. Campbell et al. Reference Campbell, MacCulloch and Campbell1997), this appears to be a particularly extreme case owing to the large supply of water for melting and freezing on a diurnal basis, and large magnitudes of latent heat absorption and release associated with them. This means that the onset of melt, irrespective of synoptic controls, can produce extremely dynamic temperature profile behaviour and rapid changes in sediment hydrology, as well as very large increases in water vapour flux and an abrupt shift in the Bowen ratio. These soil hydrological and microclimate changes have important consequences for ecology, including microbial species-richness, diversity and functioning (Cary et al. Reference Cary, McDonald, Barrett and Cowan2010).
Conclusions
This article has presented observations of SEB, water vapour fluxes and ground temperature profiles of debris-laden ice near the Taylor Glacier terminus from 13 November to 9 December 1999. Although a fairly short observational period, it covered the onset of melt in the debris-ice surfaces and included comprehensive micrometeorological measurements. This included eddy covariance, radiation and ground measurements of SEB components on a flat outwash fan, three weighing lysimeters in terminal moraines, and three ground temperature and heat flux profiles in a mix of the two sites. These observations enable a characterization of the micro-hydroclimate of these important polar ‘dry’ surfaces as they transitioned from predominantly frozen to rapidly melting in early summer.
The SEB over the entire period was driven primarily by absorbed solar radiation, with relatively low albedo of the surface (0.17) and insolation 19.7 MJ m-2 d-1 near its seasonal peak. The ground heat flux was consistently proportional to net radiation, with a ratio of -0.12±0.003 and the remaining energy was dominated by latent heat fluxes with a Bowen ratio of 0.78. Net radiation dropped below zero during the hours of lowest solar elevation angles, with local topography casting shadow on the site for c. 4 hours of the day. Nocturnal radiative losses were made up primarily by the sensible heat flux.
The main effect of the onset of melt on the SEB was the four-fold increase of the latent heat flux, with the sensible heat flux remaining much the same and the Bowen ratio switching from 2.05 to 0.48. A test of the SEB closure suggested that the unmeasured term melt/freezing could account for some of the energy residual (20% of net radiation, the equivalent of 8 mm d-1 melt). Secondly, Q* increased 76% due fairly equally to an increase in solar declination, a decrease in cloud cover and a decrease in albedo due to surface water. The local winds had a less significant impact on the latent heat flux, although up-valley winds from McMurdo Sound were generally weaker, less turbulent, colder and more humid than down-valley winds. Latent heat fluxes were slightly higher under down-valley wind conditions than up-valley as determined with modest statistical certainty by the weighing lysimeters.
Mass fluxes of water vapour from sublimation or evaporation of meltwater averaged c. 1 mm d-1, with good agreement between the eddy covariance and lysimeter estimates and a significantly lower mass loss from the debris-capped ice sites than the mixed debris-ice sites. As surface melt began, mass fluxes jumped four-fold from 0.39 to 1.6 mm d-1, with the main change occurring over the period of c. 1 week and timed exactly with the shift in Bowen ratio. This illustrates a dynamic hydrological response or ‘switch’ resulting from the SEB response to surface temperatures passing the freezing point, which is in turn driven by seasonal heating.
Initially, ground temperatures were predominantly below freezing throughout the profile and the diurnal temperature signal could easily be seen at 0.4 m with a 12-hour lag behind surface temperature, which lagged 30 minutes behind solar noon. Once melt began, the large amounts of latent heat of fusion being absorbed and released in the near-surface substrate caused temperatures below the freezing front to lose all diurnal temperature signal. The magnitude of damping was clearly controlled by the availability of water for phase change, but once melt began, local runoff provided sufficient water. Both the stasis effect, the speed of the freezing front penetration and the associated rapid seasonal transition in temperature profiles were captured in a simple one-dimensional numerical simulation. The model accounted for seasonal drivers in substrate heat fluxes and latent heat fluxes of melting, freezing, evaporation and sublimation, but not synoptic controls and assumed the upper substrate was saturated.
These findings demonstrate the sensitivity of microclimates and hydrological exchanges in mixed debris-ice surfaces to small changes in climate drivers around the freezing point, which can produce rapid changes in the hydrological system of the MDVs. The complexity of this response warrants further investigation in order to improve understanding of microclimate and hydrological processes in moist polar soils and improve characterization of the hydro-climate environment of polar ecosystems and the consequences of a changing climate.
Acknowledgements
Antarctica New Zealand provided funding and all logistical support for this experiment and we are grateful to all who had a hand in obtaining these observations. Analysis and early writing on this manuscript was completed while the lead author was a visiting fellow at Gateway Antarctica, University of Canterbury and we would like to acknowledge the support provided by the director and staff there. We are also grateful for the comprehensive reviews of two anonymous reviewers, whose comments greatly improved the quality of the final manuscript.
Author contribution
Andrew Oliphant took the lead in experimental design, fieldwork, data quality control and analysis, and manuscript preparation and was the corresponding author throughout. He also worked closely with Richard Hindmarsh who led the accompanying modelling work. The latter also contributed to experimental design, fieldwork and manuscript development. Nicolas Cullen led much of the literature review that provided the important context for this paper, added insightful comment to guide the analysis and was a major contributor to the manuscript preparation. Wendy Lawson secured funding for the entire study, helped with experimental design and fieldwork, and provided feedback on manuscript development. All authors were sent drafts of this manuscript throughout the development and provided feedback. All have confirmed they are satisfied with the final manuscript submitted here.