1. Introduction
The geological history of the Japanese Islands has been investigated extensively through multidisciplinary studies by different researchers and research teams (Isozaki, Reference Isozaki1996, Reference Isozaki1997 a, b, Reference Isozaki2014; Maruyama et al. Reference Maruyama, Isozaki, Kimura and Terabayashi1997, Reference Maruyama, Yanai, Isozaki, Hirata, Gillespie and Clague2009, Reference Maruyama, Omori, Senshu, Kawai and Windley2011; Isozaki et al. Reference Isozaki, Aoki, Nakama and Yanai2010 a, b, Reference Isozaki, Aoki, Sakata and Hirata2014, Reference Isozaki, Ehiro, Nakahata, Aoki, Sakata and Hirata2015, Reference Isozaki, Nakahata, Zakharov, Popov, Sakata and Hirata2017; Aoki et al. Reference Aoki, Maruyama, Isozaki, Otoh and Yanai2011, Reference Aoki, Isozaki, Yamamoto, Maki, Yokoyama and Hirata2012, Reference Aoki, Isozaki, Kokufuda, Sato, Yamamoto, Maki, Sakata and Hirata2014, Reference Aoki, Isozaki, Sakata and Hirata2015 a, b; Wakita, Reference Wakita2013, Reference Wakita2015, Reference Wakita, Chakraborty, Mokudai, Cooper, Watanabe and Chakraborty2018). The results of these studies have shown that the main mode of the geodynamic evolution of the Japanese Islands was through plate subduction during the entire Phanerozoic. The basement of the Japanese Islands is composed mainly of accretionary complexes of various ages, ranging from the Palaeozoic to the Cenozoic era.
These accretionary complexes of Japan have gradually grown outwards from west to east (in present coordinates) towards the open ocean (Isozaki et al. Reference Isozaki, Aoki, Nakama and Yanai2010 a, b). However, accretion tectonics was not steady-state, but was punctuated by different events, such as ridge and seamount subduction. These punctuations in accretionary prism growth are marked by several time gaps and the exhumation of high-pressure metamorphic rocks (Maruyama et al. Reference Maruyama, Isozaki, Kimura and Terabayashi1997). On the other hand, the process of tectonic erosion could also be an alternative explanation for producing a time gap between accretionary complexes (Suzuki et al. Reference Suzuki, Maruyama, Yamamoto and Omori2010). Both of these processes may have worked together to result in the ‘Shimanto Orogeny’ during the Cretaceous period (Aoki et al. Reference Aoki, Isozaki, Yamamoto, Maki, Yokoyama and Hirata2012). The Shimanto Orogeny is defined by a Late Cretaceous accretionary complex, and associated high-pressure metamorphism, and by the Izumi Forearc formations (Aoki et al. Reference Aoki, Maruyama, Isozaki, Otoh and Yanai2011).
The accretionary tectonics of Japan can be best understood by conducting detrital zircon geochronology of sandstones exposed in the different accretionary complexes (Isozaki et al. Reference Isozaki, Aoki, Nakama and Yanai2010 a, b). Recently, extensive works have been conducted on detrital zircons in Palaeozoic to Mesozoic formations in Japan, and have provided very useful information concerning the tectonics of Japan. If we combine the data on detrital zircons with recent age data of igneous rocks in East Asia, we may be able to determine the tectonic relationship between the Asian continent and the Japanese Islands throughout the Palaeozoic and Mesozoic eras. In Japan igneous events are related closely to the formation of accretionary complexes. To understand the accretionary history of Japan, it is very important to consider its position relative to different continental blocks, such as the North and South China blocks, where igneous activity was taking place. Palaeogeographic reconstructions of these continental blocks, and the intervening ocean basins, provide critical information about sediment dispersal and the accretion process towards the assembly of different Japanese accretionary complexes during the Palaeozoic and Mesozoic eras.
In this paper, we present a synthesis of the detrital zircon data available from the accretionary complexes and sedimentary rocks of the continental margin basins in Japan, and compare them with the timing of well-documented igneous events in the North China, South China and Indochina blocks. We also discuss the geological causes of several observed punctuations in the accretionary tectonic history of Japan and correlate these ‘time gaps’ against the stratigraphic and tectonic record of the accretionary prisms studied. In the last part of the paper, we compare and correlate the accretionary tectonics of Japan against the timing and the nature of palaeogeographic changes in mainland Asia throughout the Phanerozoic.
2. Six major stages for the formation of accretionary complexes in Japan
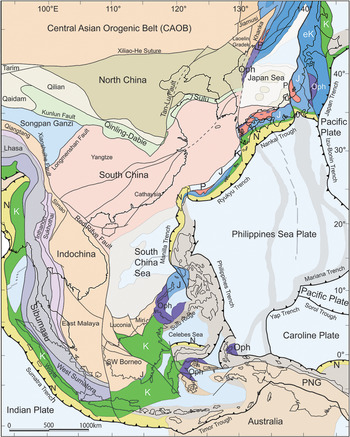
Accretionary complexes are widely distributed along the western Pacific margin (Fig. 1). Stratigraphy, structures and tectonics are best investigated in the accretionary complexes of the Japanese Islands, which are divided into six stages: the Cambrian to Middle Devonian, Late Devonian to Carboniferous, Permian to Middle Triassic, Late Triassic to early Cretaceous, middle Cretaceous to Palaeogene, and Neogene to Quaternary periods (Fig. 2). ‘Permian’ (Permian to Middle Triassic), ‘Jurassic’ (Middle Triassic to early Cretaceous) and ‘Cretaceous to Palaeogene’ (middle Cretaceous to Palaeogene) accretionary complexes are also distributed along the eastern and southern margins of Asia (Fig. 1). The reconstructed ‘ocean plate stratigraphy’ of these accretionary complexes is shown in Figure 3. Formation ages of the accretionary complexes are regarded as the same as that of trench sedimentation. A part of the accretionary complexes have become metamorphic rocks of low-T / high-P and high-T / low-P types. Based on the palaeogeographic position and tectonic setting, the formation of accretionary complexes is divided into six stages (Fig. 4).
Distribution of accretionary complexes in East and Southeast Asia (after Kojima, Reference Kojima1989; Wakita et al. Reference Wakita, Munasri and Bambang1994, Reference Wakita, Miyazaki, Zulkarnain, Sopaheluwakan and Sanyoto1998, Reference Wakita, Pubellier and Windley2013: Zamoras & Matsuoka, Reference Zamoras and Matsuoka2004; Wakita and Metcalfe, Reference Wakita and Metcalfe2005; Marquez et al. Reference Marquez, Aitchison and Zamoras2006; Wakita, Reference Wakita2012; Khancuk et al. Reference Khanchuk, Kemkin and Kruk2016). P = Permian, J = Jurassic, eK = Early Cretaceous, K = Cretaceous, N = Neogene, Oph = ophiolite.

Distribution of accretionary complexes, ancient arc systems and continental fragments in Japan. HD: Hida Belt, OK: Oki Belt, HG: Hida Gaien Belt, OE: Oeyama Ophiolite, KS: Kurosegawa Belt, SK: South Kitakami Belt, ND: Nedamo Belt, NR: Renge Metamorphic Belt, AK: Akiyoshi Belt, SO: Suo Metamorphic Belt, Mz: Maizuru Belt, UT: Ultra-Tamba Belt, MT: Mino–Tamba Belt, RK: Ryoke Belt, Cz: Chizu Metamorphic Belt, CB: Chichibu Belt, SB1: Sambagawa Metamorphic Belt, SB2: Shimanto metamorphic Belt, SM: Shimanto Belt, SM: Hidaka Belt, IZ: Izu–Bonin Arc, CS: Chishima-Kuril Arc.

Ocean plate stratigraphy of accretionary complexes of Japan, the age range of forearc sedimentation in the South Kitakami and Kurosegawa belts, and ages of plutonism and metamorphism in Japan. A’: Motai metamorphic rocks of South Kitakami Belt, B: Kurosegawa and Hida Gaien Belts, C: Nedamo Belt, C’: Renge metamorphic rocks, D: Akiyoshi Belt, E/E’: Suo Belt, F: Maizuru Belt, G: Ultra-Tamba Belt, H–K: Mino–Tamba Belt, Chichibu Belt and Ryoke Belt, I–J’: Ryoke Belt, K’: Sambagawa Belt, L: Northern Shimanto Belt, L’: Shimanto metamorphic rocks, M: Hidaka Belt, N: Southern Shimanto (Setogawa) Belt, O: Miocene to present accretionary wedge. The data are based on Geological Survey of Japan (2018). Timescale is based on the international chronostratigraphic chart of the International Commission on Stratigraphy – International Union of Geological Sciences (ICS-IUGS) v2018/08.

Six-stage division of accretionary complexes of Japan. The abbreviation from A’ to O, and timescale, is the same as in Figure 3.

2.a Stage 1: Cambrian to Middle Devonian period
Rocks of the Early to Middle Palaeozoic accretionary complexes are preserved as high-pressure metamorphic rocks in tectonic slices and blocks in serpentinite melanges associated with the Hayachine Ophiolite, a part of the South Kitakami Belt, and of the Kurosegawa Belt. Because of their limited distribution and the metamorphism of low-T / high-P type, the accretionary history is uncertain during Early to Middle Palaeozoic time in Japan. Initial magmatism of 520 Ma was recorded in the Hida–Gaien Belt (Kunugiza & Goto, Reference Kunugiza and Goto2010). In the South Kitakami Belt, three distinct districts are recognized, and were unconformably overlain by Late Devonian to Carboniferous detrital formations (Fig. 5). The three districts are characterized by Motai high-pressure type metamorphic rocks of c. 500 Ma K–Ar age, Hikami Granite c. 440 Ma and Hayachine Ophiolite of Ordovician age respectively (Ehiro et al. Reference Ehiro, Tsujimori, Tsukada, Nuramkhaa, Moreno, Wallis, Kojima and Gibbons2016).
Stratigraphy of Lower and Middle Palaeozoic in the South Kitakami Belt (modified from Ehiro et al. Reference Ehiro, Tsujimori, Tsukada, Nuramkhaa, Moreno, Wallis, Kojima and Gibbons2016).

2.b Stage 2: Late Devonian to Carboniferous period
The Early Carboniferous accretionary complex of the Nedamo Belt is the oldest, non-metamorphosed accretionary complex in Japan (Uchino et al. Reference Uchino, Kurihara and Kawamura2005; Uchino & Kawamura, Reference Uchino and Kawamura2010). The Renge high-pressure metamorphic rocks are regarded as the metamorphic equivalent of the Nedamo accretionary complexes (Uchino et al. Reference Uchino, Kurihara and Kawamura2005). As the Renge metamorphic rock shows 350–330 Ma for K–Ar and phengite Ar–Ar ages (Tsujimori, Reference Tsujimori2010), the formation of the accretionary complex, which is a protolith of the Renge metamorphic rocks, may have started in the Late Devonian. Therefore, we regard the Nedamo and Renge Belts as Late Devonian to Early Carboniferous accretionary complexes.
2.c Stage 3: Permian to Early Triassic period
Permian and Early Triassic accretionary complexes are best exposed in the Akiyoshi and Ultra-Tamba Belts of SW Japan. The metamorphic equivalents of Permian and Early Triassic accretionary complexes of the Akiyoshi Belt occur in the Suo Belt. The accretionary complex of the Ultra-Tamba Belt is intimately associated with the Permian island arc system of the Maizuru Belt. The Permian accretionary complex of the Akiyoshi Belt is unconformably overlain by Middle to Late Triassic coastal to slope facies formations of the Asa, Mine and Nariwa groups. The Triassic part of the accretionary complex of the Akiyoshi Belt became the high-pressure metamorphic rocks of the Suo Belt. The Permian forearc formations of the Maizuru Belt were also covered unconformably by the Nabae and Yakuno groups of coastal to slope facies. In the Ultra-Tamba Belt, accretion continued from Permian to Triassic time along the Maizuru volcanic arc.
2.d Stage 4: Middle Triassic to Early Cretaceous period
Accretionary complexes of this age group are widely distributed in Japan (Fig. 1). They are composed of basalt, limestone, chert, siliceous shale, mudstone, sandstone and conglomerate. This rock association is regarded as ‘ocean plate stratigraphy’ (Matsuda & Isozaki, Reference Matsuda and Isozaki1991; Wakita & Metcalfe, Reference Wakita and Metcalfe2005; Wakita, Reference Wakita2012, Reference Wakita2015). The basalt was a component of the uppermost part of an oceanic plate or the upper part of a seamount, whereas the limestone was formed as an oceanic atoll sitting on a basaltic seamount (Kanmera & Nishi, Reference Kanmera, Nishi, Hashimoto and Ueda1983; Sano & Kanmera, Reference Sano and Kanmera1988). Chert was originally radiolarian ooze in a pelagic setting on the ocean floor from Permian to Jurassic time. When the oceanic plate approached the trench, hemipelagic sediments were deposited as siliceous shale. These oceanic sediments and rocks were overlain by turbidite sequences, consisting of mudstone, sandstone and rarely conglomerate at the trench. All these rocks and sediments were accreted to continental margins or island arcs during oceanic plate subduction, from the Middle Triassic to the early Cretaceous, if sediment supply was sufficiently large to form an accretionary wedge.
2.e Stage 5: middle Cretaceous to Palaeogene period
Middle Cretaceous to Palaeogene accretionary complexes were developed in the Shimanto Belt of SW Japan, as well as in the Hidaka Belt of Hokkaido (Fig. 1). The Shimanto accretionary complex is divided into Cretaceous and Palaeogene sub-complexes. The Izumi Group was deposited in the forearc basin, while the Sotoizumi Group was formed in a slope basin in a forearc setting in Late Cretaceous time. Along the Japan Trench, a part of the Cretaceous accretionary complex was tectonically eroded by subduction of the Pacific Plate (Yanai et al. Reference Yanai, Aoki and Akahhori2010). Another part of the Cretaceous accretionary complex became the high-pressure Shimanto metamorphic rocks (Aoki et al. Reference Aoki, Maruyama, Isozaki, Otoh and Yanai2011), which subsequently became a major part of the Sanbagawa Metamorphic Belt. Extensive igneous events occurred in SW Japan and along the eastern margin of the Asian continent during this time (e.g. Kinoshita, Reference Kinoshita1995; Zhang et al. Reference Zhang, Zhai, Hou, Li, Liu and Hu2012; Mao et al. Reference Mao, Takahashi, Kee, Li, Ye and Zhao2014; Grebennikov et al. Reference Grebennikov, Khanchuk, Gonevchuk and Kovalenko2016).
2.f Stage 6: Neogene to Quaternary period
Miocene and younger accretionary complexes have been developed in SW Japan. They mainly occur nowadays in the offshore region along the Nankai Trough, but also appear on land in the Boso Peninsula and adjacent areas as a result of crustal uplift, associated with the collision of the Izu–Bonin island arc system with the Honshu Arc. The formation of the Neogene to Quaternary accretionary complex started with the opening of the Japan Sea, following the onset of subduction of the Philippines Sea Plate beneath the Honshu Arc.
3. Accretionary history and detrital zircon data
U–Pb detrital zircon dating of ancient and modern accretionary prism complexes of Japan has been undertaken by many researchers in recent years (e.g. Aoki et al. Reference Aoki, Isozaki, Yamamoto, Maki, Yokoyama and Hirata2012, Reference Aoki, Isozaki, Kokufuda, Sato, Yamamoto, Maki, Sakata and Hirata2014; Okawa et al. Reference Okawa, Shimojo, Orihashi, Yamamoto, Hirata, Sano, Ishizaki, Kouchi, Yanai and Otoh2013; Fujisaki et al. Reference Fujisaki, Isozaki, Sakata, Maki, Hirata and Maruyama2014). As detrital zircons mostly originate from igneous rocks in the provenance area, we can infer the timing of ancient igneous events through the detrital zircon data.
Figure 6 shows the age distribution of detrital zircons from sandstone or psammitic schist of accretionary complexes, forearc basin sediments, and coastal to slope facies sediments. Some of the data sources are provided in this paper as online Supplementary Material (available at https://doi.org/10.1017/S0016756818000742). They are U–Pb age data of detrital zircon from sandstones or psammitic schist of the Akiyoshi, Suo, Maizuru and Ultra-Tamba belts, as well as Triassic non-marine to shallow marine formations of the Nariwa, Asa and Mine groups. Additionally, we have compiled U–Pb detrital zircon age data from various other sources, such as Tsutsumi et al. (Reference Tsutsumi, Yokoyama, Terada and Sano2000, Reference Tsutsumi, Miyashita, Terada and Hidaka2009), Fujisaki et al. (Reference Fujisaki, Isozaki, Sakata, Maki, Hirata and Maruyama2014), Aoki et al. (Reference Aoki, Isozaki, Yamamoto, Sakata and Hirata2015 b), Hara et al. (Reference Hara, Nakamura, Hara, Kurihara, Mori, Iwano, Danhara, Sakata and Hirata2017, Reference Hara, Hirano, Kurihara, Takahashi and Ueda2018), Uchino (Reference Uchino2017), Zhang et al. (Reference Zhang, Takeuchi, Ohkawa and Matsuzawa2018) and the supplementary file of this paper (available online at https://doi.org/10.1017/S0016756818000742).
Histograms of detrital zircon U–Pb ages with plotting increment of 100 Ma. Age from various rocks of Permian accretionary complexes, Triassic metamorphic rocks, Jurassic accretionary complexes and Cretaceous accretionary complexes. Based on Tsutsusmi et al. (Reference Tsutsumi, Yokoyama, Terada and Sano2000), Aoki et al. (Reference Aoki, Isozaki, Yamamoto, Maki, Yokoyama and Hirata2012, Reference Aoki, Isozaki, Kokufuda, Sato, Yamamoto, Maki, Sakata and Hirata2014), Okawa et al. (Reference Okawa, Shimojo, Orihashi, Yamamoto, Hirata, Sano, Ishizaki, Kouchi, Yanai and Otoh2013), Fujisaki et al. (Reference Fujisaki, Isozaki, Sakata, Maki, Hirata and Maruyama2014), Hara et al. (Reference Hara, Nakamura, Hara, Kurihara, Mori, Iwano, Danhara, Sakata and Hirata2017), Zhang et al. (Reference Zhang, Takeuchi, Ohkawa and Matsuzawa2018) and the supplementary file of this paper (available at https://doi.org/10.1017/S0016756818000742).

Figure 6 shows that there are three major peaks in detrital zircon distribution, marked by the Early Permian to Early Triassic, Early to Late Jurassic, and middle to Late Cretaceous age clusters. These peak ages coincide with the ages of the main accretionary complexes. The accretionary complexes of the Japanese Islands are divided mainly into ‘Permian’ (Permian to Early Triassic), ‘Jurassic’ (Middle Triassic to early Cretaceous) and ‘Cretaceous–Palaeogene’ accretionary complexes (Figs 1, 3 and 4). As no data on detrital zircons from Palaeogene accretionary complexes are available, we cannot show the fit between detrital zircon age data and the existence of a Palaeogene accretionary complex. However, these detrital zircon data suggest that one of the reasons for the development of the major accretionary complexes of Japan is extensive igneous activity in their provenance areas.
The origin of Palaeozoic and Mesozoic sedimentary rocks of the Japanese Islands has been a controversial topic for a long time. Recently, the South China Block has been regarded as the major source of these sedimentary rocks from the analysis of detrital zircons (Isozaki et al. Reference Isozaki, Aoki, Sakata and Hirata2014, Reference Isozaki, Ehiro, Nakahata, Aoki, Sakata and Hirata2015, Reference Isozaki, Nakahata, Zakharov, Popov, Sakata and Hirata2017; Aoki et al. Reference Aoki, Isozaki, Yamamoto, Sakata and Hirata2015b). However, there has been no research work to compile and analyse the detrital zircon data of various published sources. Here, we show the compiled detrital zircon data, distinguished by U–Pb age histograms, and discuss their sources.
Detrital zircon ages, ranging from 3335 Ma to 465 Ma, are obtained from Cambrian to Silurian sandstones in the South China Block, showing the highest peak for an age cluster of 1250–980 Ma (Wang et al. Reference Wang, Zhang, Fan, Zhang, Chen, Cawood and Zhang2010). Hu et al. (Reference Hu, Huang, Wang, Yu, Xu, Jansa and Hu2012) reported detrital zircons of Middle to Late Palaeozoic and Proterozoic ages (1200–900 Ma) from the Triassic strata of the South China Block. Xu et al. (Reference Xu, Yang and Zhao2016) have investigated the detrital zircons from river sands on the Cathaysia Block, and obtained five major populations at 90–250 Ma, 400–500 Ma, 0.7–1.2Ga. 1.6–2.0 Ga and 2.3–2.6 Ga.
Figure 7 shows the dominant U–Pb ages of detrital zircons from various formations in Japan, such as accretionary complexes, high-pressure metamorphic rocks and coastal to shelf formations. The data sources for Figure 7 are Tsutsumi et al. (Reference Tsutsumi, Yokoyama, Terada and Sano2000, Reference Tsutsumi, Miyashita, Terada and Hidaka2009), Kawagoe et al. (Reference Kawagoe, Sano, Orihashi, Obara, Kouchi and Otoh2012), Okawa et al. (Reference Okawa, Shimojo, Orihashi, Yamamoto, Hirata, Sano, Ishizaki, Kouchi, Yanai and Otoh2013), Aoki et al. (Reference Aoki, Isozaki, Kokufuda, Sato, Yamamoto, Maki, Sakata and Hirata2014, Reference Aoki, Isozaki, Yamamoto, Sakata and Hirata2015 b), Fujisaki et al. (Reference Fujisaki, Isozaki, Sakata, Maki, Hirata and Maruyama2014), Nakahata et al. (Reference Nakahata, Isozaki and Tsutsumi2016), Hara et al. (Reference Hara, Nakamura, Hara, Kurihara, Mori, Iwano, Danhara, Sakata and Hirata2017, Reference Hara, Hirano, Kurihara, Takahashi and Ueda2018), Uchino (Reference Uchino2017), Zhang et al. (Reference Zhang, Takeuchi, Ohkawa and Matsuzawa2018) and the supplementary file of this paper (available online at https://doi.org/10.1017/S0016756818000742). The six-divided column shows the dominant igneous activity in the provenance of each tectonic unit. The left-hand column indicates the volcanic records, showing when the formation or complex formed. It is divided in two: detrital zircon age similar to depositional age in the upper half, and zircon age older than depositional age in the lower half. The second column shows the presence of Early Palaeozoic volcanic rocks in the provenance of each unit. The third column is the record of detrital zircon from the Neoproterozoic (1000–540 Ma). The fourth column is Mesoproterozoic (1600–1000 Ma). The fifth column shows the occurrence of Late Palaeoproterozoic zircon (2050–1600 Ma), and the sixth (right side) indicates the presence of Early Palaeoproterozoic to Archaean (3000–2050 Ma) detrital zircons.
Dominant U–Pb ages of of detrital zircon from various formations in Japan, such as accretionary complexes, high-pressure type metamorphic rocks, and coastal to shelf formations. Legend: V1 = detrital zircon age close to the depositional age, V2 = detrital zircon age a little older than the depositional age, ePz = Early Palaeozoic age, Nt = Neoproterozoic age, MPt = Mesoproterozoic age, PPt = Palaeoproterozoic age, Ar = Archaean age. Number of detrital zircon is counted in the published data. Data source is as follows. South Kitakami Belt = Okawa et al. (Reference Okawa, Shimojo, Orihashi, Yamamoto, Hirata, Sano, Ishizaki, Kouchi, Yanai and Otoh2013), Akiyoshi Belt = Aoki et al. (Reference Aoki, Isozaki, Kokufuda, Sato, Yamamoto, Maki, Sakata and Hirata2014), Zhang et al. (Reference Zhang, Takeuchi, Ohkawa and Matsuzawa2018) and the supplementary file of this paper (available at https://doi.org/10.1017/S0016756818000742), Ultra-Tamba and Maizuru belts = the supplementary file of this paper, Hida Belt = Kawagoe et al. (Reference Kawagoe, Sano, Orihashi, Obara, Kouchi and Otoh2012), Mino–Tamba Belt = Aoki et al. (Reference Aoki, Isozaki, Yamamoto, Maki, Yokoyama and Hirata2012) and Fujisaki et al. (Reference Fujisaki, Isozaki, Sakata, Maki, Hirata and Maruyama2014), Chichibu Belt = Nakataha et al. (Reference Nakahata, Isozaki and Tsutsumi2016) and Uchino (Reference Uchino2017), Kurosegawa Belt = Hara et al. (Reference Hara, Hirano, Kurihara, Takahashi and Ueda2018), Shimanto Belt (unmetamorphosed) = Aoki et al. (Reference Aoki, Isozaki, Kokufuda, Sato, Yamamoto, Maki, Sakata and Hirata2014) and Hara et al. (Reference Hara, Nakamura, Hara, Kurihara, Mori, Iwano, Danhara, Sakata and Hirata2017), Shimanto Belt (metamorphosed) = Tsutsumi et al. (Reference Tsutsumi, Miyashita, Terada and Hidaka2009) and Aoki et al. (Reference Aoki, Isozaki, Yamamoto, Maki, Yokoyama and Hirata2012).

On the other hand, Yang et al. (Reference Yang, Gao, Chen, Tang, Yuan, Gong, Xie and Wang2009) determined the U–Pb age distribution of detrital zircons from modern river sands on the North China Block, and revealed three major age groups of 150–500 Ma, 1.6–2.0 Ga and 2.1–2.5 Ga. The major difference between South China and North China blocks is that 0.7–1.2 Ga zircons are lacking in the North China Block, but occur in the South China Block. This means that there was little igneous activity during the Neoproterozoic in the North China Block. Diwu et al. (Reference Diwu, Sun, Zhang, Wang, Quo and Fan2012) investigated detrital zircons of sandstones from the North China Craton and identified peaks at 2475 Ma and 1850 Ma. Although Choi et al. (Reference Choi, Lee, Orihashi and Yi2013) investigated detrital zircons from Yellow Sea sediments, it is difficult to identify their origin.
The South China Block can provide all ranges of detrital zircon of Archaean to Palaeozoic age. Therefore, it is difficult for us to identify a North China origin, although the absence of detrital 0.7–1.2 Ga zircons clearly shows an origin from the South China Block. Detrital zircons ranging in age from 1.6 to 2.6 Ga are very common in river sand from the North China Block, compared with sands from the South China Block (Yang et al. Reference Yang, Gao, Chen, Tang, Yuan, Gong, Xie and Wang2009). Detrital zircons from Upper Proterozoic to Ordovician strata of the North China Block range in age from 1.72 to 2.97 Ga (Darby & Gehrels, Reference Darby and Gehrels2006). Xie & Heller (Reference Xie and Heller2013) investigated detrital zircons from Triassic formations in the Ordos Basin of the North China Block, and obtained detrital zircons of Early and Late Palaeoproterozoic (1.7–2.6 Ga) ages.
Based on this research on detrital zircon ages from the North and South China blocks, we propose criteria to distinguish the contributions of the North and South China blocks to the Japanese detrital sediments.
1. If sedimentary rocks include detrital zircons of 0.7–1.2 Ga, they must be of South China origin.
2. If sedimentary rocks do not include detrital zircons of 0.7–1.2 Ga, but if zircons with ages of 1.6–2.6 Ga are dominant, they are possibly of North China origin.
Of course, we cannot exclude the possibility of a South China origin, even in case 2. However, detrital zircons of 0.7–1.2 Ga are dominant in the South China Block, therefore, if detrital zircons of 1.6–2.6 Ga are dominant and zircons of 0.7–1.2 Ga are much less frequent, it is possible to say that the contribution of North China provenance was very high for the detrital zircon supply to the formations.
In Figure 7, we observe that there is a big change in the dominant age of detrital zircons between Palaeozoic and Mesozoic formations. The boundary occurs within the Permian and Triassic periods. Palaeozoic formations of the South Kitakami Belt obviously have a South China origin, because they contain Neoproterozoic detrital zircons. In the Middle Triassic and later, the age pattern of detrital zircon changes suddenly. Younger sedimentary rocks either lack, or contain far fewer, Neoproterozoic and Late Mesoproterozoic zircons. This clear change coincides with the collision between North China and South China.
Detrital zircon ages close to sedimentary age indicate the active eruption of volcanic rocks and related igneous activity. Volcanic eruptions were very frequent in the Permian, Jurassic and Cretaceous periods, and less active in the Triassic and middle to late Early Cretaceous. This age marks a time gap between the formation of two different accretionary complexes, as mentioned in the previous section. A variety of detrital zircon ages were available in Permian and Triassic times, because sedimentary rocks from several tectonic units were derived from different sources. Similar provenances were available in Jurassic to Cretaceous times; sources were predominantly from the North China Block. In these stages, sedimentary rocks of all tectonic units were derived from rather similar sources.
These data suggest that the sediments in the South Kitakami Belt were derived from the South China Block in Early to Middle Palaeozoic time. The provenance of sediments in the South Kitakami Belt and other tectonic units was different in Permian to Triassic times. The provenances in all tectonic units became homogeneous, and were mainly from North China in Jurassic and Cretaceous times.
3.a Provenance of Permian accretionary complex
Figure 8 shows the distribution of Late Palaeozoic granites and accretionary complexes. It is clear that there are few granite intrusions of Late Palaeozoic age along the present distribution of Late Palaeozoic accretionary complexes. Xu et al. (Reference Xu, Yang and Zhao2016) indicate that there are very few records of Late Palaeozoic detrital zircons from the river sands in Cathaysia (SE part of South China Block). This evidence is incompatible with the large population of detrital zircons of Late Palaeozoic age in sandstones in Late Palaeozoic accretionary complexes (Fig. 6). This contradiction may be resolved by the existence of a volcanic arc far from the South China Block. The Permian accretionary complex of the Japanese Islands must have been formed along such a volcanic island, which was separated from the South China Block. However, acidic tuff of the Nishiki Group contains detrital zircons of 2700–2500 Ma together with ones of 320–260 Ma. Tsutsumi et al. (Reference Tsutsumi, Yokoyama, Terada and Sano2000) indicate the North China Block as the possible provenance of sediments in the Permian accretionary complex of the Akiyoshi Belt.
Distribution of Late Palaeozoic granites and accretionary complex (Wakita & Metcalfe, Reference Wakita and Metcalfe2005; Ren, Reference Ren2013; Wakita et al. Reference Wakita, Pubellier and Windley2013; Xu et al. Reference Xu, Yang and Zhao2016; Wang et al. Reference Wang, Tong, Zhang, Li, Huang, Zhang, Guo, Yang, Hong, Donskaya, Gladlochub and Tserendash2017).

3.b Provenance of Jurassic accretionary complexes
Late Triassic to Early Cretaceous accretionary complexes (called simply a Jurassic accretionary complex in this section) are widely distributed in East Asia (Fig. 9), from the Russian Far East (Kojima, Reference Kojima1989; Khanchuk et al. Reference Khanchuk, Kemkin and Kruk2016) to South Borneo Island (Wakita et al. Reference Wakita, Miyazaki, Zulkarnain, Sopaheluwakan and Sanyoto1998) via Japan (Isozaki, Reference Isozaki2006; Wakita, Reference Wakita2012) and the Philippines (Zamoras & Matsuoka, Reference Zamoras and Matsuoka2004; Marquez et al. Reference Marquez, Aitchison and Zamoras2006). Recently, Zhou and Li (Reference Zhou and Li2017) reported a new accretionary complex of Late Triassic to Early Jurassic age in NE China by detrital zircon age dating. Suzuki et al. (Reference Suzuki, Adachi and Tanaka1991) suggest a gneiss and granitic terrane of middle Precambrian age as the provenance for sandstone of the Jurassic accretionary complex. Fujisaki et al. (Reference Fujisaki, Isozaki, Sakata, Maki, Hirata and Maruyama2014) mentioned that the Jurassic accretionary complex received terrigenous clastics from both the North and South China blocks. Detrital zircons within the Jurassic accretionary complexes are also derived from the adjacent igneous provinces on the eastern margin of the Asian continent. Igneous provenances for the accretionary complexes are widely distributed as Triassic to Jurassic granites along the eastern margin of the Asian continent. These arrangements of accretionary complexes and granite intrusions suggest that the westward subduction of oceanic plate occurred widely along the eastern margin of the Asian continent after amalgamation of Palaeo-Tethys continental fragments such as the North China, South China and Indochina blocks. This stable tectonic setting of East and Southeast Asia is shown by the similarity in detrital zircon age patterns among various tectonic units of Japan (Fig. 7).
Distribution of Triassic to Jurassic granites and accretionary complex (data source: Sagong & Kwon, Reference Sagong and Kwon2005; Wakita & Metcalfe, Reference Wakita and Metcalfe2005; Cobbing, Reference Cobbing, Ridd, Barber and Crow2011; Kim et al. Reference Kim, Kwon, Koh, Yi, Jeong and Santosh2011; Ren, Reference Ren2013; Wakita et al. Reference Wakita, Pubellier and Windley2013; Xu et al. Reference Xu, Yang and Zhao2016; Henning et al. Reference Henning, Breitfeld, Hall and Nugraha2017; Li et al. Reference Li, Jahn, Zhao, Dai, Li, Suo, Guo, Wang, Liu, Lan, Zhou, Zhen and Wang2017; Wang et al. Reference Wang, Tong, Zhang, Li, Huang, Zhang, Guo, Yang, Hong, Donskaya, Gladlochub and Tserendash2017).

3.c Provenance of Cretaceous accretionary complexes
The formation of accretionary complexes was very active throughout the Circum-Pacific region in Cretaceous times (Fig. 10). The Late Cretaceous to Palaeogene Shimanto Belt accretionary complex is a representative in Japan (Taira et al. Reference Taira, Okada, Whitaker, Smith and Leggett1982). Early Cretaceous accretionary complexes are widely distributed in the Russian Far East (Khanchuk et al. Reference Khanchuk, Kemkin and Kruk2016), Indonesia (Wakita, Reference Wakita, Hall and Blundell1996, Reference Wakita2000) and the Myanmar region (Barber et al. Reference Barber, Zaw and Crow2017). Research on provenance analysis shows that in most cases the source was a felsic igneous terrain caused by active volcanism in a volcanic arc along the eastern margin of the Asian continent. Cretaceous igneous rocks occur in the Russian Far East, Japan, Southeast China, Borneo and the western part of Thailand. Early Cretaceous igneous activity is dominant in the Russian Far East (Grebennikov et al. Reference Grebennikov, Khanchuk, Gonevchuk and Kovalenko2016; Wu et al. Reference Wu, Jahn, Nechaefv, Chshchin, Popov, Yokoyama and Tsusumi2017; Zhao et al. Reference Zhao, Jahn and Xu2017), NE and SE China (Li, Reference Li2000; Mao et al. Reference Mao, Takahashi, Kee, Li, Ye and Zhao2014; Yang et al. Reference Yang, Zhao, Hou, Niu, Mo, Sheng and Wang2018) and NE Japan (Wang et al. Reference Wang, Zhou, Zhang, Ying, Zhang, Wu and Zhu2006; Zhang et al. Reference Zhang, Zhai, Hou, Li, Liu and Hu2012), whereas Late Cretaceous igneous rocks are widely distributed in Japan (Kinoshita, Reference Kinoshita1995), Indonesia (Amiruddin, Reference Amiruddin2009; Henning et al. Reference Henning, Breitfeld, Hall and Nugraha2017) and Thailand (Cobbing, Reference Cobbing, Ridd, Barber and Crow2011).
Distribution of Cretaceous to Palaeogene granites and accretionary complex (data source: Wakita & Metcalfe, Reference Wakita and Metcalfe2005; Sagong & Kwon, Reference Sagong and Kwon2005; Kim et al. Reference Kim, Kwon, Koh, Yi, Jeong and Santosh2011; Wakita et al. Reference Wakita, Pubellier and Windley2013; Ren, Reference Ren2013; Khanchuk et al. Reference Khanchuk, Kemkin and Kruk2016; Xu et al. Reference Xu, Yang and Zhao2016; Henning et al. Reference Henning, Breitfeld, Hall and Nugraha2017; Li et al. Reference Li, Jahn, Zhao, Dai, Li, Suo, Guo, Wang, Liu, Lan, Zhou, Zhen and Wang2017; Martynov et al. Reference Martvnov, Khanchuk, Grebennikov, Chshchin and Popov2017; Wang et al. Reference Wang, Tong, Zhang, Li, Huang, Zhang, Guo, Yang, Hong, Donskaya, Gladlochub and Tserendash2017; Zhao et al. Reference Zhao, Jahn and Xu2017).

4. What is the main cause for separation of two different stages?
Why are the accretionary complexes of Japan divided into several tectonic units? Isozaki (Reference Isozaki2000) and Isozaki et al. (Reference Isozaki, Aoki, Nakama and Yanai2010 a) suggested that subduction of oceanic ridges of the two different plates coincides with the time gap between the formation of two accretionary complexes, and with exhumation of high-pressure metamorphic complexes. Tectonic erosion possibly caused the gap between two different accretionary complexes (Suzuki et al. Reference Suzuki, Maruyama, Yamamoto and Omori2010). Isozaki et al. (Reference Isozaki, Aoki, Nakama and Yanai2010 a) suggested that the ridge subduction and tectonic erosion occurred at the same time to cause the gap between the accretionary complexes.
As mentioned in the previous section, extensive igneous activity must be one of the main causes for the formation of accretionary complexes. In other words, less igneous activity may be one of the causes of the gap between two different accretionary complexes. However, as tectonic erosion may happen when the sediment supply from the provenance is insufficient, less igneous activity must be a trigger for tectonic erosion as well.
How about ridge subduction? If an oceanic ridge is subducted, the age of subducting oceanic plate becomes gradually younger, until the ridge is reached subduction, after the ridge is subducted the plate will become gradually older. The age of oceanic crust can be estimated from the age of pelagic chert resting on basalt. The ocean plate stratigraphy of the accretionary complexes from Carboniferous to earliest Cretaceous is shown in Figure 3. The age of basalt in these accretionary complexes is mainly Late Palaeozoic. The data indicate that active ocean ridge subduction did not occur in the Triassic period.
4.a Tectonics of Stage 1 and its termination
Accretionary complexes of Stage 1 are recorded by the high-pressure metamorphic rocks in the Kurosegawa Tectonic Belt, Hida Gaien Tectonic Belt, Nagato Tectonic Belt and along the South Kitakami Belt. These rocks are exposed as rather small tectonic blocks within serpentinite melange. Tectonic erosion is one of the mechanisms for the formation of serpentinite melanges, including tectonic blocks of high-pressure metamorphic rocks (e.g. Isozaki et al. Reference Isozaki, Maruyama, Aoki, Nakama, Miyashita and Otoh2010 b; Suzuki et al. Reference Suzuki, Maruyama, Yamamoto and Omori2010; Yang et al. Reference Yang, Santosh, Maruyama and Nakagawa2016).
The most important evidence for the termination of Stage 1 is the stratigraphic record in the South Kitakami Belt. Ehiro et al. (Reference Ehiro, Tsujimori, Tsukada, Nuramkhaa, Moreno, Wallis, Kojima and Gibbons2016) showed that there are three different tectonic units, ranging from Cambrian to middle Devonian, in the South Kitakami Belt. These units are overlain unconformably by Late Devonian to Early Carboniferous formations (Fig. 5). This stratigraphic relationship suggests that the rearrangement and amalgamation of three different tectonic units occurred in the Late Devonian period. The Devonian period was the time of the break-up of the margin of Gondwana, and the commencement of the opening of the Palaeo-Tethys (e.g. Metcalfe, Reference Metcalfe2000, Reference Metcalfe2013; Hara et al. Reference Hara, Kurihara, Kuroda, Adachi, Kurita, Wakita, Hisada, Punya, Charoentitirat and Chaodumurong2010). This break-up may provide the tectonic rearrangement of these various tectonic units.
4.b Tectonics between Stages 2 and 3
Stage 2 of Japanese accretionary history is characterized by the accretionary complex of the Nedamo Belt (Uchino et al. Reference Uchino, Kurihara and Kawamura2005; Uchino & Kawamura, Reference Uchino and Kawamura2010), and Renge high-pressure metamorphic rocks, ranging in metamorphic age from 350 to 330 Ma (Tsujimori, Reference Tsujimori2010). They were formed near the Nedamo, Kurosegawa and Hida Gaien belts, which were developed along the South Kitakami – Kurosegawa Arc. As all of these tectonic units occur as tectonic blocks in serpentinite melanges, tectonic erosion and rearrangement may have occurred during the Late Carboniferous and Early Permian periods. This kind of tectonics caused the gap between Stages 2 and 3.
Permian accretionary complexes are developed in the Akiyoshi and Ultra-Tamba belts. Igneous activity occurred in the provenance area of these Permian accretionary complexes. These igneous products were transported into the trench to form a thick accretionary wedge in Stage 3, i.e. the Permian period.
4.c Tectonics between Stages 3 and 4
The South China Block was approaching the North China Block in the Permian period. These blocks collided with each other in the Triassic period (e.g. Zhai & Cong, Reference Zhai, Cong and Cong1996). In the Late Permian to Early Triassic period, there were two different types of accretionary complexes in Japan: the Akiyoshi–Suo complex and the Maizuru – Ultra-Tamba complex.
The Akiyoshi–Suo complex is composed of the Permian non-metamorphosed accretionary complex of the Akiyoshi Belt, and the Permian to Triassic high-pressure metamorphic rocks of the Suo Belt. These rocks were formed as a single accretionary complex at one time, but appeared separately during the exhumation process. The Maizuru – Ultra-Tamba complex is subdivided into the Permian arc complex of the Maizuru Belt (Ishiwatari, Reference Ishiwatari1985) and the Permian to Triassic accretionary complex of Ultra-Tamba Belt.
Kobayashi (Reference Kobayashi2003) suggested that the Maizuru – Ultra-Tamba complex was developed along the margin of the South China Block. However, recent work on detrital zircons from the Maizuru and Ultra-Tamba Belts suggests that sandstones were derived from both the South China and North China blocks (Fig. 11a). On the other hand, the Akiyoshi–Suo complex is characterized by detrital zircons from an active Permian volcanic arc, and contains no detrital zircons from the North China Block. Therefore, we reconstruct Permian palaeogeography as shown in Figure 11a. The Maizuru arc was developed between the North and South China blocks as a single arc, and the accretionary complex of the Ultra-Tamba Belt was developed along the Maizuru arc.
Palaeogeography of proto-Japan and North and South China blocks of Permian and Triassic age. (a) Permian (pre-collision period), (b) Triassic (post-collision period).

The Akiyoshi–Suo complex is unconformably overlain by Middle to Late Triassic formations of coastal to slope facies, such as the Atsu, Mine and Nariwa Groups. The detrital zircon patterns from sandstones of these formations are very different from those of Permian sandstones of the Akiyoshi–Suo complex (Fig. 7). U–Pb ages of detrital zircons of these formations include ages of 1500–1250 Ma, as well as 500 Ma and younger ages, but exclude ages between 600 and 1500 Ma. These age patterns suggest that the detrital zircon of the sandstone of these formations was derived from the North China Block. As the youngest detrital zircon is much older than the depositional age of the formations shown by fossils, volcanic activity did not occur during the deposition of these formations. Sediment transport from the North China Block and the absence of volcanic activity were caused by the collision between the South and North China blocks, and by the overthrusting of the North China Block over the South China Block following the collision (Fig. 11b). Recently Isozaki et al. (Reference Isozaki2014, Reference Isozaki, Nakahata, Zakharov, Popov, Sakata and Hirata2017) proposed Greater South China. It includes the Korean Peninsula, the Khanka massif and the Bureya–Jiamsi massif as well as the South China Block. However, the result of zircon age dating showed that the collision of the South and North China blocks influenced the supply of detrital grains both in forearc formations and in accretionary complexes of the Japanese Islands (Fig. 6).
4.d Tectonics between Stages 4 and 5
After collision between the South and North China cratons, the direction of major plate subduction changed from northward to westward along the Asian continental margin. Oceanic plates moved northward together with the continental blocks until the amalgamation of these blocks (e.g. Metcalfe, Reference Metcalfe1994, Reference Metcalfe, Hall and Blundell1996 a, b, Reference Metcalfe2002, Reference Metcalfe2006). Collision of the South China and North China as well as Indochina blocks is a trigger to form a very long convergent margin along the eastern margin of the Asian continent.
Accretionary complexes of Stage 4, from the Late Triassic to the earliest Cretaceous period, were formed especially along the proto-Japan convergent margin (e.g. Isozaki, Reference Isozaki1996, Reference Isozaki1997 a, b, Reference Isozaki, Aoki, Nakama and Yanai2010 a; Maruyama et al. Reference Maruyama, Isozaki, Kimura and Terabayashi1997; Wakita, Reference Wakita2012, Reference Wakita2013). Accretionary complexes of the same age are widely distributed along the eastern margin of Asia from Sikhote Alin (Kojima, Reference Kojima1989) to Borneo Island (Wakita et al. Reference Wakita, Miyazaki, Zulkarnain, Sopaheluwakan and Sanyoto1998) via the Philippines (Zamoras & Matsuoka, Reference Zamoras and Matsuoka2004; Marquez et al. Reference Marquez, Aitchison and Zamoras2006) (Fig. 9). Recently, Zhou & Li (Reference Zhou and Li2017) provided evidence for a Jurassic accretionary complex in NE China. Although Middle to Late Triassic accretionary complexes are recognized locally in the Kyoto area (Sugamori, Reference Sugamori2006), major parts of these accretionary complexes were formed in the Middle to Late Jurassic time, when the intensity of volcanic activity was very high, as is shown by the detrital zircon concentration (Fig. 6).
The boundary between Stages 4 and 5 accretionary complexes is called the Butuzo Tectonic Line, recognized as an out-of-sequence thrust. The youngest age of the Stage 4 accretionary complex is Barremian, while the oldest age of the Stage 5 accretionary complex is Aptian. There is little time gap between them (Geological Survey of Japan, 2018). However, there is a big difference between them in their reconstructed ‘oceanic plate stratigraphy’ (OPS) (Wakita & Metcalfe, Reference Wakita and Metcalfe2005; Wakita, Reference Wakita2012, Reference Wakita2015; Kusky et al. Reference Kusky, Windley, Safonova, Wakita, Wakabayashi, Polat and Santosh2013). The oldest age of the OPS (i.e. age of basalt) in the Stage 4 accretionary complex is Early Carboniferous, while the oldest age of the Stage 5 OPS (i.e. age of basalt) is Tithonian (Fig. 3L). As the ages of basalt imply the age of oceanic plate, there are big differences in age of subducting ocean plate between the accretionary complexes of Stages 4 and 5.
Ridge subduction and collision in Cretaceous time has been proposed by several authors (Kiminami et al. Reference Kiminami, Miyashita and Kawabata1994; Kinoshita, Reference Kinoshita1995; Sakaguchi, Reference Sakaguchi1996; Maruyama et al. Reference Maruyama, Isozaki, Kimura and Terabayashi1997; Isozaki, Reference Isozaki2000; Isozaki et al. Reference Isozaki, Aoki, Nakama and Yanai2010 a, Reference Isozaki, Maruyama, Nakama, Yamamoto and Yanai2011). However, oceanic ridge subduction cannot cause the big gap in age of the subducted oceanic plates. Tectonic erosion is necessary to form the big gap in the age of the oceanic plates (Suzuki et al. Reference Suzuki, Maruyama, Yamamoto and Omori2010). Although there is little gap in total accretion ages between the two accretionary complexes of Stages 4 and 5, there is a big gap between them in each location where two types of accretionary complexes are in contact along the Butsuzo Tectonic Line. Tectonic erosion occurred gradually from place to place during Early Cretaceous time. The shift of local tectonic erosion may have occurred due to the subduction of large buoyant blocks like oceanic plateaux. The Mikabu Ophiolite of the Sambagawa Belt is one candidate for a subducted oceanic plateau, which caused tectonic erosion between the accretionary complexes of Stages 4 and 5.
5. Palaeogeographic position of proto-Japan throughout the Phanerozoic
We have divided Japanese accretionary history into six stages. In this section, we will show the palaeogeographic position of proto-Japan for each stage (Fig. 12). Various authors have proposed the palaeogeographic and tectonic syntheses for Japanese geologic units during Phanerozoic time (e.g. Maruyama et al. Reference Maruyama, Isozaki, Kimura and Terabayashi1997; Isozaki, Reference Isozaki1998, Reference Isozaki2000, Reference Isozaki2012; Isozaki et al. Reference Isozaki, Aoki, Nakama and Yanai2010 a, b, Reference Isozaki, Aoki, Sakata and Hirata2014, Reference Isozaki, Nakahata, Zakharov, Popov, Sakata and Hirata2017; Ishiwatari & Tsujimori, Reference Ishiwatari and Tsujimori2012; Okawa et al. Reference Okawa, Shimojo, Orihashi, Yamamoto, Hirata, Sano, Ishizaki, Kouchi, Yanai and Otoh2013). Moreover, various attractive syntheses have been proposed for East and Southeast Asia (e.g. Metcalfe, Reference Metcalfe2006; Oh, Reference Oh2006; Wang et al. Reference Wang, Zhou, Zhang, Ying, Zhang, Wu and Zhu2006; Safonova et al. Reference Safonova, Kotlyarov, Krivonov and Xiao2017).
Phanerozoic palaeogeography of East and Southeast Asia from Stages 1 to 6. (a) Stage 1 (Cambrian to middle Devonian), (b) Stage 2 (late Devonian to Carboniferous), (c) Stage 3 (Permian to early Triassic), (d) Stage 4 (middle Triassic to early Cretaceous), (e) Stage 5 (middle Cretaceous to Palaeogene), (f) Stage 6 (Neogene to present).

5.a Palaeogeography in Stage 1 (Cambrian to Middle Devonian period)
In Stage 1, the South China and North China blocks were a part of Gondwana before the opening of Palaeo-Tethys (Duan et al. Reference Duan, Meng, Wu and Ma2012). Therefore, most of the geologic entities were formed along the continental margin of Gondwana. Isozaki et al. (Reference Isozaki, Aoki, Nakama and Yanai2010 a) suggested that proto-Japan was born as an immature volcanic arc formed by subduction between two oceanic plates. This tectonic setting is supported by the presence of ophiolite of about 580 Ma and granite of 520 Ma. Oceanic plate subduction occurred from the Palaeo-Pacific side of Gondwana. The Palaeo-Pacific Plate was born from the break-up of the Rodinia Supercontinent (Isozaki et al. Reference Isozaki, Aoki, Nakama and Yanai2010a). The geologic entities recorded in the South Kitakami and Kurosegawa belts were formed in an immature arc along the Gondwana margin in Stage 1 (Fig. 12a).
5.b Palaeogeography in Stage 2 (Late Devonian to Carboniferous period)
In Stage 2, Palaeo-Tethys was born along the margin of Gondwana, and the South China, North China and Indochina blocks were gradually detached from Gondwana. Consitituents of the South Kitakami and Kuroswagawa belts were formed in a continental arc along the margin of the South China Block, as the detrital zircon data suggest. Carboniferous accretionary complexes of the Nedamo Belt, and its metamorphic equivalents in the Renge Metamorphic Belt, were formed along an immature arc offshore of Gondwana (Fig. 12b).
5.c Palaeogeography in Stage 3 (Permian to Early Triassic period)
In Stage 3, active volcanism occurred in an island arc offshore of the Palaeozoic Asian continent where there was no active volcanism. The Akiyoshi accretionary complex was not developed directly on the South China Block, but along an offshore volcanic arc (Fig. 12c). The Maizuru arc was located between the North and South China blocks, and was a volcanic arc which acted as a bridge between two major continental blocks (Fig. 11a). Palaeontological data support the intimate relationship between the Maizuru Belt and the South China Block (e.g. Kobayashi, Reference Kobayashi2003). The Ultra-Tamba accretionary complex was formed in front of the Maizuru arc from the Permian to the Early Triassic. A Late Permian to Early Triassic accretionary complex formed alongside the Akiyoshi accretionary complex of the Early to Middle Permian period, and became the low-temperature – high-pressure metamorphic rocks of the Suo Belt. This metamorphism is contemporaneous with the collision between the South and North China blocks.
5.d Palaeogeography in Stage 4 (Middle Triassic to early Cretaceous period)
In the Middle Triassic period, collision and amalgamation occurred between the major continental blocks, North China, South China, Indochina and Sibumasu (Fig. 12d). In Stage 4, westward subduction of the Izanagi Plate became dominant, after the cessation of northward migration of the continental blocks detached from Gondwana. Subduction of the Izanagi and Meso Tethys plates caused igneous activity along the eastern and southern margins of the Asian continent (Fig. 9).
Palaeogeographic reconstruction for Japan and adjacent areas in Stage 4 has been proposed by various authors, such as Chough et al. (Reference Chough, Kwon, Ree and Choi2000, Reference Chough, Kwon and Ree2013), Isozaki et al. (Reference Isozaki, Aoki, Nakama and Yanai2010 a, b, Reference Isozaki, Maruyama, Nakama, Yamamoto and Yanai2011) and Ishiwatari and Tsujimori (Reference Ishiwatari and Tsujimori2012). These research results revealed that the collision between the South and North China blocks also caused tectonic rearrangement of various tectonic units on the East Asian continental margin. Li et al. (Reference Li, Jahn, Zhao, Dai, Li, Suo, Guo, Wang, Liu, Lan, Zhou, Zhen and Wang2017) suggested that in the Triassic the North China Block was subducted southeastward beneath the South China Block. This suggestion is not supported by the occurrence of detrital zircons in the accretionary complexes of Japan (Fig. 6).
5.e Palaeogeography in Stage 5 (middle Cretaceous to Palaeogene period)
By the amalgamation of continental blocks derived from Gondwana, the Eurasian Continental Plate was formed in Stage 5 (Fig. 12e). The mid-oceanic ridge between the Pacific and Izanagi plates was approaching the eastern margin of the Eurasian continent (Seton et al. Reference Seton, Flament, Wittaker, Müller, Gurnis and Bower2015). Subduction of this oceanic ridge caused extensive igneous activity in the continental arcs of East and Southeast Asia. Neo-Tethys subduction also produced igneous activity along the southern margin of the Asian continent.
5.f Palaeogeography in Stage 6 (Neogene to Quaternary period)
In Cenozoic time, several marginal basins were developed in the western Pacific region. The Japan Sea basin opened in Early to Middle Miocene times. At the same time, subduction of the Philippine Sea Plate started along the Nankai Trough in SW Japan. By the opening of the Japan Sea, Japan became detached from the Eurasian continent as an island arc (Fig. 12f).
5.g Palaeogeographic position of proto-Japan in the globe
Palaeogeographic reconstructions including Japan have been proposed by various authors (e.g. Maruyama et al. Reference Maruyama, Isozaki, Kimura and Terabayashi1997, Metcalfe, Reference Metcalfe2006; Oh, Reference Oh2006; Isozaki et al. Reference Isozaki, Maruyama, Nakama, Yamamoto and Yanai2011; Seton et al. Reference Seton, Müller, Zahirovic, Gaina, Torsvik, Shephard, Talsma, Gurnis, Turner, Maus and Chandler2012; Torsvik et al. Reference Torsvik, Voo, Preeden, Mac Niocaill, Steinberger, Doubrovine, Van Hinsbergen, Domeirer, Gaina, Tohver, Meert, Mccausland and Cocks2012; Cawood et al. Reference Cawood, Wang, Xu and Zhao2013; Okawa et al. Reference Okawa, Shimojo, Orihashi, Yamamoto, Hirata, Sano, Ishizaki, Kouchi, Yanai and Otoh2013; Wright et al. Reference Wright, Zahirovi, Müller and Seton2013; Metcalfe et al. Reference Metcalfe, Henderson and Wakita2017; Safonova et al. Reference Safonova, Kotlyarov, Krivonov and Xiao2017). Isozaki et al. (Reference Isozaki, Aoki, Nakama and Yanai2010a, Reference Isozaki, Maruyama, Nakama, Yamamoto and Yanai2011) suggested that most of the geologic entities of proto-Japan were formed along the South China margin following the break-up of the supercontinent Rodinia, about 750 Ma ago. However, the South China Block was a part of Gondwana until its break-up in the Devonian, and was shifted northward and rotated until its collision and amalgamation with the North China Block.
The present authors propose new positions for proto-Japan for the six tectonic stages related to the formation of accretionary complexes in Japan. Based on the present proposal, the palaeogeographic position of proto-Japan though the Phanerozoic time is reconstructed in Figure 13. In the Early to Middle Palaeozoic era (Stage 1), proto-Japan was located on the continental margin of Gondwana. At the end of Middle Palaeozoic time (Stage 2), the Palaeo-Tethyan ocean opened by the break-up of the Gondwana margin. In the Late Palaeozoic era (Stage 3), continental blocks detached from Gondwana were assembled along the eastern margin of the Tethyan Ocean, where the North and South China blocks were approaching each other. In the Middle Triassic period (Stage 4), the North and South China blocks collided, with the former being overthrust on the latter. Detrital zircons both of North and South China origin are common in the accretionary complexes of Japan after the collision at this stage. In Late Cretaceous to Palaeogene time (Stage 5), a unified Asian continent was formed, and extensive igneous activity occurred all around the Pacific Ocean margin, including the eastern margin of the Asian continent. From the Miocene to the present (Stage 6), an arc–trench system was established in Japan after the opening of the Japan Sea and the subduction of the Philippine Sea Plate beneath the Honshu Arc in SW Japan.
Palaeogeography in globe through Phanerozoic time, showing the position of proto-Japan (modified from Scotese, Reference Scotese2002 and Torsvik et al. Reference Torsvik, Voo, Preeden, Mac Niocaill, Steinberger, Doubrovine, Van Hinsbergen, Domeirer, Gaina, Tohver, Meert, Mccausland and Cocks2012).

Supplementary material
To view supplementary material for this article, please visit https://doi.org/10.1017/S0016756818000742.
Acknowledgements
The authors would like to express their gratitude to Yildirim Dilek of Miami University and Dr Yujiro Ogawa of Tsukuba University for the opportunity to submit this paper and for their critical review of it. We thank Dr A. J. Barber of Royal Holloway University of London, and Dr Ian Metcalfe for their critical review of this paper as reviewers. We also wish to acknowledge Drs Koshi Yamamoto and Makoto Takeuchi of Nagoya University for allowing us to use their inductively coupled mass spectrometer and for their support on detrital zircon dating. We also thank Drs Kazuhiro Miyazaki and Yutaka Takahashi of the Geological Survey of Japan for fruitful discussion on the geology of Japan and Asia. This work was supported by JSPS KAKENHI Grant Number JP16K05579.