INTRODUCTION
Variety selection is a crucial management decision affecting the success of commercial agricultural enterprises, and is regularly employed as a tool to mitigate production limitations imposed by biotic and abiotic factors. Although influenced by industry characteristics (Mordocco et al., Reference Mordocco, Stringer and Cox2007), technological information (Pillay, Reference Pillay1999) and personal preference, the inherent difficulty associated with variety selection and adoption originates from the existence of genotype-by-environment interaction (GEI). Numerous scientific studies have focused on GEI over the past few decades, and a wide range of statistical techniques and models have been developed to interpret and exploit this phenomenon. Most GEI studies have focused on the design of breeding programmes through analysis of pre-release variety trial data, while less literature has been published on GEIs of released commercial varieties (Gilbert et al., Reference Gilbert, Shine, Miller, Rice and Rainbolt2006). In most studies, the environment component of GEI is comprised of location and year effects (Gauch, Reference Gauch1992; Ma'ali, 2009). Grower management decisions may also characterize an environment, and must be considered when significant influence on crop productivity is observed. This is implied by Yan and Kang (Reference Yan and Kang2003), who state that an environment may be defined as the sum total of circumstances surrounding or affecting an organism or a group of organisms.
For example, in the South African sugarcane industry yield variability has been attributed to age at harvest (Inman-Bamber, Reference Inman-Bamber1985), and significant genotype-by-age interactions have been recently reported (Ramburan and Sewpersad, Reference Ramburan and Sewpersad2009). Additionally, the milling season proceeds from April to December, and varietal adaptability to either early, mid or late season harvesting is an important consideration, as differential sucrose accumulation patterns during the season have been observed (Redshaw and Nuss, Reference Redshaw and Nuss2001). These maturity patterns must be considered with other agronomic characteristics such as seasonal pest and disease prevalence, or ratoon emergence during winter, when deciding on the optimal season to harvest different varieties. These factors together with water regime (irrigated v. rainfed) adaptability, environmental yield potential adaptability and the prevalence of eldana (Eldana saccharina), the most important pest in the industry, are confounded with regions, leading to complex GEIs. Such confounding interactions have necessitated regional selection programmes (Parfitt, Reference Parfitt2005), supported by regional post-release variety evaluation and recommendation strategies (Ramburan et al., Reference Ramburan, Redshaw and Van Den Berg2007). The above factors can be exploited by grower management decisions within a farming system, and the impact of such decisions on variety selection should be clear.
With approximately 22 varieties available for commercial planting per mill supply area, variety selection for growers in the South African sugarcane industry has proven to be a complicated task, leading to numerous calls for the development of appropriate selection tools to supplement current extension efforts. Although decision support systems (DSSs) are commonly used at the South African Sugarcane Research Institute (SASRI) (van den Berg and Smith, Reference van den Berg and Smith2005), no DSS currently exists for variety selection. Previous attempts to quantify varietal differences in crop growth under varied environmental conditions and to incorporate these differences into a DSS have highlighted the difficulties associated with this (Redshaw and Bezuidenhout, Reference Redshaw and Bezuidenhout2003). Large variety numbers, complicated optimization calculations and the desire for specific system outputs (i.e. to calculate exact monetary profit) limited the functionality and application of a potential DSS. These challenges are not unique to sugarcane and are reflected by the nature of existing web-based variety selection DSSs for most crops, where the systems tend to provide information on variety traits and yield performance in a structured manner to aid selection (Jensen, Reference Jensen2001), rather than take into account user-defined environmental and management conditions.
Although the South African sugarcane industry is characterized by broad mega-environments with environmental and management differences, variety selection follows a logical hierarchy of explanatory factors (based on above-mentioned issues, unique to the industry) that growers may consider to arrive at a sub-set of varieties suitable for their conditions. A structured, regional G × E analysis targeting such factors individually may allow for the characterization of varieties, which can subsequently be utilized in a basic DSS. The objectives of this study were (i) to characterize varieties in terms of age, season, and yield stability, (ii) to develop a simplistic DSS based on common industry considerations for variety selection, and (iii) to validate the DSS against expert opinion.
MATERIAL AND METHODS
Trial details
Trial data from 628 individual variety trials harvested between 1975 and 2008, as part of SASRI's variety evaluation project, were extracted from a relational trial database (Bezuidenhout, Reference Bezuidenhout1998). All field trials consisted of between eight and twelve varieties planted in randomized complete block designs with four to six replications. Plot sizes ranged from three to four net rows that were between 8 and 10 m long, and spaced 1 to 1.4 m apart. On average, the plant crop and three ratoons (regrowth after each harvest) were harvested from each crop. Agronomic measurements, including cane yield (t ha−1), estimated recoverable crystal % (ERC%), and ERC yield (t ha−1 × ERC%), were determined in all trials. Standard analysis of variance (ANOVA) and restricted maximum likelihood (REML) procedures (Patterson and Thomson, Reference Patterson and Thompson1971) were used to analyse individual trials, and both plot and treatment data were routinely captured together with site and trial characteristics in the relational database. The treatment means from trials were extracted as a dataset and subjected to further combined analyses.
Statistical analyses
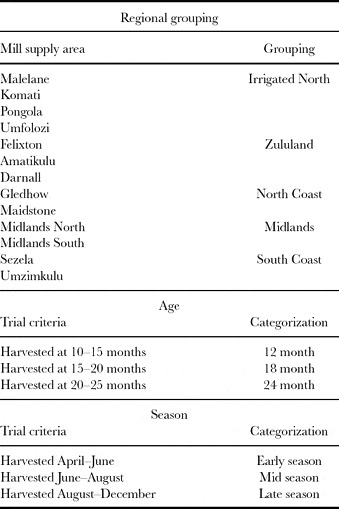
Trial data were grouped into regions and further categorized into different age and season of harvest according to Table 1. The categorized regional datasets, which were unbalanced as all varieties were not planted in all trials, were analysed using REML meta-analysis (Genstat.version10). Variety, age, and variety × age were considered as fixed effects, while ‘replicate within age’ was considered as a random term. Similar analyses were conducted with the variety × season interaction. While variety × age × season interactions are likely to exist within regions, only two-way interactions were considered for the purposes of this study, i.e. to characterize varieties for DSS development. As a result, age and season were considered independent and analysed separately. Estimated recoverable crystal yield (t ERC ha−1), which is a measure of the Recoverable Value cane payment system in South Africa, was considered most important and was the only variable analysed. Statistical significance for any fixed effect was tested by calculating the F-ratio, using the degrees of freedom from the relevant error stratum. The Holm–Sidak all-pairwise multiple comparison test was used to test significant differences between treatment means at the 5% level of significance, and these differences were interpreted into appropriate (yes/no) varietal characterizations for further application in a DSS.
Regional groupings of mill supply areas in the South African sugar industry with variety trial categorizations for age of harvest and season of harvest.

Varietal stability was evaluated using the sites regression model popularized by Finlay and Wilkinson (Reference Finlay and Wilkinson1963) and reviewed by DeLacy et al. (Reference De Lacy, Basford, Cooper, Bull, McLaren, Cooper and Hammer1996). In this model, the GEI is partitioned into a component due to regression of genotypes on environment (trial) means:

where Yij is the average yield of the ith genotype in the jth trial, m is the overall mean, gi is the effect of the ith genotype, ej is the effect of the jth environment, bi is the regression coefficient for genotype i and pij is the residual effect. Stability of ERC yield and adaptability of varieties within regions were interpreted from the slope of the regression curves based on a grouping, where bi < 0.8 = ‘low potential adaptability’, where bi is between 0.8 and 1.2 = ‘stable’, and where bi >1.2 = ‘high potential adaptability’.
Decision support system development and testing
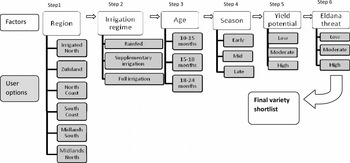
The stability class, together with the age and season characterization were evaluated with other industry issues such as government legislation (varieties permitted in specific regions only because of disease), water regime recommendations (rainfed, supplementary irrigation, full irrigation) and eldana resistance of varieties, and interpreted into ‘yes/no’ criteria for application to a relational database. These factors were considered as the most important and logical grower considerations when selecting varieties, and were therefore included as priorities in the DSS development. The database was linked to a web interface that prompts users for specific inputs in a logical six-step sequence (Figure 1). Varieties meeting the specified criteria at each stage are carried over to the following input stage, until a short list of appropriate varieties are displayed at the end with links to detailed information sheets. The system was tested by comparing outputs against expert opinion (extension specialists) for common production scenarios in each region. Two-sample paired t-tests were used to determine significant differences between the size of variety sets chosen by the DSS and experts. The percentage of DSS selections that corresponded exactly to expert selections was also calculated, and the success of the system was evaluated as the percentage of DSS selections that were deemed acceptable by experts.
A schematic representation of the stepwise decision process in the DSS indicating factors and user options.

RESULTS
Age and season of harvest
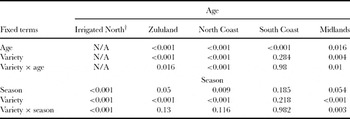
Harvest age produced highly significant (p < 0.001) differences in the Zululand, North and South Coast regions, while differences in the Midlands region were significant at p < 0.05 (Table 2). Harvest age was not a consideration in the Irrigated North as cane is only harvested on a 12-month cycle in this region, and consequently no variety × age analyses were necessary. Highly significant differences in age were observed in the Zululand and North Coast regions, while the Midlands region showed varietal differences at p < 0.05. The South Coast did not produce any significant variety responses or variety × age interaction, suggesting that age (p < 0.001) is a dominating component in that region. The variety × season analyses indicate that varieties produced highly significant differences in ERC yield in four out of five regions, and that the season effect was not as pronounced as age in general. The Midlands and Irrigated North regions produced significant variety × season interactions, while no significant effects were observed on the South Coast. All further analyses focused on the variety × age and variety × season interactions.
p-values of fixed terms for ERC yields (tons ERC ha−1) in five regions for age of harvest and season of harvest.

†N/A: Not applicable. All cane is harvested on a 12-month cycle in the Irrigated North, so no variety × age analyses were made.
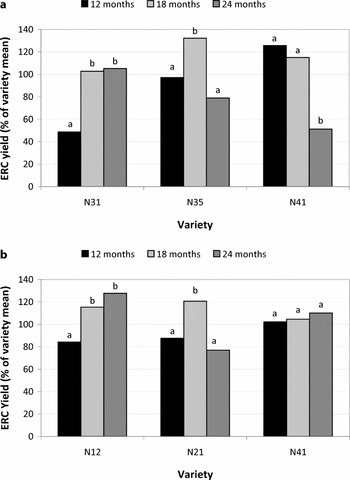
Despite certain non-significant interactions (Table 2), the variety × age and variety × season effects were interpreted individually for varieties within regions to arrive at a final characterization. Figure 2 indicates the differential ERC yields of varieties at different harvest ages, expressed as a percentage of the varieties’ mean yield in the Midlands and North Coast regions. The adaptability of variety N31 to the 18- and 24-month cycle is in contrast to the adaptability of N41 to the 12 and 18-month cycles in the Midlands, while variety N35 shows clear suitability to the 18-month harvest only (Figure 2a). Similarly, N12 shows adaptability to older harvesting while N21 only performs significantly above its mean when harvested at 18 months in the North Coast (Figure 2b). The variety N41 shows a significant decline in ERC yield with age in the Midlands (Figure 2a); however, non-significant yield improvements are detected with this variety with older crops in the North Coast (Figure 2b). This demonstrates the importance of regionalized analyses of variety responses as opposed to an across-the-board approach and therefore justifies the methodology employed in this study. Varietal responses to harvest age within regions were interpreted as above, and final characterisations of all varieties were implemented in the DSS.
Variety × harvest age interactions in the Midlands (a) and North coast (b) regions. Bars with the same letters represent no significant differences between harvest ages, within varieties.

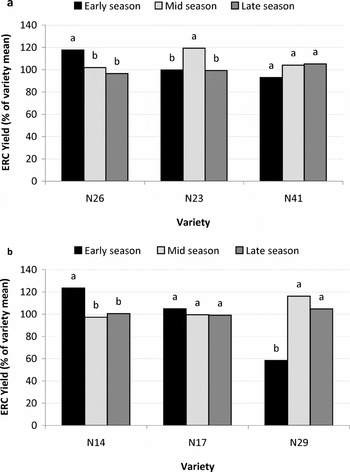
Similarly, the variety × season interactions were interpreted with focus on within-variety responses as opposed to between-variety responses, as demonstrated in Figure 3a and 3b in the Irrigated North and South Coast Regions, respectively. The variety N26 shows adaptability to early season harvesting, N23 performs significantly better when harvested mid season, and N41 shows average ERC yields when harvested throughout the season in the Irrigated North region (Figure 3a). Comparable responses are observed in the South Coast region where N14 and N29 exhibit adaptability to early and late season harvesting, respectively, while N17 shows general adaptability to all-season harvesting (Figure 3b). Such responses were interpreted and characterizations adjusted in relation to common agronomic production constraints in certain regions before being fed into the DSS, e.g. late season harvesting of sugarcane mosaic virus susceptible varieties (although suited to late season harvesting in terms of ERC yields) in the Irrigated North region was avoided as disease levels are higher during this period.
Variety × season interactions in the Irrigated North (a) and South Coast (b) regions. Bars with the same letters represent no significant differences between seasons, within varieties.

Yield stability
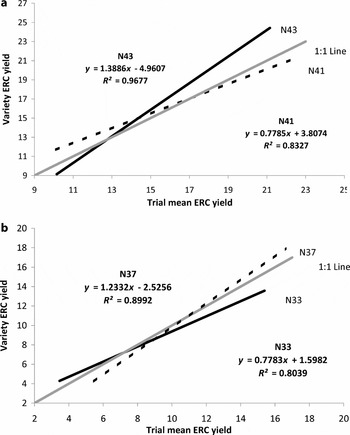
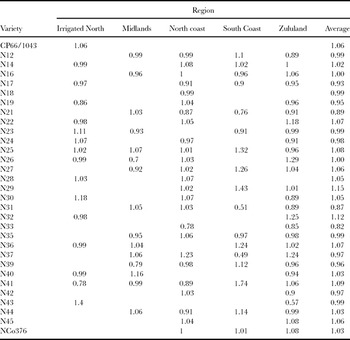
Regression coefficients (bi) of variety means regressed against trial means indicated wide genetic adaptability and stability within the SASRI variety pool, and Figure 4a and b exemplifies this variability in the Irrigated North and North Coast regions, respectively. In the Irrigated North, variety N43 exhibits distinct adaptation to high yield potential conditions compared to N41, which performs better than the trial mean under low potential conditions (Figure 4a). Similarly, in the North Coast region, variety N37 and N33 exhibit contrasting adaptation responses to yield potential conditions (Figure 4b). Appropriate values for bi were determined for all varieties gazetted for planting in specific regions to accurately characterize varieties in contrasting environments (Table 3). The variability in bi of specific varieties across regions demonstrates the diversity of environments constituting the South African sugar industry. For example, N19 shows adaptability to moderate to low potential conditions in the higher-yielding Irrigated North (bi = 0.86), while being fairly stable in the average-yielding North Coast (bi = 1.04). Similarly, variety N29 was stable in the Zululand region (bi = 1.01), while exhibiting suitability to very high potential conditions in the South Coast (bi = 1.43), which is a region known for lower environmental potential (hence the extreme bi values). The variability in bi for varieties between regions suggests that these values should be interpreted relatively in order to formulate an accurate characterization within regions. This once again justifies the regionalized methodology for varietal characterization required in this study.
Regressions of variety means on environmental means in the Irrigated North (a) and North coast (b) regions.

Regression coefficients of variety means against environmental means in five regions of the South African sugar industry.

Decision support system testing
Figure 5 shows the performance of the DSS relative to expert selections for a different number (n) of production scenarios in each of the five regions. In all regions the variety sets selected by the DSS were always larger (significant at p < 0.05 and p < 0.01 in some cases) than the sets chosen by experts. For example, in the Zululand region where a total of 20 scenarios were tested, the DSS selected on average approximately six varieties per scenario while experts selected approximately four. Of the six varieties selected by the DSS, 74% corresponded exactly with expert opinion. Similarly, proportions of 65, 85, 83, and 63% were observed in the Irrigated North, South Coast, North Coast, and Midlands regions respectively (Figure 5). Figure 5 also indicates the frequency of success of the DSS, where success was defined as the average% of DSS selections that were deemed acceptable by experts. The results show that in all regions more than 70% of the DSS selections were accepted by experts, and when combined across regions (n = 76), the average success was approximately 84%. In terms of average performance, experts were shown to select approximately five varieties per scenario while the DSS selected approximately six, and 73% of these corresponded exactly with expert opinion.
Average and regional performance of DSS relative to expert opinion. Percentages in unshaded bars indicate % of DSS selections that corresponded exactly to expert selections; *, **, and n.s. represent differences at p < 0.05, p < 0.01, and no significant difference, respectively.

DISCUSSION
The approach adopted in developing the DSS in this study represents a basic strategy to minimize variety options based on broad environmental and farming system criteria. The objective of the system is to produce a range of ‘acceptable’ varieties that conform to user specifications, as opposed to selecting superior performers for such conditions. The latter objective is envisaged as a follow-up process that will consider detailed yield and quality responses of varieties to important environmental factors. This will involve interpretation of multi-environment trial data together with environmental drivers, which will then represent inputs into the DSS. Also, the statistical methodology employed in this study could be criticized, as generalized REML and regression techniques were used to broadly characterize varieties. However, the complex higher order interactions comprising varieties, regions, age, season, soil type, irrigation regime, etc. present in the industry, which are difficult to interpret, necessitate a staggered/phased strategy to DSS development. The somewhat qualitative approach employed in the methodology serves to filter variety selections before extensive GEIs, which are explicit in this study, can be further interpreted.
The factors investigated in this study were selected based on industry knowledge and previous studies highlighting the importance of age (Ramburan and Sewpersad, Reference Ramburan and Sewpersad2009), season (Redshaw and Nuss, Reference Redshaw and Nuss2001) and eldana resistance (Ramburan and Sewpersad, Reference Ramburan and Sewpersad2009). Similar age and season (Gilbert et al., Reference Gilbert, Shine, Miller, Rice and Rainbolt2006) effects have been reported in other sugarcane industries, further justifying their selection as priority factors here. In this study, the influence of environment is captured rather broadly through the use of regression analysis, and it was assumed that environmental yield potential adaptability would act as a surrogate for the cumulative effect of soil and climatic variables on variety performance. Further quantification of the contribution of different environmental covariates is necessary, as effects of dominant drivers such as rainfall and temperature need to be evaluated against age and season effects to establish a logical hierarchy that can be utilized to refine the DSS. This is also alluded to by Lawes and Lawn (Reference Lawes and Lawn2005), who indicated that compared to other crops, there is less knowledge about the hierarchy of explanatory factors affecting sugarcane yields. The existing system was designed with an administrator interface which will easily allow addition of further explanatory factors.
The regionalized analysis employed in this study was necessary due to the variation in soil and climatic conditions constituting the industry, and this is supported by the differences in regressions coefficients of varieties across regions. Genotypic stability was also evaluated and confirmed through the regionalized analysis, as certain varieties like NCo376 (used as a standard in the industry) produced stable and similar regression coefficients in the three regions that it is gazetted for planting. While it is acknowledged that these regression coefficients are influenced by the number of trials that a variety was evaluated in, as well as the performance of other varieties evaluated in the same trials (Crossa, Reference Crossa1990), the methodology was considered appropriate for the objective of broad variety characterization in this qualitative first phase of DSS development.
In this study success, was evaluated by the percentage of DSS selections that were deemed acceptable by experts, resulting in an overall success of 84% which was considered a good performance. However, the DSS also selected incorrect varieties. An examination of the incorrect selections in each region revealed that such varieties had either shown poor past performance in a region, were associated with a major pest or disease, or were simply not adopted by growers yet, thereby not favouring selection by experts. This highlights the difficulty associated with developing a DSS where certain elements are in constant flux and are dependent on aspects such as personal opinion. Yielding ability could be accounted for through analysis of multi-environment trial data which could be linked to the DSS; however, the probability of a variety succumbing to a new pest or disease, or the popularity of varieties amongst different grower groups are difficult to simulate. Nevertheless, for the purposes of reducing the variety pool from which to choose, a system that produces a variety list where 84% of the varieties would be recommended by field specialists as well, can be regarded as successful. A follow-up exercise will evaluate user feedback on aspects such as speed, reliability and simplicity.
Current variety selection DSSs provide yield, quality and trait data, from which users are expected to make appropriate selections. For example, the Australian National Variety Trial system (www.nvtonline.com.au) provides users with estimates of variety yields in specified states and regions, based on statistical analyses of multi-environment trial data. A similar system has been developed for various crops in Denmark (Jensen, Reference Jensen2001). Such systems, although comprehensive and user-friendly in many ways, still requires significant data analysis and interpretation on the part of the user. Additionally, these systems do not consider user-specified production scenarios. The system developed in this study not only considers user-specified conditions, but also limits the range of varieties that need further evaluation, thereby making interpretation of associated data (which will be linked to this DSS) much easier. The simplistic, stepwise, menu-driven interface highlights further advantages of this approach, as lack of simplicity is often considered a negative trait for DSS adoption (van den Berg and Smith, Reference van den Berg and Smith2005). Conversely, a criticism of the approach adopted is that testing of the system outputs could be regarded as subjective. ‘Expert selections’ are subject to personal preference and individuals’ knowledge of variety adaptation, and the comparison of a logical, computer-driven selection process to a method influenced by the human element, may be questionable. This is suggested by the greater number of selections made by the DSS (Figure 5), where aspects such as historical yielding ability, disease responses and variety popularity amongst growers could not be accounted for. Nevertheless, the study has shown that basic individual statistical analyses of priority factors affecting productivity can be employed to broadly characterize varieties, and such characterizations can be adapted successfully into a selection tool that conforms to advice from field experts.