

Sticks, norms and carrots
Nobody likes to pay taxes. Tax payments are compulsory and unrequited: people are legally obliged to make them but cannot expect any specific benefit in return like a piece of public property or preferential treatment in a public hospital. Why do people comply? One prominent answer is that people pay taxes because the government forces them to. The entire machinery of taxation operates under a deterrence approach (e.g. Feld et al. Reference Fooken, Hemmelgarn and Herrmann2006) that threatens noncompliant taxpayers with audits, fines and criminal punishment. An alternative answer holds that people pay taxes because society obliges them to. Taxes are at the heart of the social contract. They define what people owe to each other collectively. According to this civic duty approach, it is feelings of public responsibility that move people towards tax compliance (e.g. Kirchler et al. Reference Lamberton, De Neve and Norton2008).
Although deterrence threats and civic norms certainly raise tax compliance, they hardly ever ensure full compliance. Even in fairly well-administered and integrated societies, tax evasion is common. According to one estimate, for instance, the 28 member states of the European Union lose 864 billion euros in annual tax revenues to tax evasion (Murphy Reference Niederle and Vesterlund2012). Pressed by high spending requirements and high political obstacles to tax increases, some governments have recently experimented with recovering some of these losses through a new rewards approach to tax compliance. The idea is to curb tax evasion by providing positive rewards for individual tax compliance. Perhaps the most prominent example of this trend is the spread of receipt-based value added tax (VAT) lotteries. These lotteries incentivise correct invoicing by allowing consumers to submit purchase receipts as lottery tickets (Fooken et al. Reference Frey, Benz and Stutzer2014). Another example is a 2006 Spanish income tax law that allows Spanish taxpayers to earmark 0.7% of their income tax for a charitable purpose (European Research Network on Philanthropy Reference Feld and Freyn.d.).
In this article, we investigate the compliance effects of positive rewards. We focus on two types of rewards in particular. On the one hand, we analyse the effects of a lucky reward that links tax compliance to the chance of winning a lottery (along the lines of the VAT lottery). On the other hand, we examine a donation reward that allows compliant taxpayers to earmark their individual payments for specific spending purposes (along the lines of the Spanish income tax law). We hypothesised that both rewards increase the “procedural utility” (Frey et al. Reference Frey and Jegen2004) of the taxpaying situation to the taxpayer in ways that enhance compliance.
We tested this hypothesis in a laboratory experiment that compares tax compliance under the lucky and the donation treatment with tax compliance under a deterrence baseline. Our findings offer partial support. The evidence confirms that the two reward treatments significantly affect taxpayer behaviour (in line with the hypothesis). Yet, the rewards do not unambiguously increase tax compliance in all participants (contrary to the hypothesis). The reason is an interaction effect with gender. The reward treatments increase tax compliance in women but dramatically decrease compliance in men. This gender-by-treatment interaction is an important finding because it alerts policymakers and policy analysts to the general problem of gender heterogeneities in the treatment effects of tax reforms and other policy interventions (e.g. Alesina et al. Reference Alesina, Ichino and Karabarbounis2011). This should stimulate more political science research on gender differences in risk preference and social attitude (e.g. Croson and Gneezy Reference Cummings, Martinez-Vazquez, McKee and Torgler2009).
The rest of the article is structured into five parts. In the next section, we review the literature and elaborate our research question. Why study the effect of positive rewards on tax compliance? We then introduce our experimental setting and present our empirical findings. We explore explanations for the reward-by-gender interaction effect on tax compliance and end with a brief note on policy implications.
How to improve tax compliance?
“Governments need money. Modern governments need lots of money” (Steinmo Reference Stotsky1993, 1). Collecting this money is a tricky problem because incentives for tax evasion are pervasive. Governments have tried various approaches to tackling this problem. They can roughly be sorted into three groups: threat-based approaches that deter citizens into tax compliance, norm-based approaches that oblige citizens to comply and reward-based approaches that lure citizens into compliance. As a brief review of the literature will show, the first two approaches have attracted considerable attention in the empirical tax compliance literature, whereas research on reward-based approaches is still comparatively sketchy.
Threats
Perhaps, the most obvious way to ensure tax compliance is to criminalise noncompliance: governments deter citizens into paying taxes by the threat of audits, fines and legal prosecution. In Allingham and Sandmo’s (Reference Allingham and Sandmo1972) famous model, the level of tax evasion is directly and negatively associated with the probability of detection and the size of the fine.
The problem with the deterrence approach is that it is costly for the government and stressful for taxpayers. The government has to waste time, effort and personnel on hunting down tax evaders. The taxpayer has to worry about the dear consequences of inadvertent noncompliance. Both effects limit the viability and usefulness of the approach. Only about 1.1% of individual income tax returns were audited in the United States (US) in 2010 (Wood Reference Wood2011). However, a Google search (12 May 2015) for the word-string “tax stressful” turned up over 14 million internet pages with advice on how to reduce tax-season related stress. Apparently, even mild enforcement activity can cause great anxiety, presumably because taxpayers overweigh the low probability of being audited (Alm Reference Alm2011, 63). This anxiety, in turn, may have an “alienation effect” that inadvertently fuels evasion (Kinsey Reference Kirchler, Hoelzl and Wahl1992; Feld et al. Reference Fooken, Hemmelgarn and Herrmann2006, 6). As various empirical studies show, higher audit probabilities and fines do not unambiguously raise tax compliance (for a review see Kirchler et al. Reference Lamberton, De Neve and Norton2008, 214–215). In fact, they sometimes undermine it.
In 2007, the US Internal Revenue Service (IRS) introduced additional penalties for US citizens submitting incomplete tax returns ostensibly because the number of wrongful returns had been very high in the previous year. Although understandable, the approach was unsuccessful. Allegedly, it resulted in a 22% increase in tax fraud the following year. According to Martin and Dolan, “IRS policy makers fell afoul of their intended outcome by communicating a much more invasive and undercutting normative message: ‘look at all the people who are doing this unwanted thing’” (Reference McDermott2010).
Norms
Given the limitations of the deterrence approach, some authors emphasise the importance of “voluntary” compliance (e.g. Kirchler et al. Reference Lamberton, De Neve and Norton2008). In this perspective, it is not enough to threaten tax evaders by negative sanctions. It is also important to appeal to taxpayers’ sense of civic duty. To be sure, feelings of civic obligation vary in social and cultural factors. For instance, women tend to be more tax compliant than men (e.g. Friedland et al. Reference Gilligan1978; Spicer and Becker Reference Steinmo1980; van Dijke and Verboon Reference Druckman and Kam2010), religious believers are generally more compliant than nonbelievers (Torgler Reference Torgler2006) and some national and subnational cultures show higher tax morals than others (Torgler and Schneider 2007). Yet, there are also various ways in which the government can foster a citizen’s sense of civic duty.
One way is to improve citizen participation: giving citizens a say in government activities increases the likelihood that citizens perceive the taxes imposed on them as useful and fair. Historically, democracy was invented for the purpose of increasing tax compliance and revenue buoyancy (e.g. Tilly Reference Timmons and Garfias2009). Empirically, various studies have shown that democratic procedures increase tax compliance in laboratory settings (Alm et al. Reference Alm, Jackson and McKee1993; Wahl et al. Reference Wahl, Muehlbacher and Kirchler2010). Torgler (Reference Torgler2005) presents survey evidence indicating that direct democratic rights have a strong positive effect on tax morale in a cross-section of Swiss Cantons.
A second way to reinforce feelings of civic duty is by improving government performance: generally, citizens are more willing to pay if they feel the government delivers valuable public goods and services in return – i.e., if they trust the government not to waste their money. Svallfors (2013) presented survey evidence that citizens who perceive government institutions as efficient and fair are more likely to favour higher taxes in a sample of 29 European countries. A similar study of four African countries also showed a significant association of satisfaction with public services and positive tax compliance attitudes (Ali et al. Reference Ali, Fjeldstad and Sjursen2014). Corruption, by contrast, depresses tax collections (Timmons and Garfias Reference Torgler2015). Experimental approaches also suggest that the provision of public goods increases tax compliance (Torgler Reference Torgler and Schneider2002, 671).
Finally, the sense of civic duty can be increased by reciprocation: if the government wants to be trusted by its citizens, it has to show trust in citizens in return. Respectful treatment of taxpayers by tax officials has been shown to promote tax compliance (Feld and Frey Reference Feld, Frey and Torgler2007). Fair procedures, equal treatment of taxpayers at the individual and group level, the avoidance of overly inquisitive audits and a user-friendly tax administration are also hypothesised to increase tax compliance (Kirchler et al. Reference Lamberton, De Neve and Norton2008). The easier it is for citizens to comply with the tax system, the less likely it is that they feel alienated and harassed by it. Various governments experiment with administrative reforms to make life easier for taxpayers (Alm et al. Reference Alm, Cherry, Jones and McKee2010). Singapore, for instance, has moved from a hard-copy filing system to a paperless electronic system and a one-stop service to answer enquiries. It also tried to change the attitude of tax officials towards taxpayers (Alm and Torgler Reference Alm and Torgler2011, 649, fn. 15). Moreover, in Romania, local governments have experimented with online payment systems to facilitate timely and correct tax payments.Footnote 1
Rewards
Even in a high-trust environment with a well-functioning government and civic-minded citizens, paying taxes remains a nuisance. Taxes are costly and people generally avoid expenses of any sort (Sussman and Olivola Reference Svallfors2011, S91). In addition, taxes are impersonal and do not give taxpayers any sense of individual ownership and agency (Lamberton et al. Reference Martin and Dolan2014, 2). Various governments have tried to mitigate these nuisance factors through positive rewards. The rewards can be either material or immaterial.
Material rewards usually come in the guise of lotteries. For instance, Taiwan operates a receipt-based tax lottery to increase sales tax (VAT) compliance since the 1950s. China introduced a VAT lottery in the 1990s (Wan Reference Wan2010). More recently, some European countries followed suit including Malta, Slovakia, Portugal and RomaniaFootnote 2 (Fooken et al. Reference Frey, Benz and Stutzer2014). Local authorities in Peru and Indonesia raffle off bicycles, cars and TV sets to incentivise payments of property taxes and motor vehicle taxes.Footnote 3 Martin and Dolan (Reference McDermott2010) recently suggested a lottery scheme to increase timely submissions of income tax declarations in the US.
Immaterial rewards aim to increase taxpayers’ sense of ownership by earmarking tax revenues for specific spending purposes (hypothecation). The underlying assumption is that citizens pay taxes more willingly if they know what they are paying for (Seely Reference Spicer and Becker2011). Social security contributions are perhaps the most common example of a hypothecated tax. Fuel taxes and green taxes are also often earmarked. Although hypothecation usually comes in the form of government self-binding (the government promises to use certain tax proceeds for specific purposes only), a few governments have taken the idea one step further and allow individual taxpayers to earmark their payments. Spain, for instance, allows individual taxpayers to allocate 0.7% of their income tax liability to either the Catholic Church or to charitable organisations or to the state (European Research Network on Philanthropy Reference Feld and Freyn.d.). Japan recently introduced a so-called hometown tax scheme under which city residents can allocate a proportion of their income tax payments to a rural town of their choice. Reportedly, the scheme is very popular with taxpayers. Yet, there are certain problems: taxpayers allocate their hometown taxes mostly to nice, touristy communities in attractive locations and forget about the drab rest of the country. Local governments, in turn, engage in a wasteful competition for taxpayers’ attention (The Economist Reference Tilly2015).
Although tax practitioners show a keen interest in positive rewards, the empirical tax compliance literature has largely ignored them so far (Feld et al. Reference Fooken, Hemmelgarn and Herrmann2006). There is limited research on tax lotteries. For instance, Wan presents observational evidence to suggest that the Chinese lottery has increased tax revenues (Reference Wan2010). The largely anecdotal research on Europe shows mixed results in contrast. Although tax lotteries seem to be popular, their revenue and compliance effects are unclear (Fooken et al. Reference Frey, Benz and Stutzer2014, 15). Alm et al. (Reference Alm, Jackson and McKee1992) explored tax lotteries in a laboratory setting. Their findings suggest that a lottery more effectively increases compliance than the two alternative reward strategies – fixed rewards and audit reductions.
Unfortunately, Alm et al.’s lottery treatment involves an uncommonly high probability of winning (one in 25) and an uncommonly low lottery prize (the average earnings of the entire experimental session). This tends to undermine experimental realism because the defining feature of real-world lotteries is a very low probability of winning combined with a very high prize. In the German case, for instance, the standard lotto offers a one in 140 million chance of winning a prize of, on average, 5.2 million euros. The low probability of winning makes lotteries fiscally attractive for governments; the high rewards make them attractive for consumers. High rewards are materially attractive because individuals tend to overweigh the low probability of winning the jackpot, and hence generally judge the attractiveness of lotteries by the size of the jackpot and not by the probability of winning it (Perez and Humphreys Reference Seely2013, 918). High rewards are also emotionally attractive. Research suggests that people buy lottery tickets because it makes them feel lucky, because it allows them to dream of a better life and because it is an enjoyable pastime activity shared and discussed with peers (Casey Reference Casey2008; Ariyabuddhiphongs Reference Ariyabuddhiphongs2011). There are good reasons, therefore, to expect a well-defined tax lottery to increase revenues at little fiscal costs.
To the best of our knowledge, there are no observational studies about the compliance effects of the Japanese or the Spanish tax hypothecation schemes. Laboratory research on radical hypothecation schemes is also lacking. Yet, Lamberton et al. have shown that giving taxpayers the opportunity to signal a nonbinding spending preference can raise tax compliance (Reference Martin and Dolan2014). Allegedly, two mechanisms account for this result. First, the signalling opportunity raises taxpayers’ awareness of the potential usefulness of their tax payment, and thus helps them mentally recoup payment and benefits. Second, the signalling opportunity turns taxpayers from pure policytakers into partial policymakers, and gives them a sense of authorship. Conceivably, a third mechanism reinforces these two: “warm glow giving” (Andreoni Reference Andreoni1990). To the extent that individual taxpayers are given influence over the use of their money they can more easily perceive themselves as benefactors of society, and indulge in the heart-warming feeling of being kind. As various studies on voluntary giving have shown, people sometimes happily and spontaneously spend money on others (Karlan and List Reference Kastlunger, Dressler, Kirchler, Mittone and Voracek2007; Meier and Stutzer Reference Murphy2008). Even compulsory contributions to charity can be a rewarding experience (Harbaugh et al. Reference Hasseldine and Hite2007). In conclusion, there are plausible reasons to believe that governments can increase voluntary compliance by giving individual taxpayers a real, rather than just an advisory, influence over public expenditure.
This article adds to the experimental research on positive rewards for tax compliance in two principal ways. First, it offers an experimentally realistic investigation of the compliance effects of tax lotteries using lower winning probabilities and higher prize amounts than Alm et al. (Reference Alm, Jackson and McKee1992). Second, it explores the compliance effects of a tax system that gives taxpayers a real, rather than just advisory (Lamberton et al. Reference Martin and Dolan2014), say in the selection of spending purposes.
The experimental design
The set-up
The set-up of our study resembles earlier tax compliance experiments (see Torgler Reference Torgler and Schneider2002 for an overview). The participants work for income, decide how much of this income to declare to the tax authority and then pay taxes on their declared income. Their tax declaration is subject to random audits. If participants are caught cheating, they are fined.
Two features help in giving the experiment a realistic “look” (“mundane realism”) and “feel” (“experimental realism”) (McDermott Reference Meier and Stutzer2002). First, we incorporated tax language and terminology in order to encourage participants to perceive the decision problem as a tax compliance problem and trigger the respective civic norms and concepts (see Cummings et al. Reference Croson and Gneezy2009, 452). Second, we embedded the experiment into the participants’ real-life situations. We recruited all the participants from among the students of a campus university (Jacobs University Bremen, Germany). The experimental tax revenues go directly to the representative student government. Therefore, they contribute to a “real” government providing “real” public goods on the campus (sports, entertainment, limited social assistance, education) from which the participants benefit only very marginally, if at all. In other experiments, by contrast, tax revenues were collected and redistributed among the small group of participants (e.g. Alm et al. Reference Alm, Jackson and McKee1993), and thus they resemble club goods more than public goods.
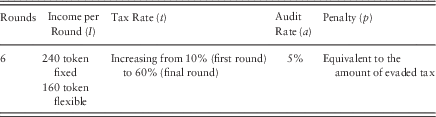
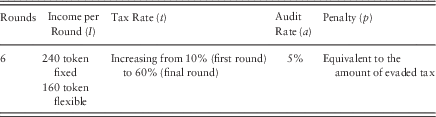
Table 1 summarises our exact settings. The experiment consisted of six rounds. In each round, the participants answered eight trivia questions on a computer. After each round, they received a fixed income of 240 tokens (100 tokens=1 euro), which increased by 20 tokens for each question answered correctly. After each round, they were informed of their income and were asked to fill in a tax declaration. The rate of tax increased from 10% in the first round to 60% in the final round to mirror the progressiveness of the income tax schedule. The tax declarations were audited with a probability of 5%. In a case of noncompliance, the participant was fined. The level of the fine was equivalent to the amount of tax evaded. Immediately after the experiment, the participants received their experimental gross income (minus fines) in cash, and were asked to pay their declared tax dues in cash in a separate, unobserved room. The collected taxes then went to the student government. The participants received detailed instructions in advance about the purpose and design of the experiment, and acknowledged this by signing a consent form. They were aware of the rules of the game – i.e., the pay scheme, the tax rates, the audit probability, the size of the fines, the conversion rate of tokens into euros and the recipient of their tax payments.
Experimental set-up of the tax system
The participants
The participants were selected from the student population of Jacobs University, a small campus university in Germany. We advertised the experiment through posters and flyers on campus. Interested students signed up online and were allocated an individual time slot in the laboratory. They entered the laboratory alone without any contact with other participants. After signing the consent form, they were led to a computer room in which they conducted the experiment in complete privacy behind a closed door and without seeing any other person, thus simulating the private setting in which most people prepare their tax declarations in the real world.
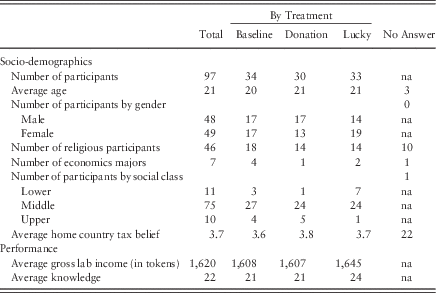
Table 2 provides descriptive data about the participants. A total of 97 students participated.Footnote 4 On average, the participants were considerably younger than the general population (age range 17–29 years) and, being students, they were also better educated.Footnote 5 The gender ratio was balanced. Roughly half of the participants identified themselves as being religious. Nearly three-quarters ranked themselves as middle class. Their disciplinary backgrounds were diverse. Only seven self-identified economics students participated in the experiment. Unfortunately, we could not directly check for the nationality of the participants. As Jacobs University is small (roughly 1,300 students) and very international (students come from more than 110 nations), this information would have compromised the participants’ anonymity. Instead we used the World Value Survey to control for home country tax morale: we ordered all countries covered by the World Value Survey according to their national attitudes towards tax evasion;Footnote 6 we then sorted the countries on the list into seven groups with roughly similar levels of tax morale; and finally we asked the participants to identify the country group containing their home country. Table 2 also provides information on the participants’ performance in the laboratory in terms of knowledge (i.e. number of trivia questions answered correctly) and gross lab income (measured in tokens). As the table shows, there were no major socio-demographic or performance differences between the three treatment groups.
The socio-demographic characteristics and performance of the participants

The treatments
The experiment followed a three-group between-subjects design: participants were randomly assigned to a baseline, a donation or a lucky group (see Table 2). The expected monetary utility of tax (non)compliance was essentially equal across these three groups:
 $$UE=\left( {1\,{\minus}\,a} \right)\left( {I-td} \right){\plus}a\left[ {I-td-pt\left( {I-d} \right)} \right]$$
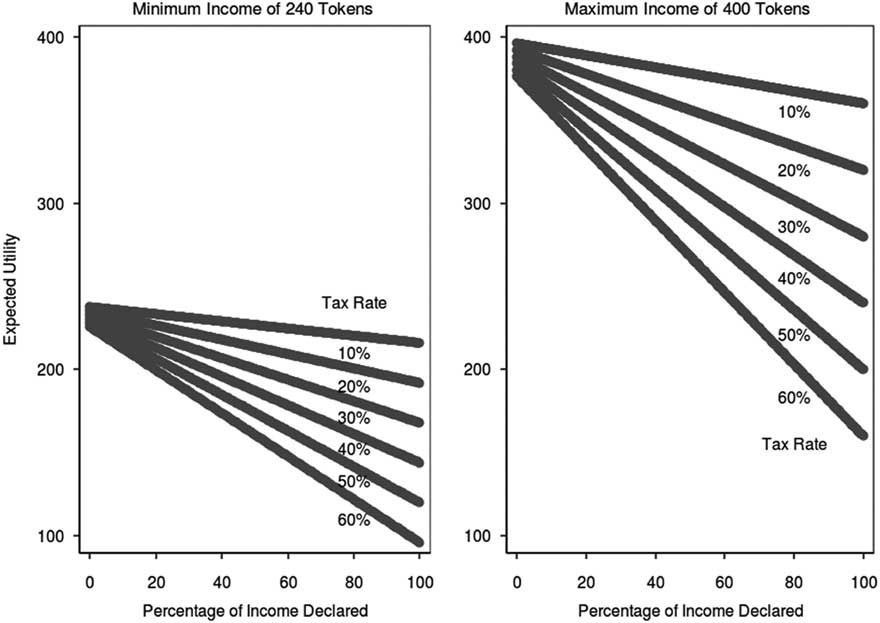
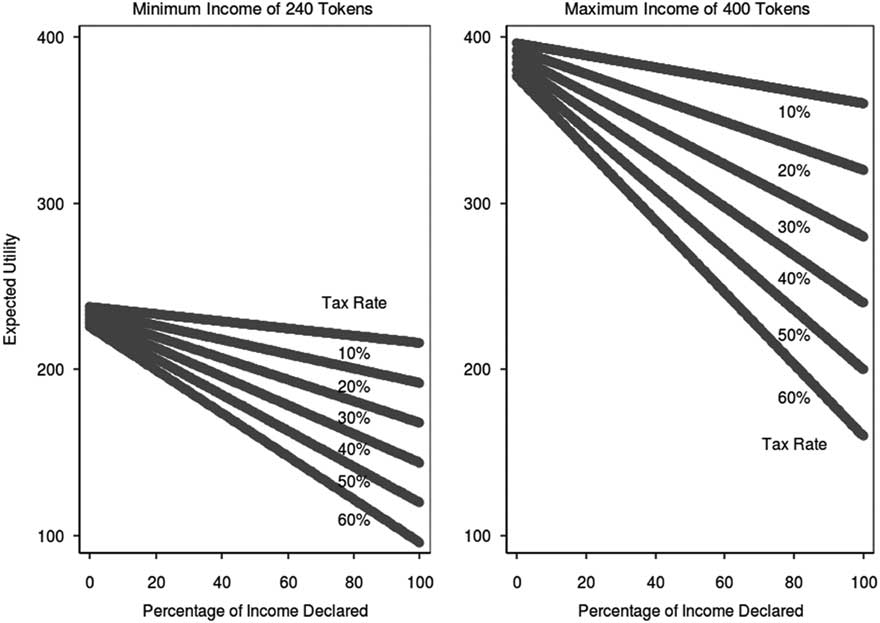
This is essentially Allingham and Sandmo’s (Reference Allingham and Sandmo1972) standard deterrence model of tax compliance. Each participant had to choose how much income (I) to declare (d), which was then taxed (t), and in the case of an audit (a) participants were subjected to a penalty (p) if they had cheated (I−d≠0). Given the tax, audit and penalty rates in our experiment (see Table 1), the income-maximising strategy in all three treatments was to evade all tax: the expected monetary value of a strategy of general tax evasion is strictly higher than the expected monetary value of any level of tax compliance, as Figure A.1 simulates for the minimum and maximum income.
The baseline corresponds to the bare-bones deterrence model: tax compliance is encouraged, and tax evasion deterred, solely by the threat of audits and fines. The expected utility of (non)compliance depends entirely on the audit rate and the level of fines. Importantly, neither the audit rate nor the size of the fine varied across rounds or participants. They were set at levels that would not deter a fully informed and rational monetary utility maximiser. Hence, in a neo-classical framework, we would expect no participant to pay any tax (zero compliance).
The donation treatment extends the baseline by adding an immaterial reward for tax compliance. Participants were offered a choice between three alternative spending purposes. They could earmark their money for recreational facilities on Campus and/or for the financial support of needy students and/or for the invitation of VIPs to campus. The participants could freely allocate their tax payments among these three purposes – but only if they were not found cheating. In case they were audited and found to have evaded taxes, the evaded taxes and the fine went straight to the general budget of Jacob University’s student government. The opportunity to decide on the spending purpose was then foregone. Importantly, the expected monetary utility of noncompliance does not change from the baseline. The present monetary value of a strategy of zero compliance is still strictly higher than the present monetary value of a strategy of full or partial compliance. What may change, however, is the subjective value of the tax payment for the participant. It may no longer be conceived solely as a pure cost but also as an opportunity to exercise agency (Lamberton et al. Reference Martin and Dolan2014) and to benefit from the “warm glow” (Andreoni Reference Andreoni1990) of prosocial giving. We, therefore, expect an increase in tax compliance relative to the deterrence baseline.
The lucky treatment also builds on the baseline, but adds a material reward for tax compliance. Under this treatment, participants who were audited and found to be honest received a lottery ticket with a one in 800,000 chance of winning 10,000 euros.Footnote 7 Again, the baseline calculus of tax compliance did not change: tax evasion remains the dominant strategy for maximising expected monetary income. The low probability of winning 10,000 euros simply does not compensate for the relatively high probability of saving money through tax evasion. Nevertheless, we would expect tax compliance to increase because people are known to systematically overrate low probabilities (prospect theory), because they fancy the idea of getting something big for almost nothing (Perez and Humphreys Reference Seely2013) and because they generally enjoy the “dream of the good life” (Casey Reference Casey2008, 122) embodied by a lottery ticket.
Results
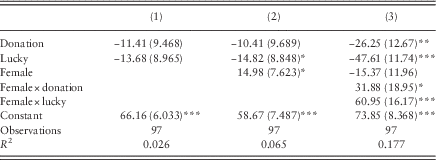
Table 3 shows the effects of our treatments on tax compliance using ordinary least square regressions with robust standard errors. The findings suggest that positive rewards affect tax compliance behaviour but that the size and direction of the effect are conditioned by gender.
Three regression models of tax compliance
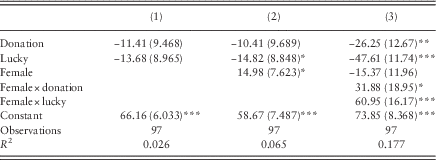
Note: Robust standard errors in parentheses.
***p<0.01, **p<0.05, *p<0.1.
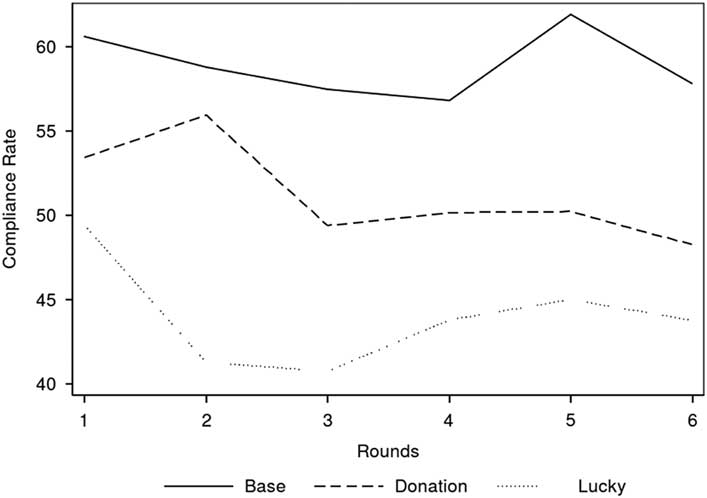
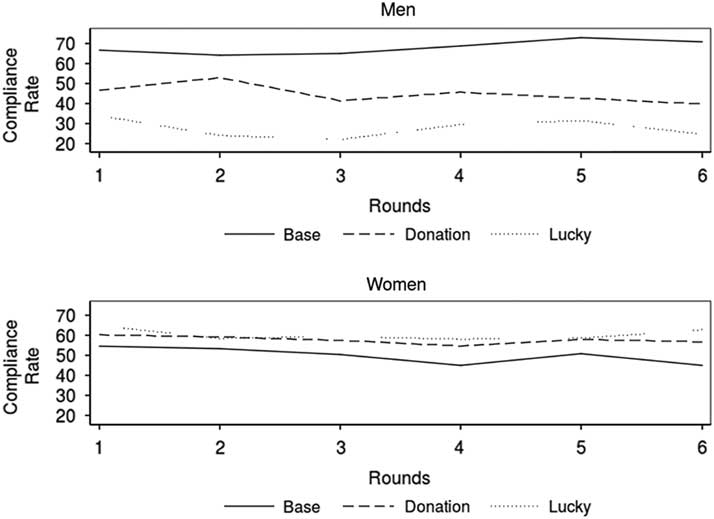
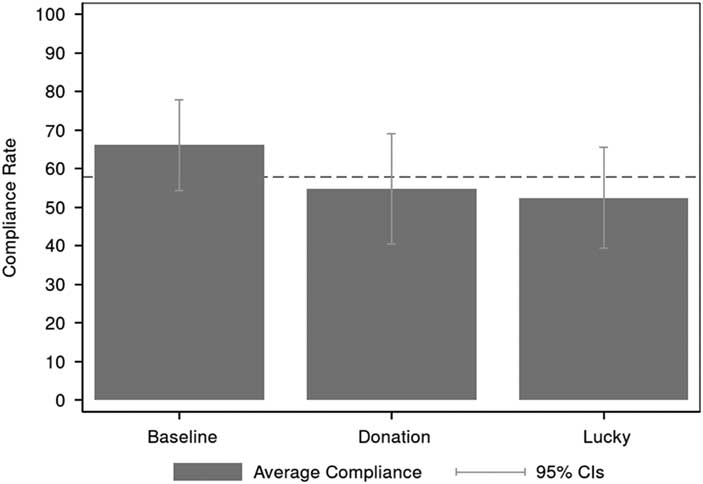
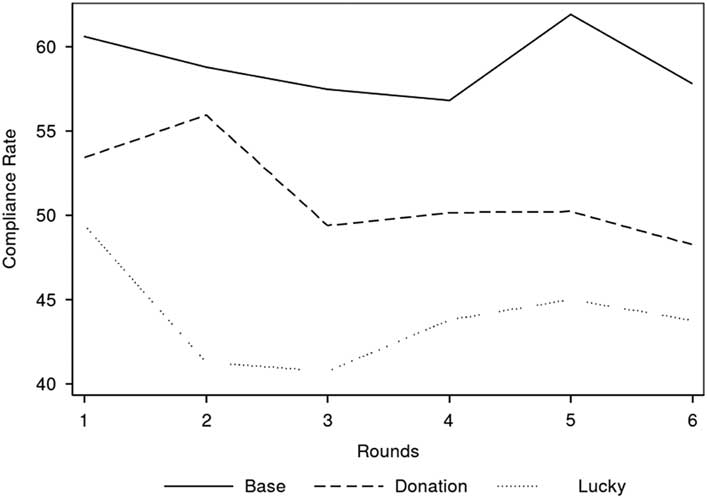
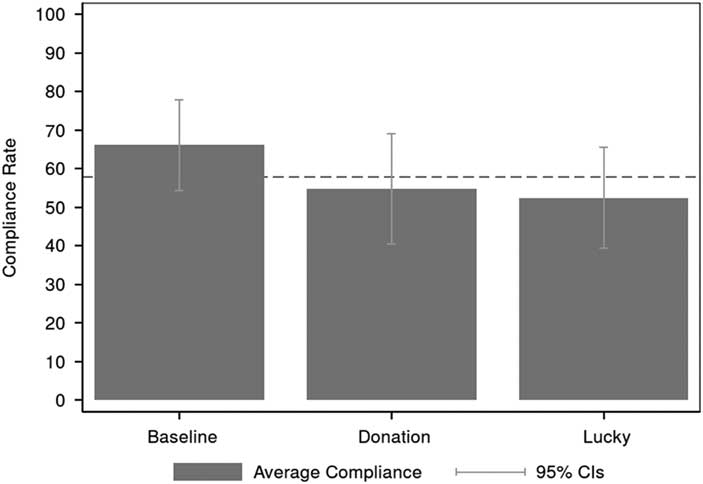
Model 1 compared tax compliance under the two reward treatments (lucky and donation) with tax compliance under the baseline. The findings suggest that the reward treatments decrease rather than increase tax compliance (see Figure A.2). Although the effect was not statistically significant, it was quite consistent across rounds (see Figure A.3). In all rounds, participants cheated the most under the lucky treatment and cheated the least under the baseline treatment. Tax evasion under the donation treatment was always in between these extremes. Based on this evidence, we would have to reject our hypothesis: if positive rewards have any effect on tax compliance at all, it is negative rather than positive.
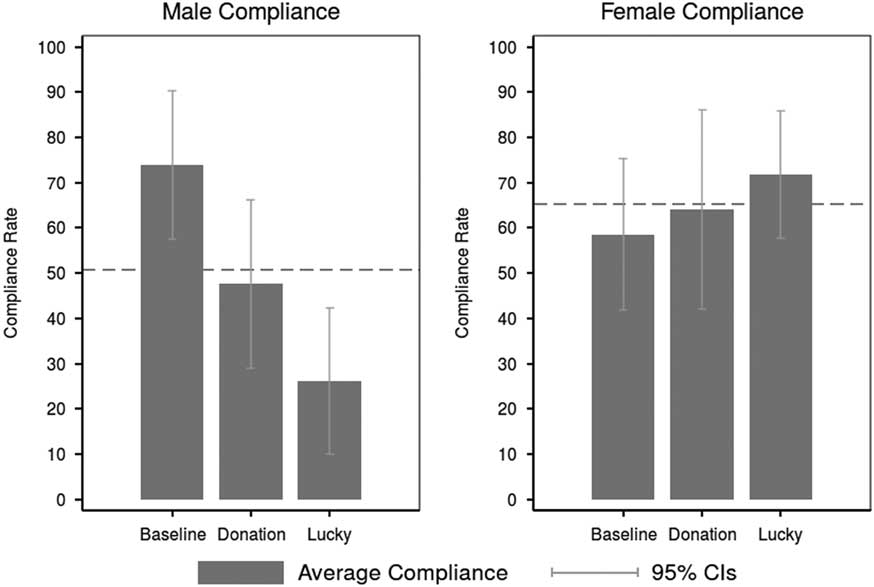
Model 2 (Table 3) included a dummy variable for women. The results are in line with previous findings on gender differences in tax compliance (e.g. Friedland et al. Reference Gilligan1978; Spicer and Becker Reference Steinmo1980; van Dijke and Verboon Reference Druckman and Kam2010). Women are generally more compliant than men (see dotted line in Figure 1). This level effect was weakly significant. As model 3 reveals, however, what matters is not so much the gender difference in general compliance levels but the gender difference in the direction of the treatment effect. Including interaction terms of the female dummy with the two reward treatments (donation and lucky), model 3 reveals important interaction effects. We have shown them in Figure 1.
Average compliance across gender and treatments Note: CIs=confidence intervals.
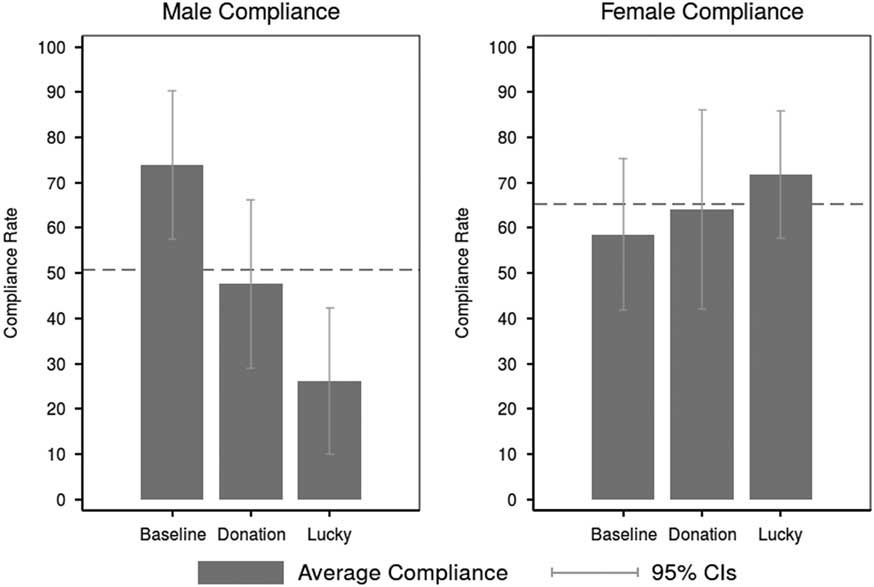
Figure 1 highlights four gender differences. First, most obviously, the reward treatments (Donation and Lucky) elicit opposite responses in male and female participants. Although female participants react with a moderate reduction of tax evasion, in line with our hypothesis, male participants react by a strong increase in tax evasion, against our hypothesis.
Second, the deterrence approach (i.e. the baseline) best ensures tax compliance among men, but it is the least effective approach to ensuring tax compliance among women. Although female participants evaded less tax on average across all three treatments (see model 2), they evaded more tax under the baseline than their male peers. In fact, male participants in the baseline group showed the highest absolute level of tax compliance among all comparative groups, as shown in Figure 1. Even under the lucky treatment – i.e., the treatment where women were most compliant – they evaded slightly more tax than male participants under the deterrence baseline.
Third, treatment effects are much larger among male than female participants. Most prominently, male compliance under the lucky treatment was only one-third of male tax compliance under the baseline. Male lucky compliance was also dramatically lower than female compliance under any of these three treatments. Model 1’s finding that positive rewards reduce overall tax compliance is entirely driven by the strong negative reactions of the male participants, which completely swamped the weakly positive reactions of the female participants.
Finally, Figure 1 suggests (as also Figure 2) that men react more strongly to the difference between the immaterial donation treatment and the material lucky treatment. For women, in contrast, this difference hardly matters.
Average compliance across rounds, gender and treatments
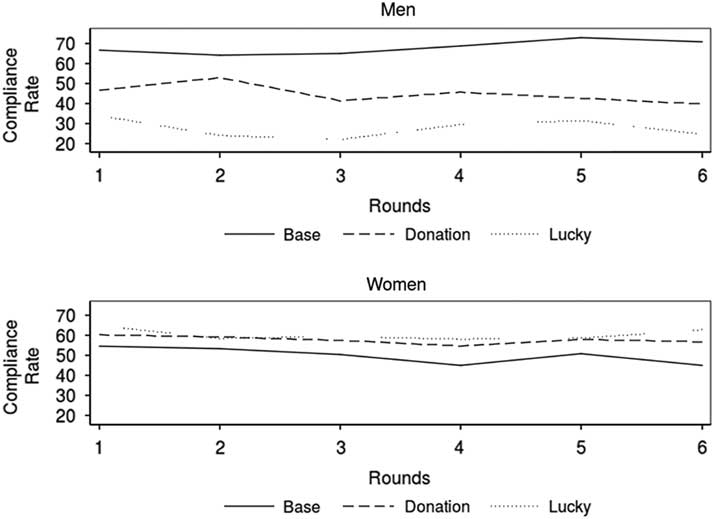
Obviously, not all the differences between sexes and treatments were statistically significant (see Table 3 and Figure 1). Given the low number of participants per category (three treatments×two genders), this is unsurprising. Yet, the differences were very consistent across rounds. As Figure 2 shows, male participants consistently evaded taxes the most under the lucky treatment and evaded taxes the least under the baseline treatment. With female participants, it was the opposite, and across all rounds treatment effects were larger for men than for women. The overall consistency of these findings increases our confidence in their robustness.
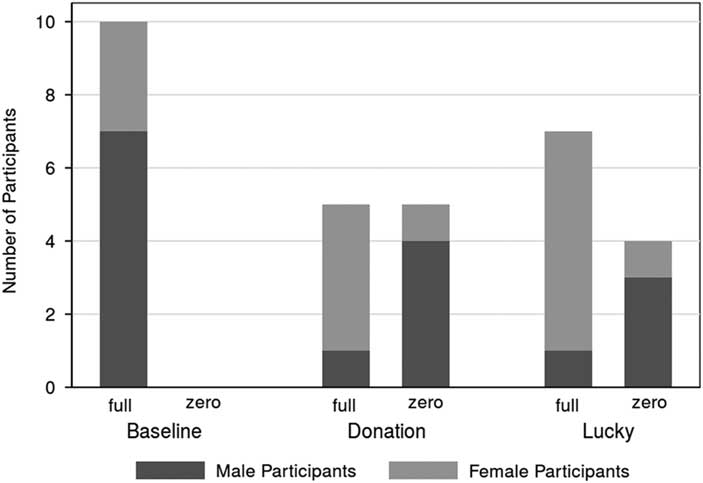
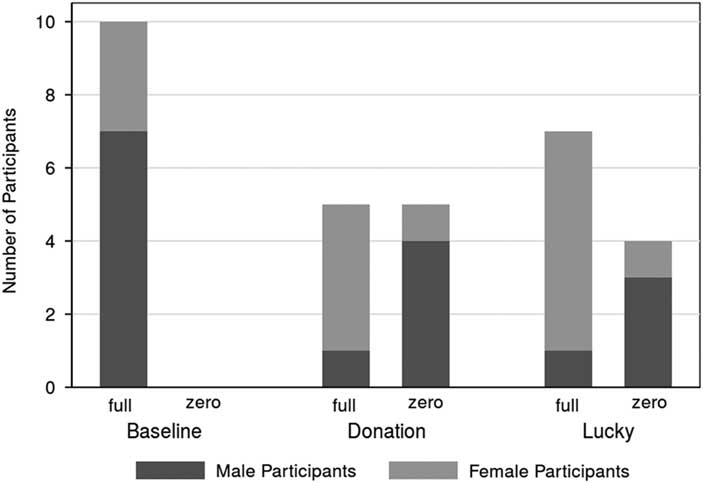
As a further robustness check, we compared the extreme strategies of full compliance (i.e. declaring 100% of income across all rounds) and zero compliance (i.e. evading 100% of income across all rounds). As Figure 3 shows, women were generally more likely to opt for full compliance, and men were more likely to opt for zero compliance. The baseline treatment was the only case where more men were fully compliant than women. Moreover, the baseline treatment was the only treatment under which no participant opted for zero compliance.
Compliance strategies by treatment and gender
Finally, we also checked for the influence of socio-demographic controls other than gender: age, class, religiosity and home country tax morale. None of these variables affected the results. We also checked whether the experiment affected the subjective well-being of the participants,Footnote 8 but we found no evidence for that either.
Discussion
As the previous section has shown, positive rewards did not affect aggregate tax compliance levels in our sample, because the reward treatments significantly interacted with gender: although positive rewards increased female tax compliance, they strongly decreased male compliance. How can we account for this pronounced gender difference? Taking cue from the approaches to tax compliance discussed above in the section on “How to improve tax compliance?”, we explore three possible explanations. First, our “positive” rewards have a negative utility for men. Second, the reward treatments reduce the perceived audit probabilities of male (but not of female) participants, and thus “crowd-out” (Frey and Jegen Reference Friedland, Maital and Rutenberg2001) threat-based motivations to comply. Third, the reward treatments erode the feeling of normative obligations to pay taxes in male (but not in female) participants, and thus undermine norm-based motivations to comply.
Wrong rewards?
Could it be that our rewards (lucky and donation) were perceived as unattractive and harmful by male participants? This is unlikely! As noted above, we did not find any association between treatment groups and participants’ subjective well-being during or after the experiment. Moreover, quite obviously, men do play the lottery in the real world and donate to charitable causes. In fact, American men gamble on the lottery more than women (Barnes et al. Reference Barnes, Welte, Tidwell and Hoffman2011), and there is no conclusive evidence that men are less socially oriented than women (Croson and Gneezy Reference Cummings, Martinez-Vazquez, McKee and Torgler2009). Research by Andreoni and Vesterlund even suggests that men behave more altruistically when altruism is “cheap” (Reference Andreoni and Vesterlund2001). If this was true, the male participants in our experiment should have reacted positively to the costless option of prosocial giving offered by the donation treatment. In short, we do believe that our rewards have positive utility for male and female participants alike. If they failed to raise male compliance, nevertheless, it must have been because their positive motivational force was swamped by negative side effects.
Changes in perceived audit probabilities?
One possible side effect could be a change in perceived audit probabilities.Footnote 9 Perhaps our reward treatments induced participants to reassess the risks associated with noncompliance, and thus inadvertently change participants’ threat-based motivation to comply (Frey and Jegen Reference Friedland, Maital and Rutenberg2001, 592). Compared with the baseline, the reward treatments confront participants with a more complex decision-making environment. Participants think harder about the decision problem, which in turn increases their awareness of each individual decision factor, including audit probabilities. Yet, why should the direction of the reassessment vary with gender? Why should male but not female participants adjust perceived audit probabilities downwards?
The answer, we surmise, is gender differences in risk preferences. There is extensive evidence that men are more risk-seeking than women in laboratory experiments and in decision-making situations in the field. The reasons for this are not entirely clear. Perhaps women avoid risky situations because they experience them as emotionally stressful, and perhaps men seek risky situations because they perceive them as challenging and ego-involving or because they tend to be overconfident of their success (see Croson and Gneezy Reference Cummings, Martinez-Vazquez, McKee and Torgler2009, 449–454 for a review). Perhaps the gender difference in risk behaviour reflects differences in nurture: boys and girls tend to be raised differently. Perhaps they reflect differences in nature: female reproductive success tends to depend on risk avoidance and male reproductive success on risk acceptance (e.g. Niederle and Verstelund Reference Perez and Humphreys2007, 1070–1071). Whatever the reason, the higher risk tolerance of men may bias them towards adjusting perceived audit probabilities downwards in our experiment. Especially the low winning probabilities under the lucky treatment could alert them to the relatively high “winning” probabilities of noncompliance. This would explain why male compliance was so dramatically low under this treatment.
Changes in perceived normative obligation?
Another side effect of positive rewards could be a change in the normative framing of tax payments. Perhaps the reward treatments introduced an element of voluntarism into the taxpaying situation that eroded feelings of civic responsibility and normative obligation (Frey and Jegen Reference Friedland, Maital and Rutenberg2001, 597). However, why should this mechanism only erode male but not female compliance?
One possible explanation is nurtured gender differences in social attitudes. Following Gilligan (Reference Harbaugh, Mayr and Burghart1982), various authors have argued that men tend to make decisions on the basis of fairly rigid normative principles, whereas women are more situationally opportunistic in their judgements: men do what they consider the normatively ‘right thing to do’; women do what they consider the socially conducive thing to do (Eckel and Grossman 1996; Croson and Gneezy Reference Cummings, Martinez-Vazquez, McKee and Torgler2009). Paying taxes may still be the socially conducive thing to do if a positive reward is added to the normative duty to pay. This would explain why female tax compliance improved slightly under the two reward treatments. However, paying taxes may no longer appear to be the normatively required thing to do, if combined with rewards appealing to the taxpayers’ individual utility. Prima facie, of course, it looks plausible to sell tax compliance to taxpayers in the same way that food makers sell breakfast cereals to consumers – namely, by linking it to a lottery (Martin and Dolan Reference McDermott2010) or to a charitable cause. In doing so, however, one may inadvertently reduce the taxpayer’s sense of civic duty to pay taxes to the consumer’s sense of duty to brand loyalty. To the extent that men are more normatively driven than women, they react more strongly to this reward-induced erosion of normative obligation.
Although our explanations are tentative and post hoc, they are consistent with other gender-by-treatment interaction effects that are reported, but hardly theorised, in the literature. Hasseldine and Hite (Reference John, Cotterill, Richardson, Moseley, Stoker, Wales and Smith2003) found in a field experiment that men react with more and women with less compliance to negatively framed messages concerning their tax liability. Chung and Trivedi (Reference Chung and Trivedi2003) report that “friendly persuasion” increases tax compliance in women but not in men. In addition, Kastlunger et al. (Reference Kinsey2010) observed that the experience of an audit triggers significantly lower tax compliance in men than in women. Neither of these studies offered a coherent explanation for the gender-by-treatment interactions they observed. The two explanatory mechanisms suggested above – differences in risk preferences and in social attitudes – potentially fill this gap.
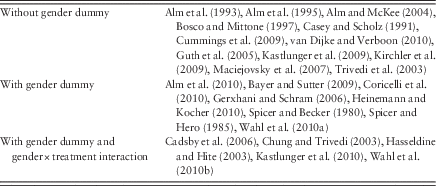
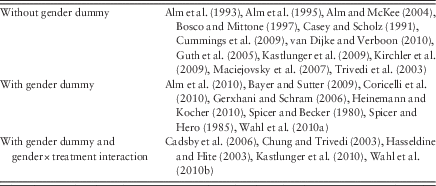
More research is necessary to understand gender effects in tax compliance. This requires, most basically, that researchers routinely control for and report the gender of their participants (as suggested by Croson and Gneezy Reference Cummings, Martinez-Vazquez, McKee and Torgler2009, 468). Surprisingly, only a few do so. In the sample of 25 experimental studies that we mainly consulted when writing this article, only 13 reported gender controls (see Table A.1). A second requirement is that researchers check for gender-by-treatment interactions. As our experiment shows, gender matters not only for the level but sometimes also for the direction of treatment effects: we did not find a main effect because the opposing treatment effects for male and female participants cancelled each other out. Had we not controlled for the interaction with gender, we would have been led to the false conclusion that positive rewards do not matter for taxpaying behaviour. Unfortunately, only very few studies control for and report gender interactions in addition to gender dummies. In our sample of 25 studies, only five of them did so (see Table A.1).
Policy implications?
Should Greece introduce a receipt-based VAT lottery after threats (i.e. fines for consumers who leave business premises without a purchase receipt) and normative appeals (i.e. a patriotic campaign for tax compliance) have failed to curb tax evasion (Fooken et al. Reference Frey, Benz and Stutzer2014, 17)? Should reward systems such as the Spanish income tax designation scheme or the Japanese hometown tax be copied by other countries? Our findings do not allow for an easy answer. They point at two fundamental problems of reward-based tax compliance schemes that deserve further investigation, preferably in randomised controlled trials in the field that transcend the inherent limits of our laboratory experiment (John et al. Reference Karlan and List2013).
One problem is that positive rewards may, under certain conditions, crowd-out threat-based or norm-based motivations for tax compliance. Although excessive fear of the tax authorities may alienate taxpayers, excessive rewards may also inadvertently erode compliance by reducing the deterrence value of audits and fines or by obscuring the obligatory character of taxation. Obviously, governments should make tax compliance as simple as possible. Yet, they should not necessarily make it positively rewarding for the individual taxpayer. Some activities may have community-building power precisely because they are not completely painless, including death and taxation.
A second problem is that positive rewards may affect men and women differently. In our experiment, women evaded the most under the baseline deterrence approach, whereas men evaded the least under this approach. Apparently, there is no unisex strategy for optimal tax compliance. Does it follow that governments should gender their tax compliance regimes – i.e., impose threat-based deterrence on men and offer gentle rewards to women? This would resonate with a new literature promoting gendered tax rates on efficiency grounds (Alesina et al. Reference Alesina, Ichino and Karabarbounis2011). Yet, it contradicts recent efforts to eliminate (usually pro-male) gender biases in taxation on equity grounds. Examples include disallowing the husband to submit a family tax return without the explicit consent of his wife (France), equalising tax allowances between men and women (Netherlands) and applying the same tax rates to married men and women (South Africa) (Stotsky Reference Sussman and Olivola1997; UNDP Reference van Dijke and Verboon2010). Same tax duties seem to imply a right to same tax treatment. Yet, treating essentially dissimilar events similarly is also unfair. Our research should stimulate not only new empirical research into (natured or nurtured) gender heterogeneities in the treatment effects of tax reforms but also normative research into the conditions under which different genders deserve or do not deserve different policy treatments.
Acknowledgements
The authors thank Thomas Brambor, Sebastian Dellepiane-Avellaneda, Ingo Fiedler, Christian von Haldenwang, Jaemin Shim, Stefan Traub, Clara Volintiru, Konstantin Vössing and Nan Zhang for their helpful comments, Dirk Schulte am Hülse and Moritz Bubek for technical support and Peter Heide and Taraq Kamda for excellent research assistance. The experiment was funded by the Nowetas Foundation. Philipp Genschel and Laura Seelkopf acknowledge the funding received from the German Research Foundation (Collaborative Research Center 597).
Appendix
Gender in tax compliance experiments
Simulated best responses for different tax rates and incomes
Average compliance rates across treatments Note: CIs=confidence intervals.
Average compliance rates across rounds and treatments